Wikipedia edits (et)
This is the bipartite edit network of the Estonian Wikipedia. It contains users
and pages from the Estonian Wikipedia, connected by edit events. Each edge
represents an edit. The dataset includes the timestamp of each edit.
Metadata
Statistics
| Size | n = | 424,139
|
| Left size | n1 = | 20,082
|
| Right size | n2 = | 404,057
|
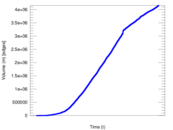
| Volume | m = | 4,156,964
|
| Unique edge count | m̿ = | 1,976,085
|
| Wedge count | s = | 29,596,386,434
|
| Claw count | z = | 655,551,923,356,209
|
| Cross count | x = | 1.565 23 × 1019
|
| 4-Tour count | T4 = | 416,038,912,926
|
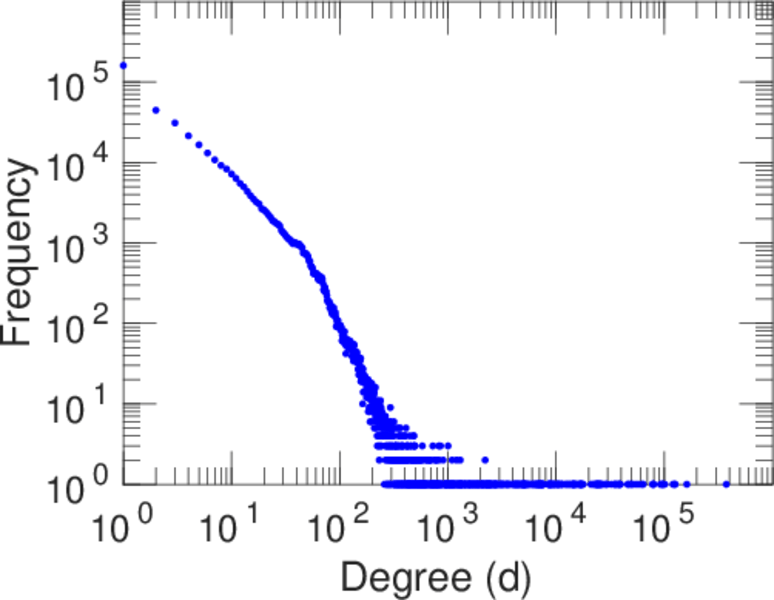
| Maximum degree | dmax = | 374,564
|
| Maximum left degree | d1max = | 374,564
|
| Maximum right degree | d2max = | 9,800
|
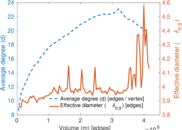
| Average degree | d = | 19.601 9
|
| Average left degree | d1 = | 207.000
|
| Average right degree | d2 = | 10.288 1
|
| Fill | p = | 0.000 243 532
|
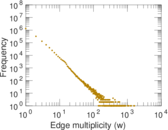
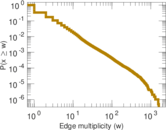
| Average edge multiplicity | m̃ = | 2.103 64
|
| Size of LCC | N = | 416,313
|
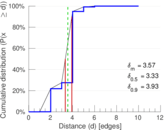
| Diameter | δ = | 12
|
| 50-Percentile effective diameter | δ0.5 = | 3.333 63
|
| 90-Percentile effective diameter | δ0.9 = | 3.927 03
|
| Median distance | δM = | 4
|
| Mean distance | δm = | 3.565 50
|
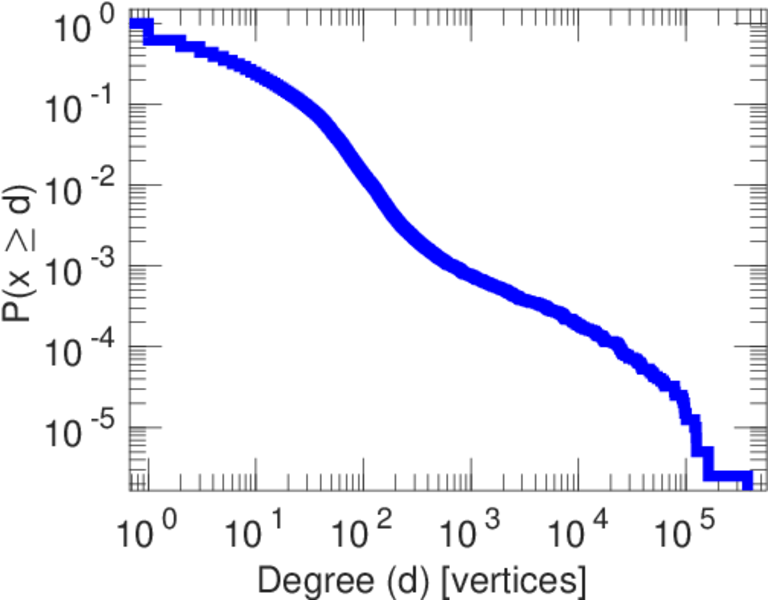
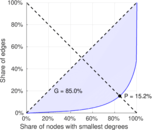
| Gini coefficient | G = | 0.854 172
|
| Balanced inequality ratio | P = | 0.151 652
|
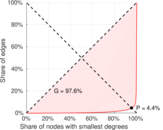
| Left balanced inequality ratio | P1 = | 0.044 125 0
|
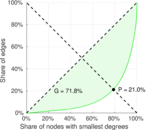
| Right balanced inequality ratio | P2 = | 0.209 888
|
| Relative edge distribution entropy | Her = | 0.721 530
|
| Tail power law exponent with p | γ3 = | 3.151 00
|
| p-value | p = | 0.000 00
|
| Left tail power law exponent with p | γ3,1 = | 1.741 00
|
| Left p-value | p1 = | 0.000 00
|
| Right tail power law exponent with p | γ3,2 = | 4.641 00
|
| Right p-value | p2 = | 0.000 00
|
| Degree assortativity | ρ = | −0.213 560
|
| Degree assortativity p-value | pρ = | 0.000 00
|
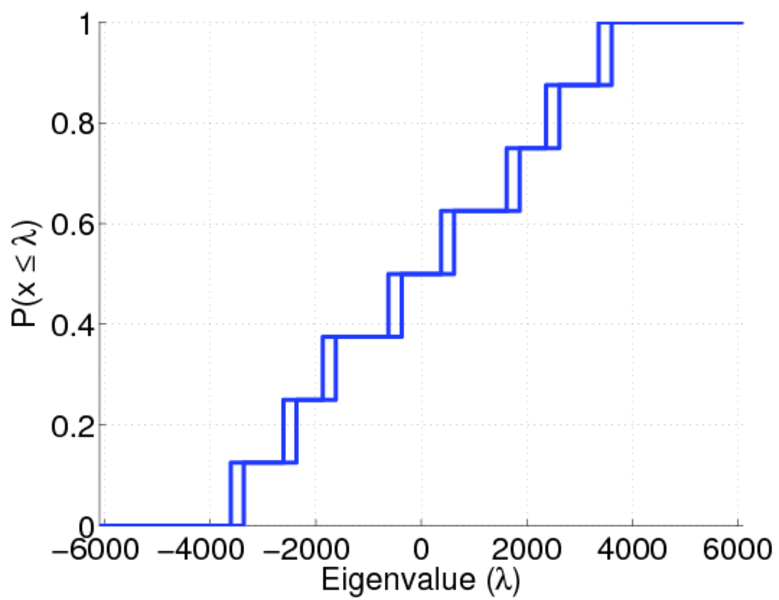
| Spectral norm | α = | 6,100.56
|
| Algebraic connectivity | a = | 0.008 531 99
|
| Spectral separation | |λ1[A] / λ2[A]| = | 2.696 92
|
| Controllability | C = | 381,118
|
| Relative controllability | Cr = | 0.911 510
|
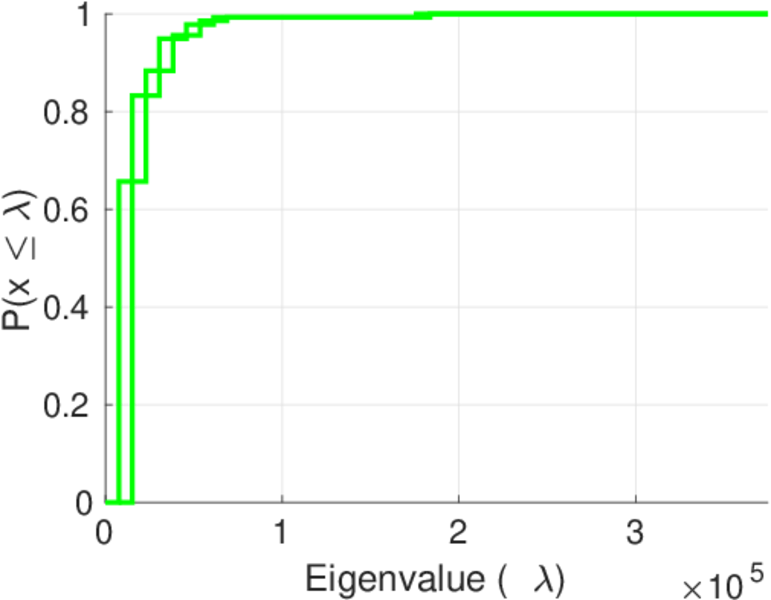
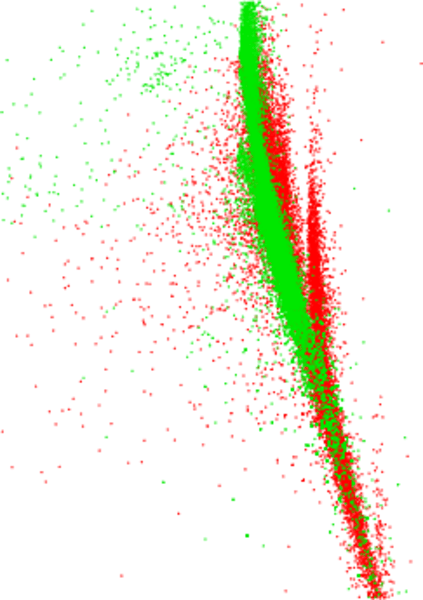
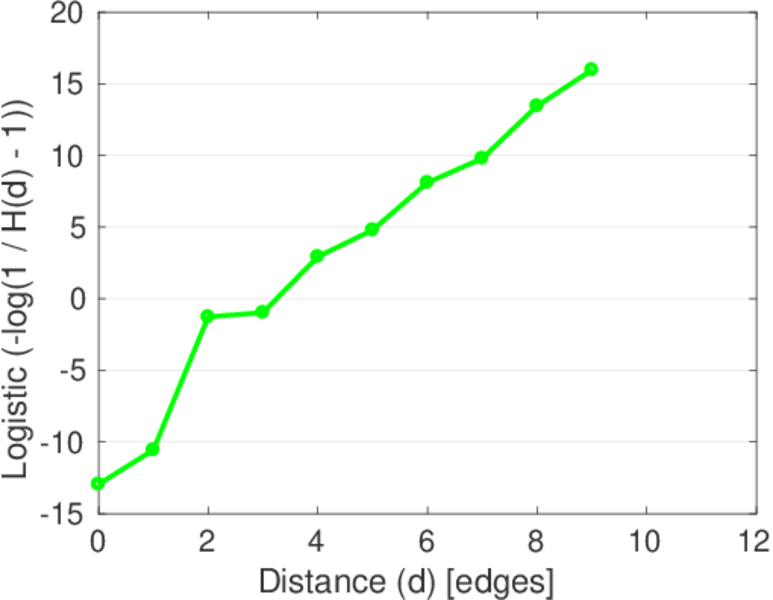
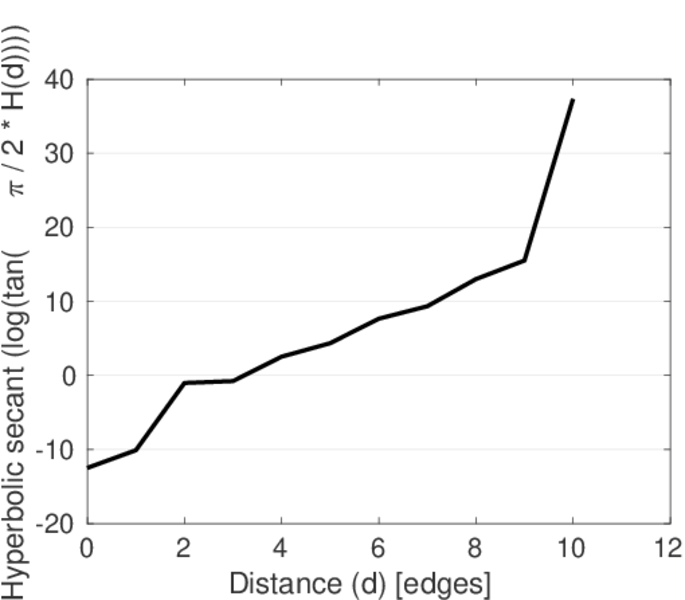
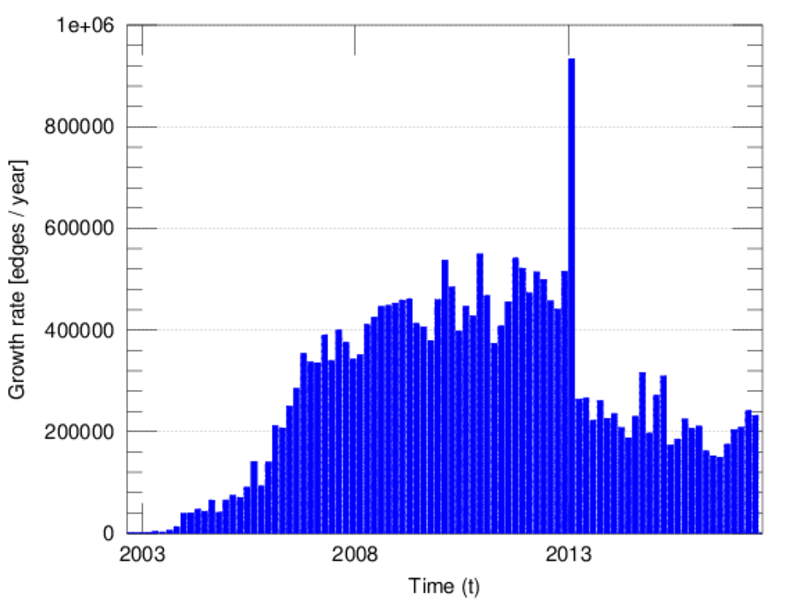
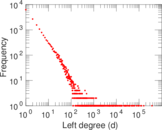
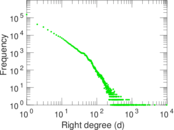
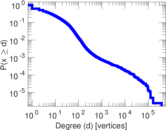
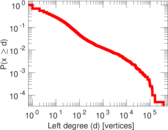
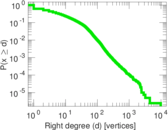
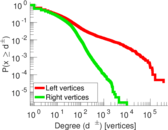
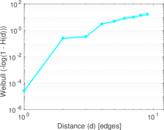
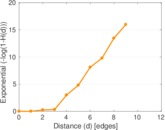
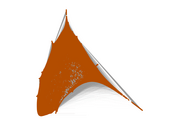
Plots


Downloads
References
|
[1]
|
Jérôme Kunegis.
KONECT – The Koblenz Network Collection.
In Proc. Int. Conf. on World Wide Web Companion, pages
1343–1350, 2013.
[ http ]
|
|
[2]
|
Wikimedia Foundation.
Wikimedia downloads.
http://dumps.wikimedia.org/, January 2010.
|
 KONECT ‣ Networks ‣
Buy Me a Coffee
KONECT ‣ Networks ‣
Buy Me a Coffee