Wikipedia edits (eu)
This is the bipartite edit network of the Basque Wikipedia. It contains users
and pages from the Basque Wikipedia, connected by edit events. Each edge
represents an edit. The dataset includes the timestamp of each edit.
Metadata
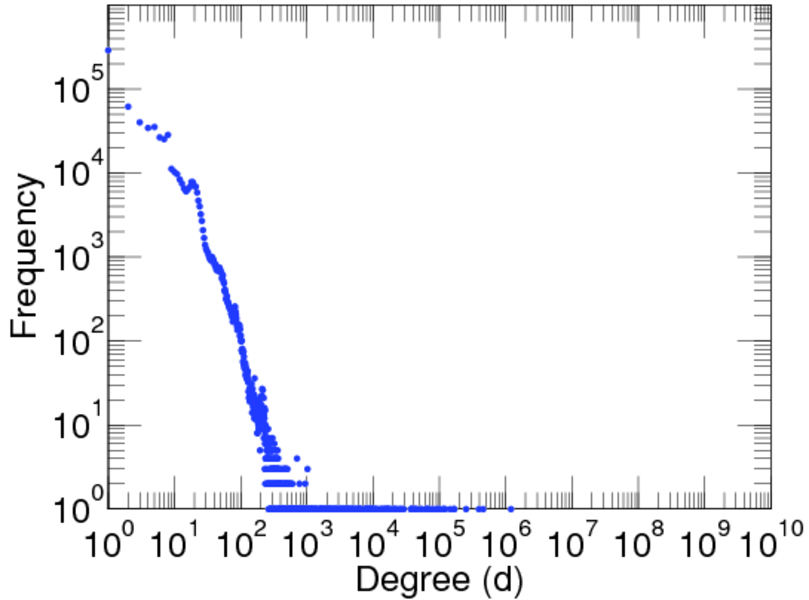
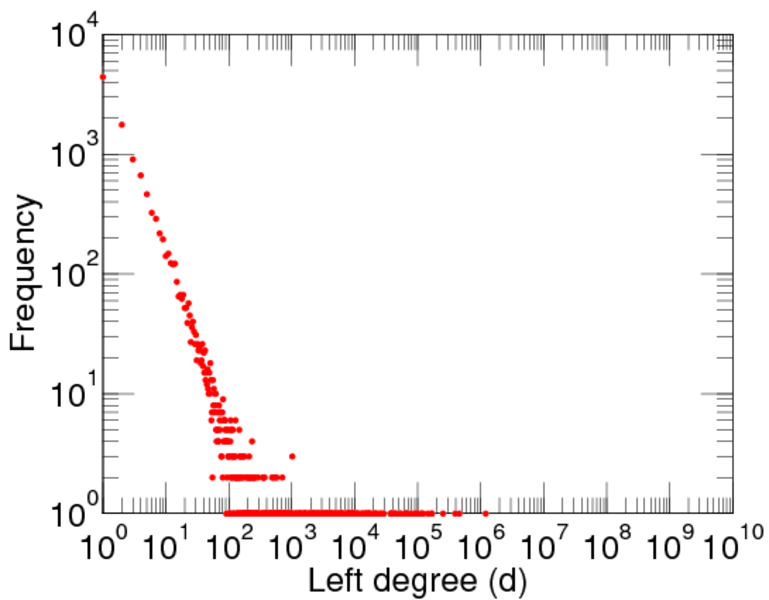
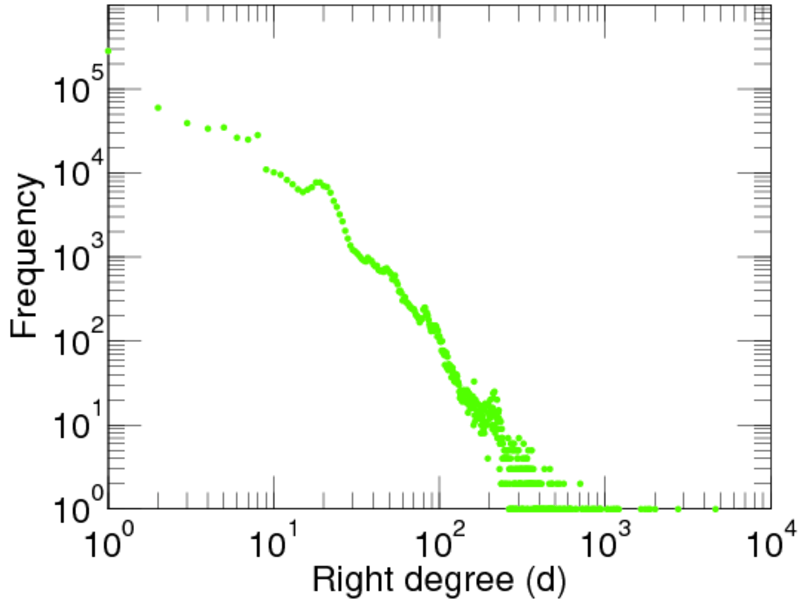
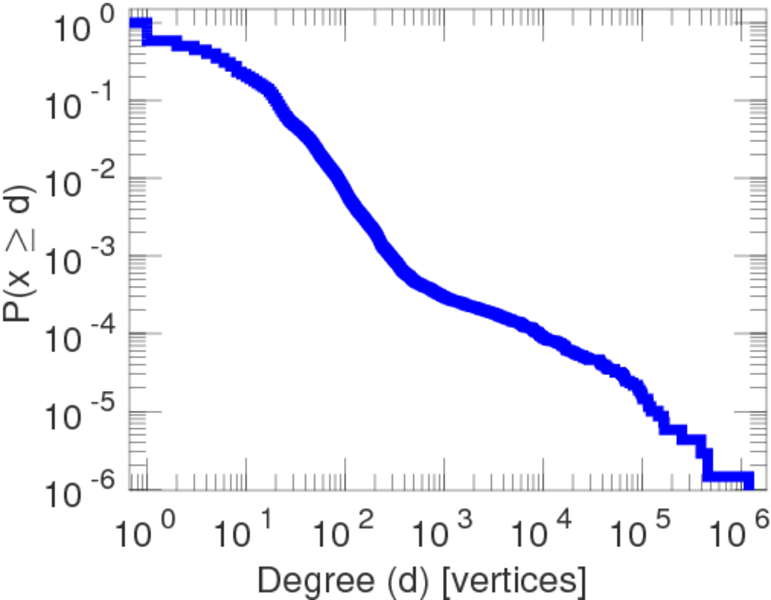
Statistics
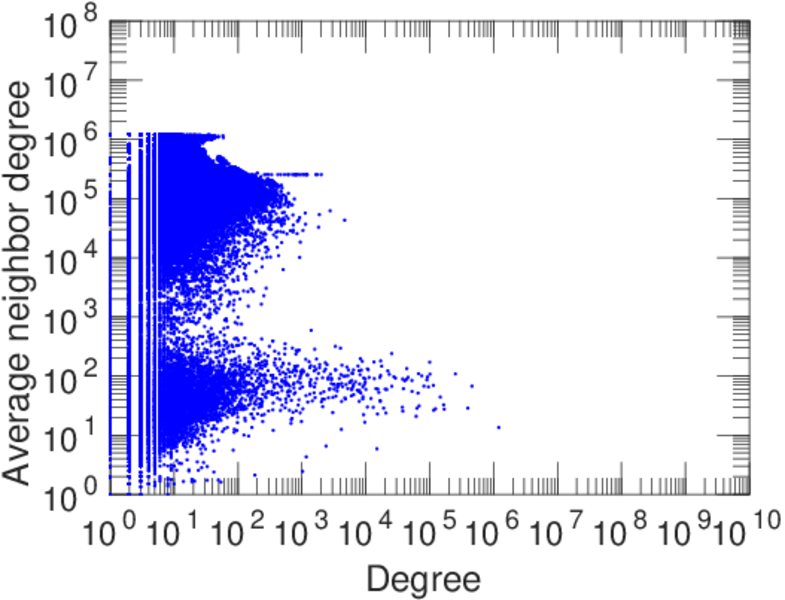
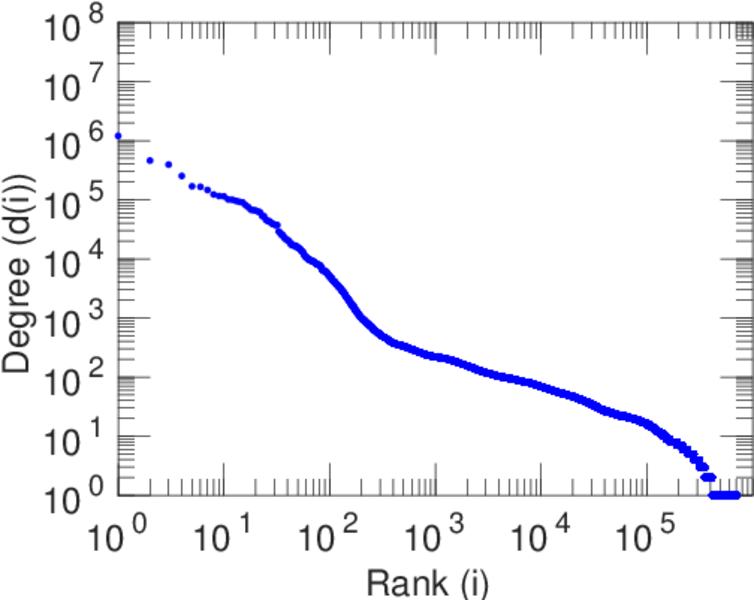
| Size | n = | 705,324
|
| Left size | n1 = | 11,806
|
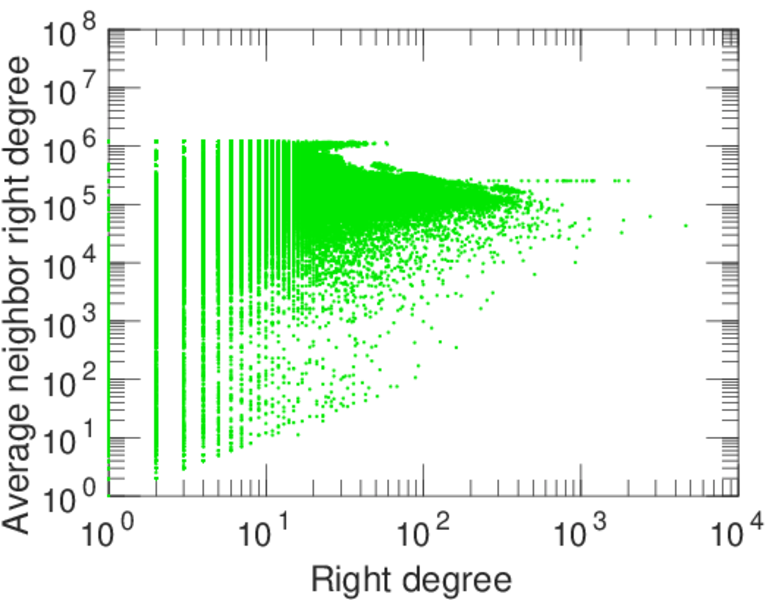
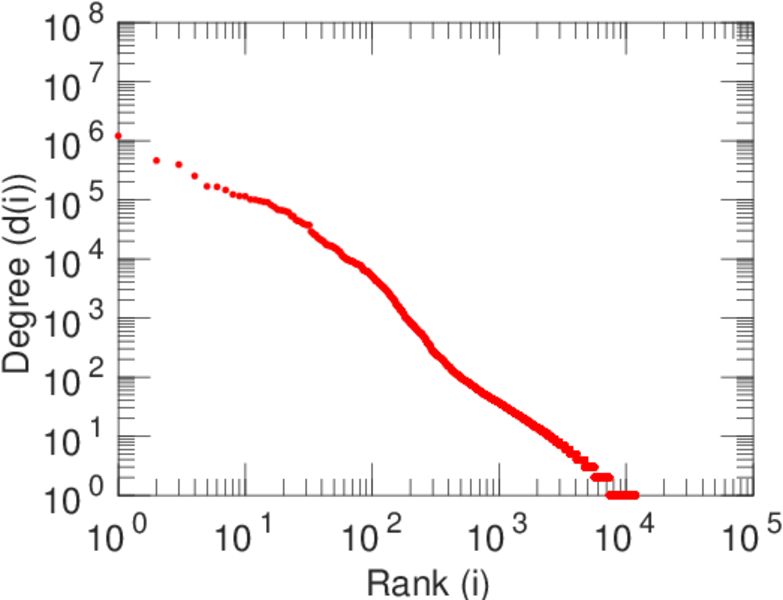
| Right size | n2 = | 693,518
|
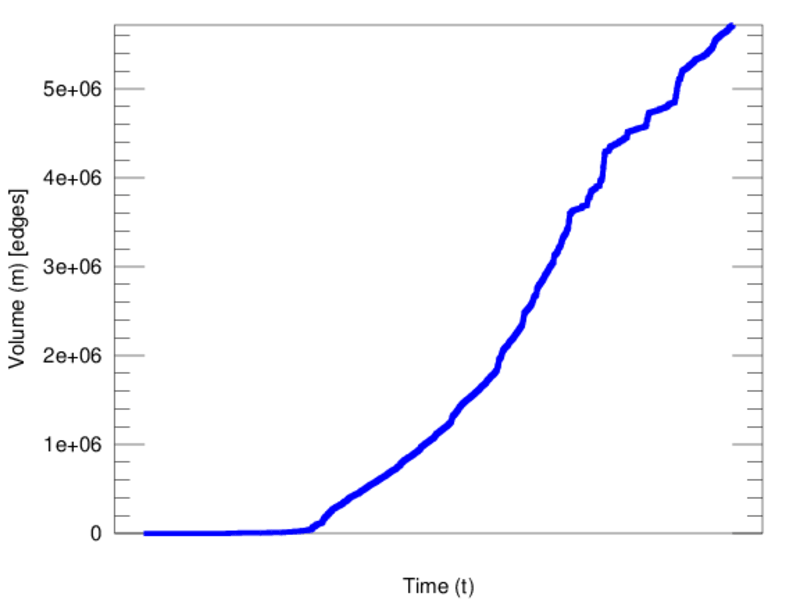
| Volume | m = | 5,718,362
|
| Unique edge count | m̿ = | 2,829,692
|
| Wedge count | s = | 174,520,732,934
|
| Claw count | z = | 17,195,159,739,852,608
|
| Cross count | x = | 1.636 31 × 1021
|
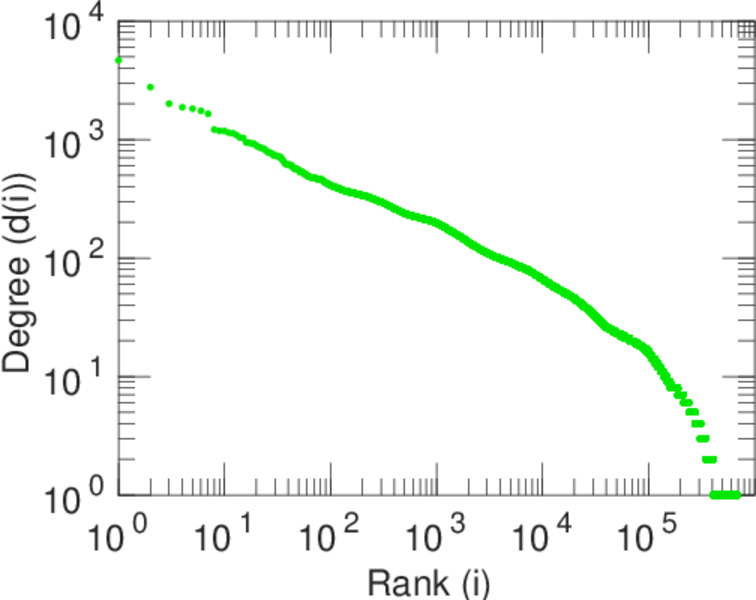
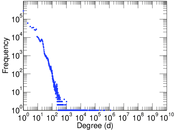
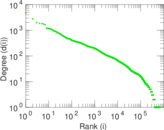
| Maximum degree | dmax = | 1,202,258
|
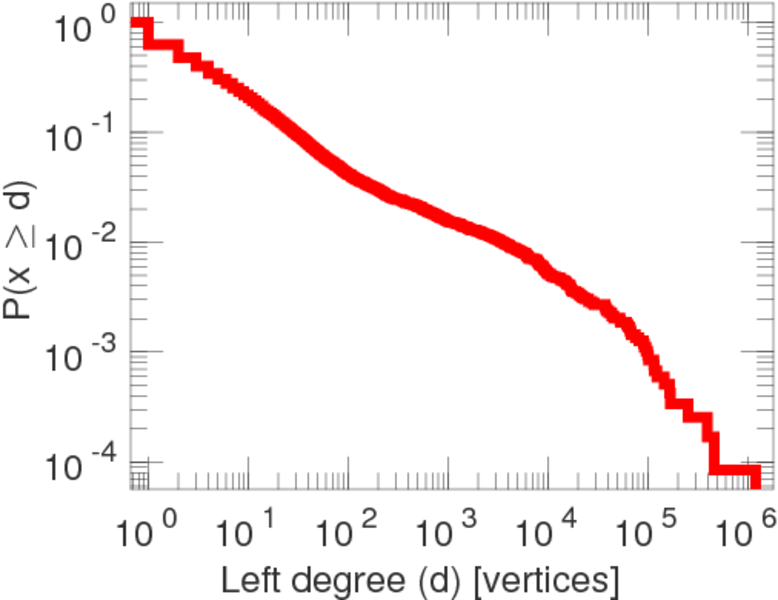
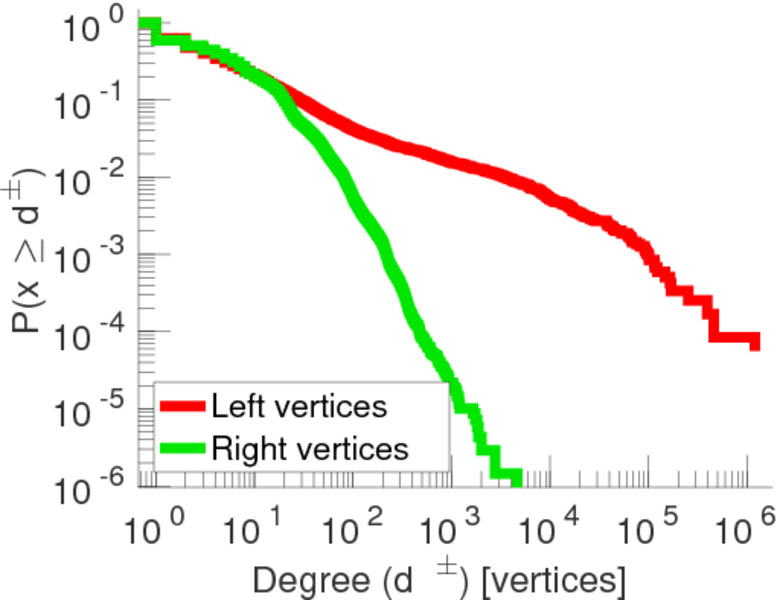
| Maximum left degree | d1max = | 1,202,258
|
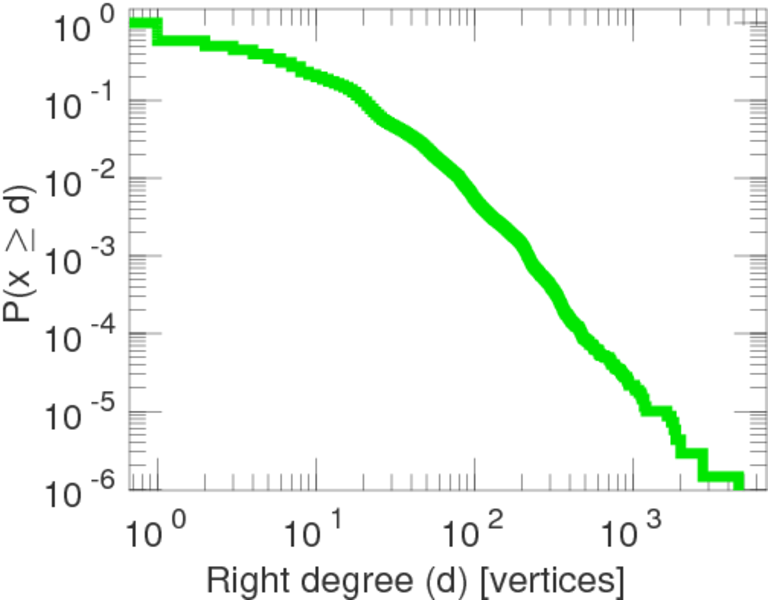
| Maximum right degree | d2max = | 4,651
|
| Average degree | d = | 16.214 9
|
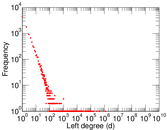
| Average left degree | d1 = | 484.361
|
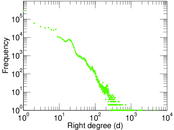
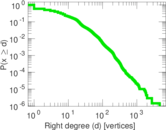
| Average right degree | d2 = | 8.245 44
|
| Fill | p = | 0.000 345 604
|
| Average edge multiplicity | m̃ = | 2.020 84
|
| Size of LCC | N = | 702,229
|
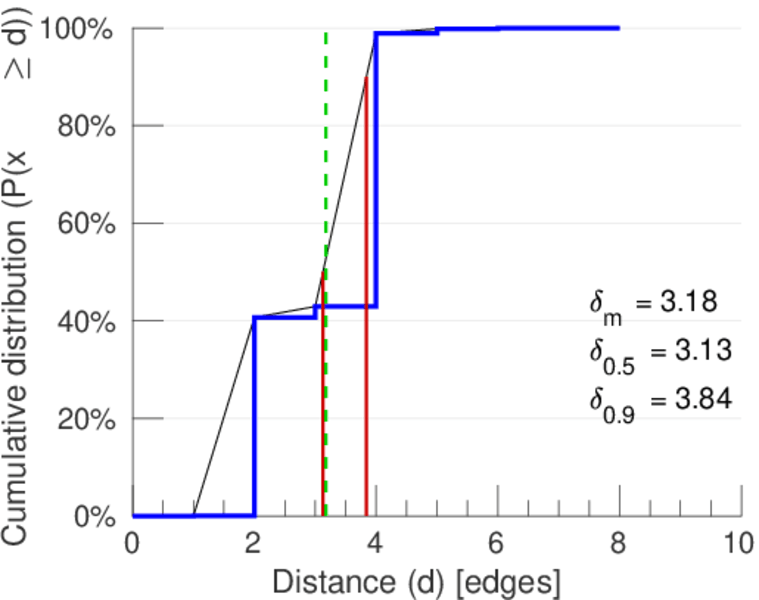
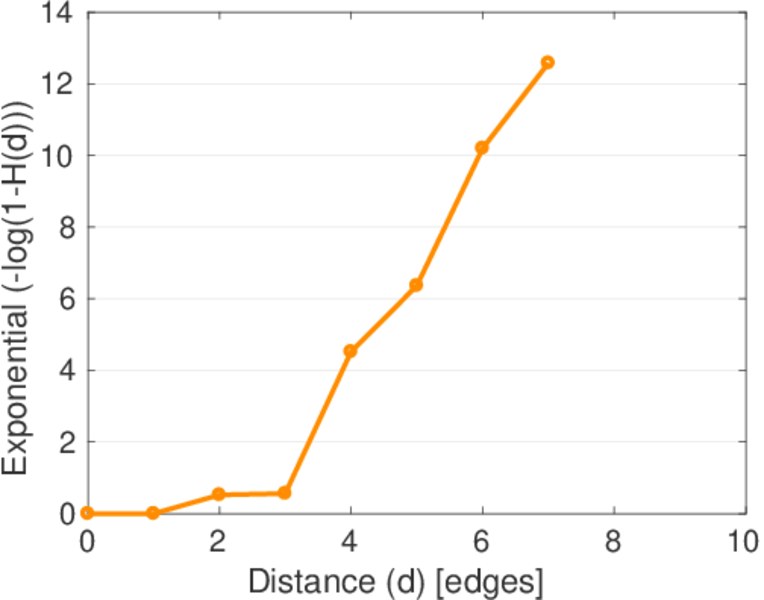
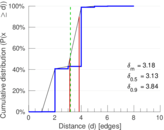
| Diameter | δ = | 11
|
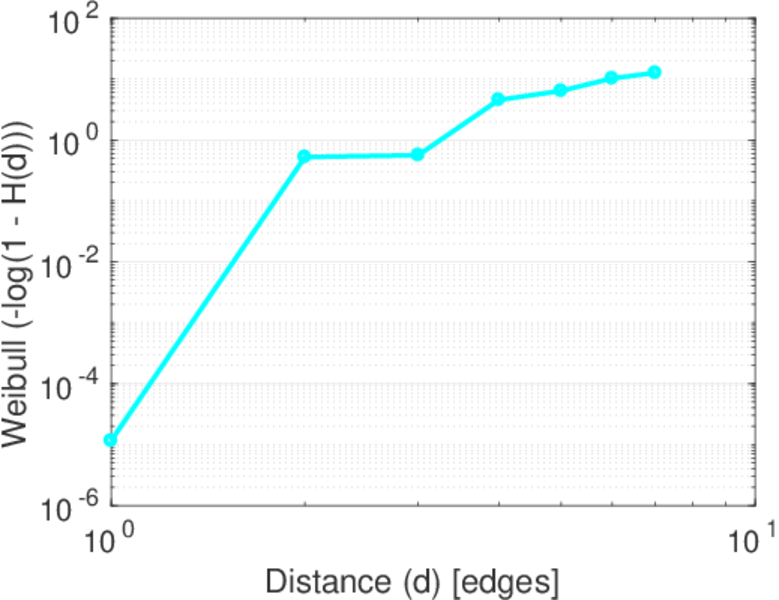
| 50-Percentile effective diameter | δ0.5 = | 3.126 42
|
| 90-Percentile effective diameter | δ0.9 = | 3.840 87
|
| Median distance | δM = | 4
|
| Mean distance | δm = | 3.176 78
|
| Gini coefficient | G = | 0.836 986
|
| Balanced inequality ratio | P = | 0.162 715
|
| Left balanced inequality ratio | P1 = | 0.020 062 2
|
| Right balanced inequality ratio | P2 = | 0.235 635
|
| Relative edge distribution entropy | Her = | 0.680 340
|
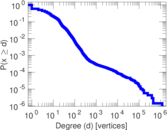
| Tail power law exponent | γt = | 3.321 00
|
| Degree assortativity | ρ = | −0.361 731
|
| Degree assortativity p-value | pρ = | 0.000 00
|
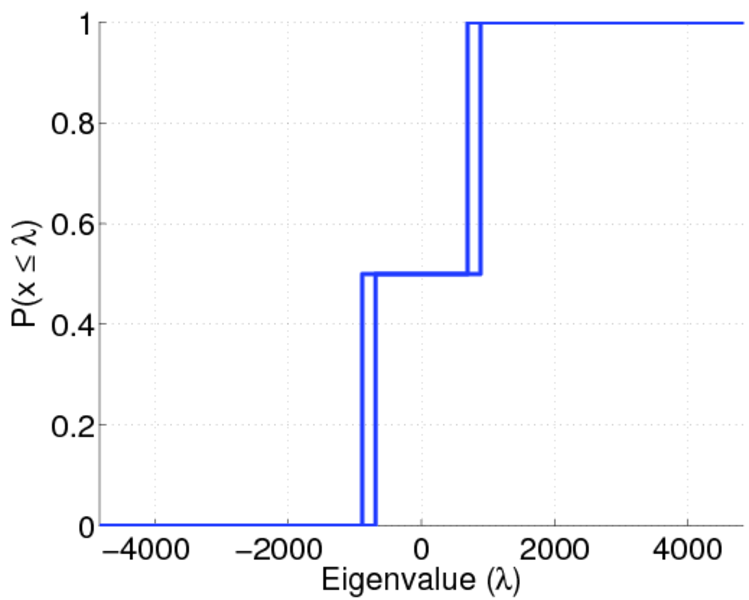
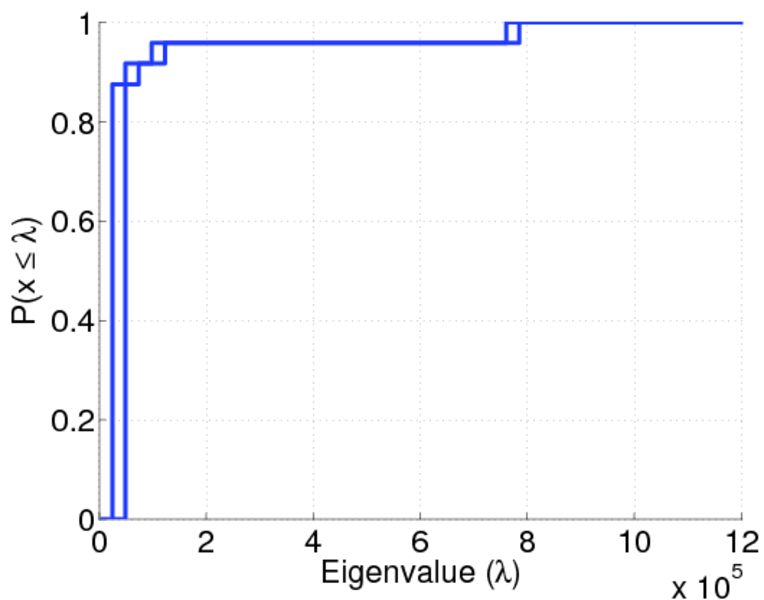
| Spectral norm | α = | 4,834.01
|
| Algebraic connectivity | a = | 0.042 963 9
|
| Spectral separation | |λ1[A] / λ2[A]| = | 1.456 63
|
| Controllability | C = | 681,454
|
| Relative controllability | Cr = | 0.968 770
|
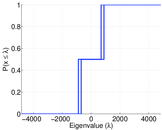
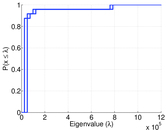
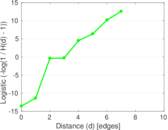
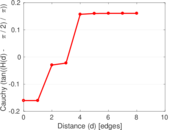
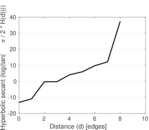
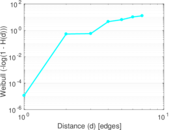
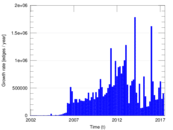
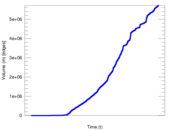
Plots


Downloads
References
|
[1]
|
Jérôme Kunegis.
KONECT – The Koblenz Network Collection.
In Proc. Int. Conf. on World Wide Web Companion, pages
1343–1350, 2013.
[ http ]
|
|
[2]
|
Wikimedia Foundation.
Wikimedia downloads.
http://dumps.wikimedia.org/, January 2010.
|
 KONECT ‣ Networks ‣
Buy Me a Coffee
KONECT ‣ Networks ‣
Buy Me a Coffee