Wikipedia edits (gl)
This is the bipartite edit network of the Galician Wikipedia. It contains users
and pages from the Galician Wikipedia, connected by edit events. Each edge
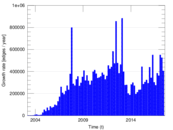
represents an edit. The dataset includes the timestamp of each edit.
Metadata
Statistics
| Size | n = | 354,254
|
| Left size | n1 = | 12,922
|
| Right size | n2 = | 341,332
|
| Volume | m = | 4,106,776
|
| Unique edge count | m̿ = | 1,981,973
|
| Wedge count | s = | 32,841,914,323
|
| Square count | q = | 50,310,598,352
|
| 4-Tour count | T4 = | 533,860,126,846
|
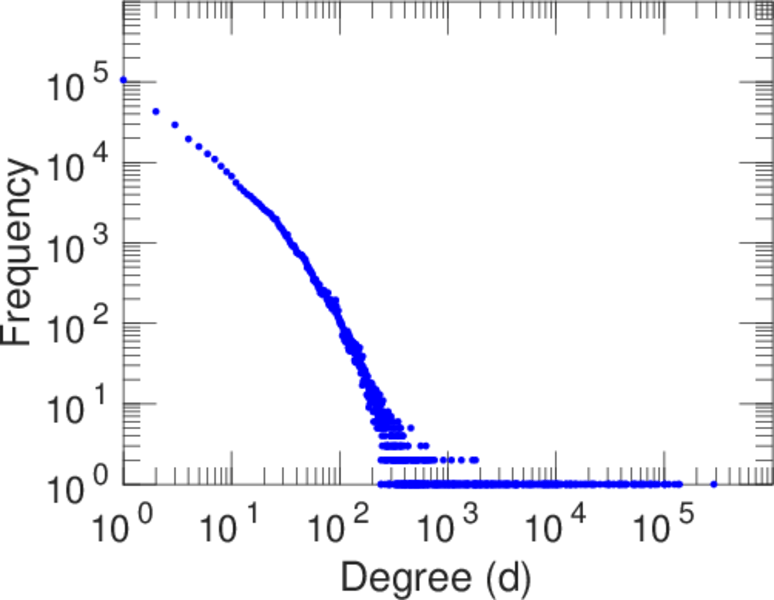
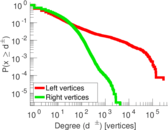
| Maximum degree | dmax = | 287,230
|
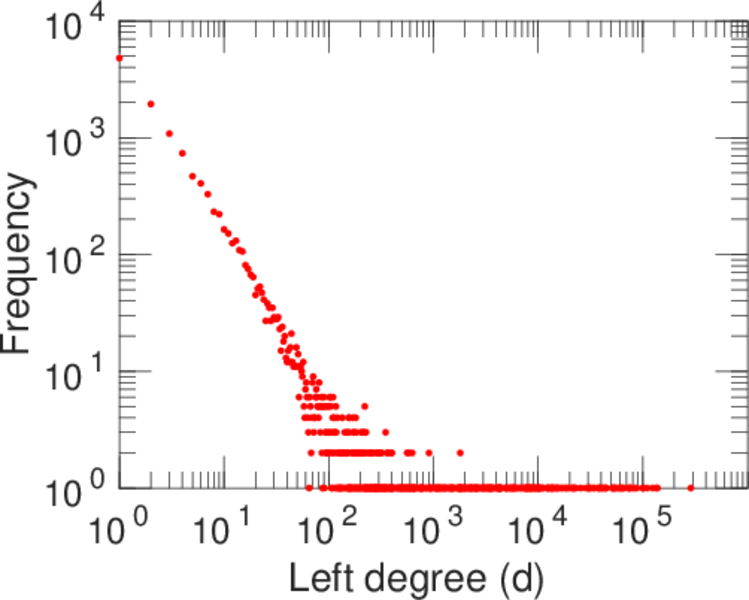
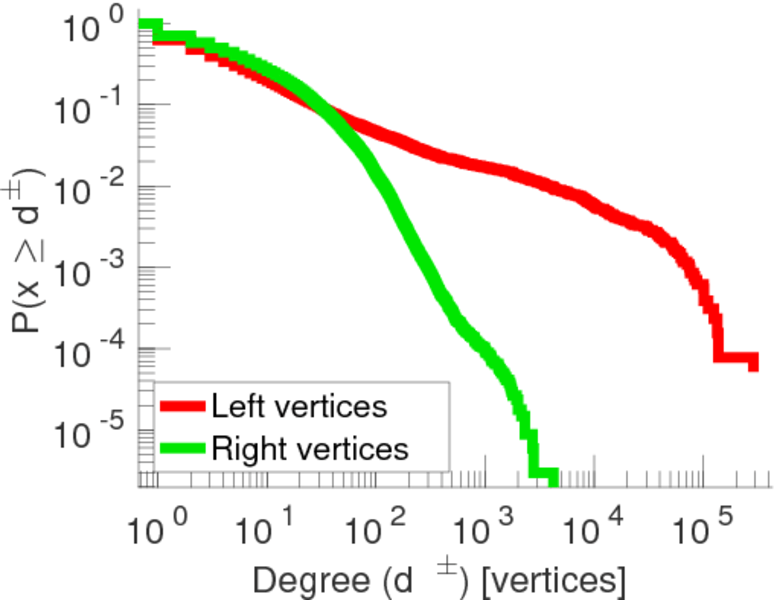
| Maximum left degree | d1max = | 287,230
|
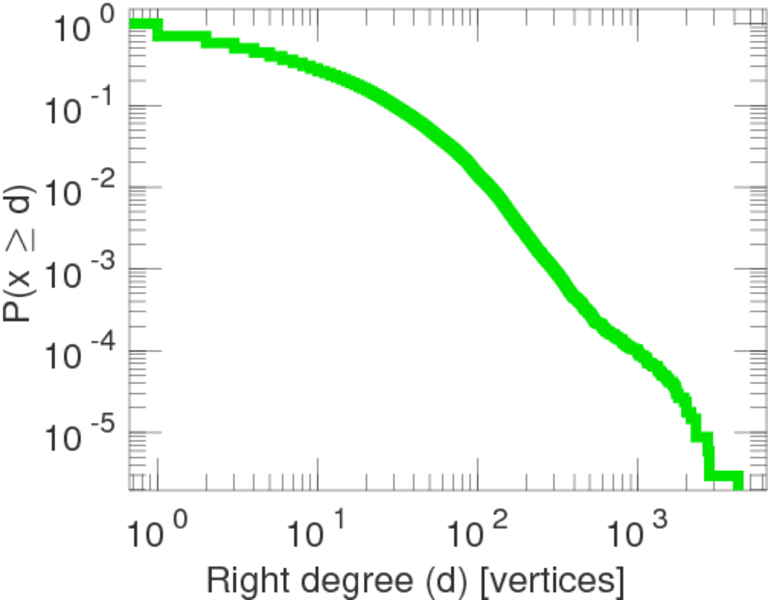
| Maximum right degree | d2max = | 4,229
|
| Average degree | d = | 23.185 5
|
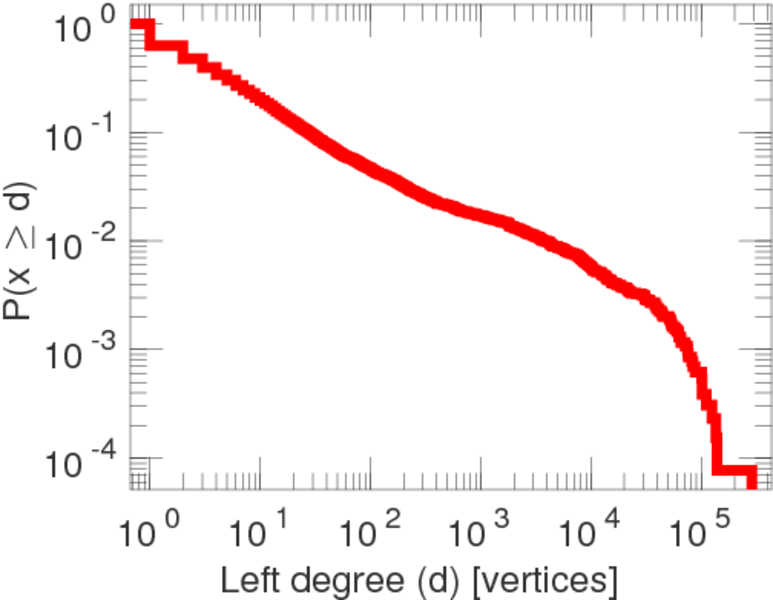
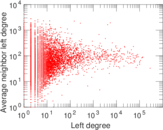
| Average left degree | d1 = | 317.813
|
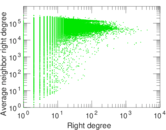
| Average right degree | d2 = | 12.031 6
|
| Fill | p = | 0.000 449 356
|
| Average edge multiplicity | m̃ = | 2.072 06
|
| Size of LCC | N = | 351,335
|
| Diameter | δ = | 11
|
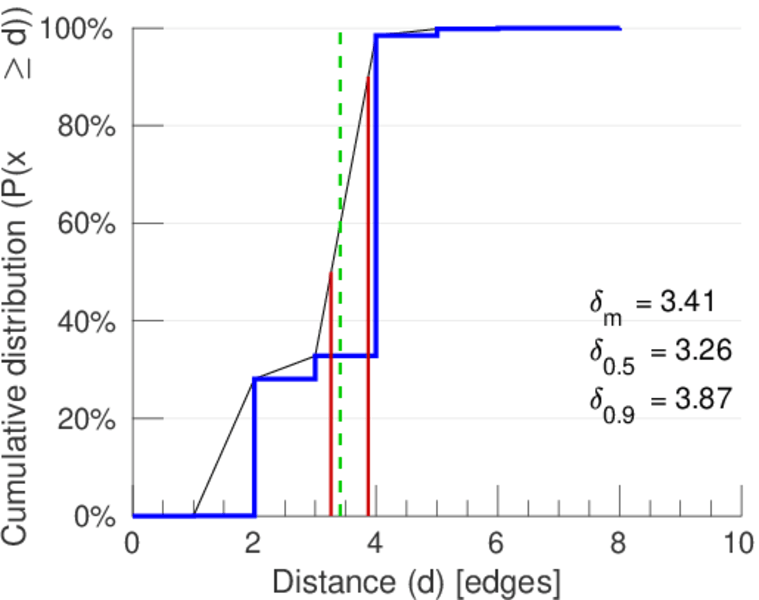
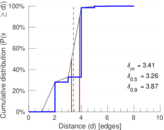
| 50-Percentile effective diameter | δ0.5 = | 3.262 16
|
| 90-Percentile effective diameter | δ0.9 = | 3.871 35
|
| Median distance | δM = | 4
|
| Mean distance | δm = | 3.408 87
|
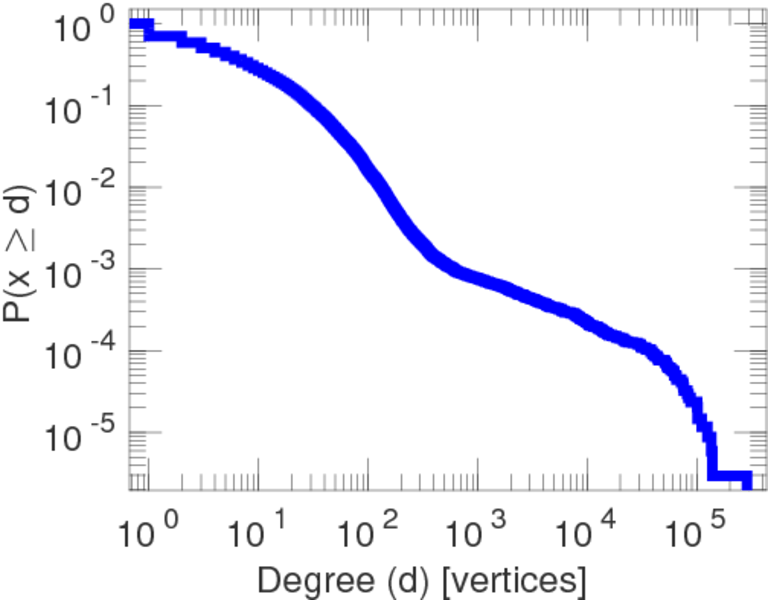
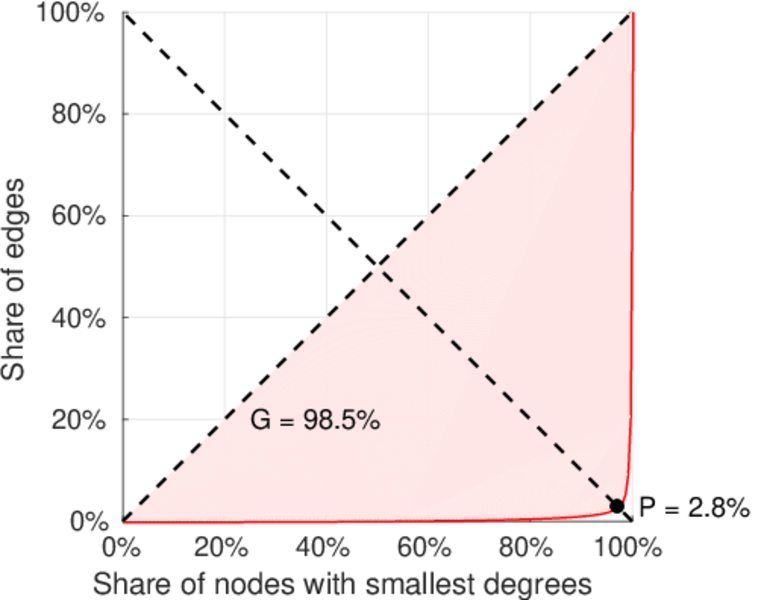
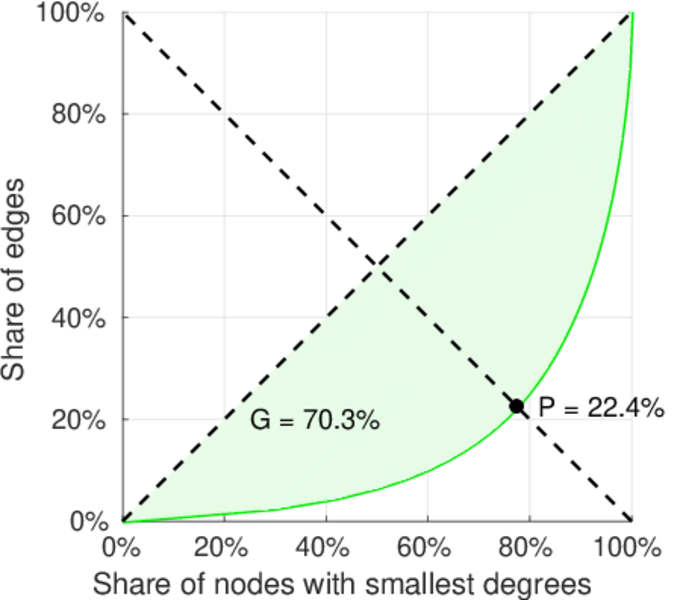
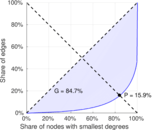
| Gini coefficient | G = | 0.848 692
|
| Balanced inequality ratio | P = | 0.157 999
|
| Left balanced inequality ratio | P1 = | 0.027 991 8
|
| Right balanced inequality ratio | P2 = | 0.224 388
|
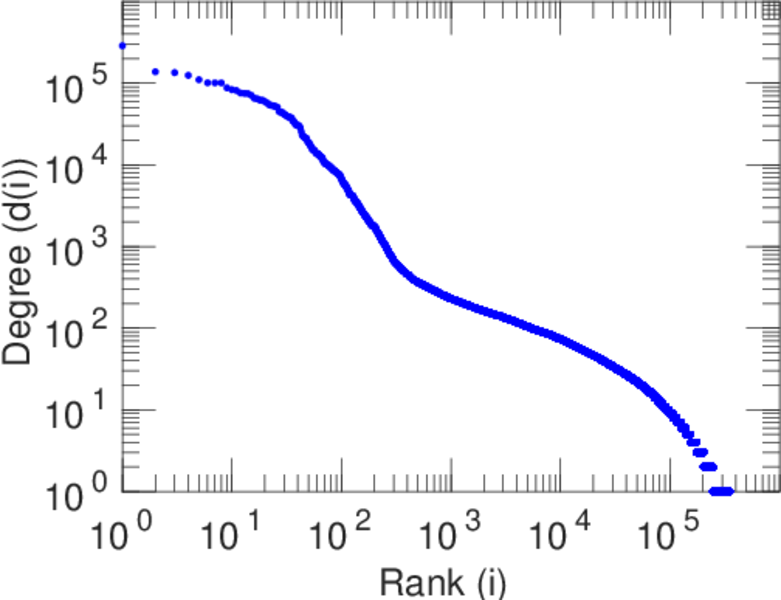
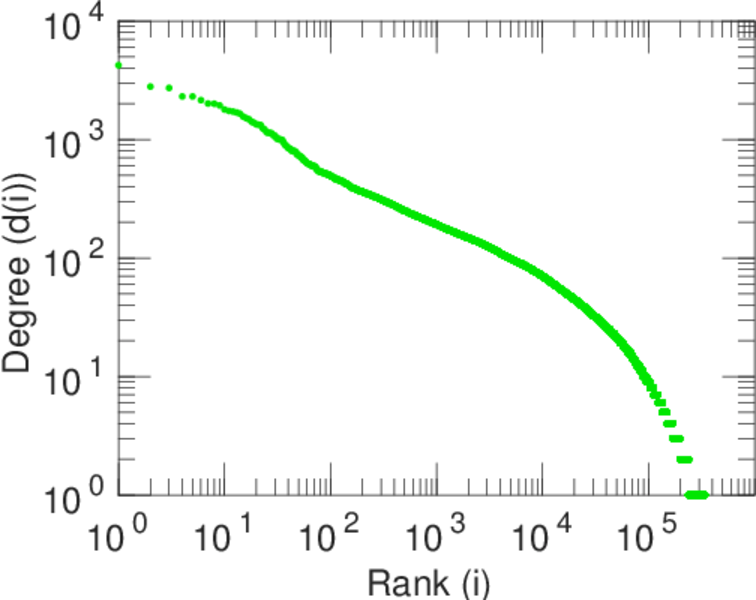
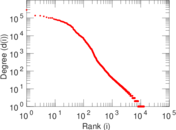
| Power law exponent | γ = | 1.934 93
|
| Tail power law exponent | γt = | 3.001 00
|
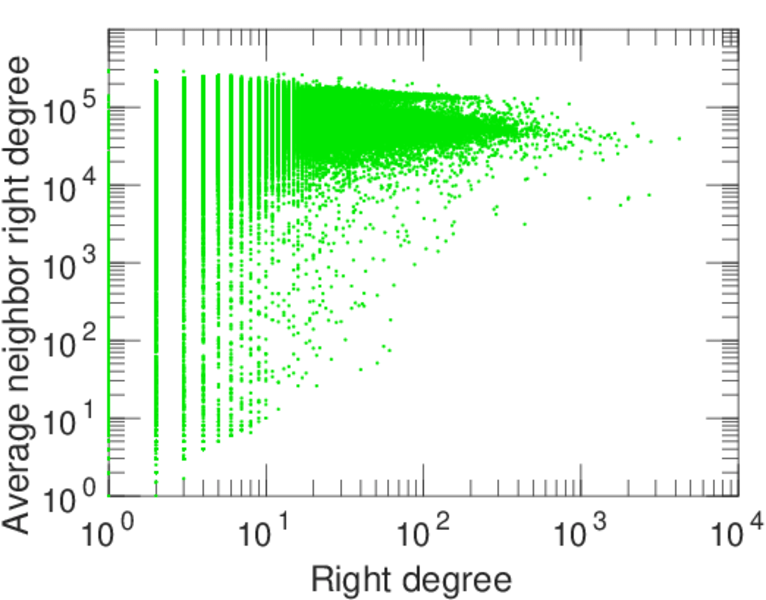
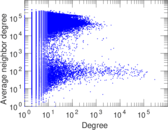
| Degree assortativity | ρ = | −0.214 623
|
| Degree assortativity p-value | pρ = | 0.000 00
|
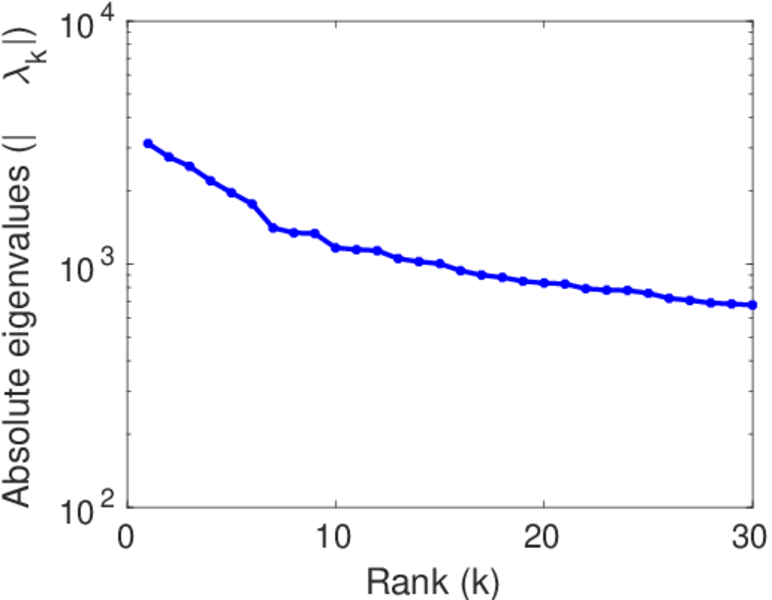
| Spectral norm | α = | 3,134.62
|
| Algebraic connectivity | a = | 0.089 925 4
|
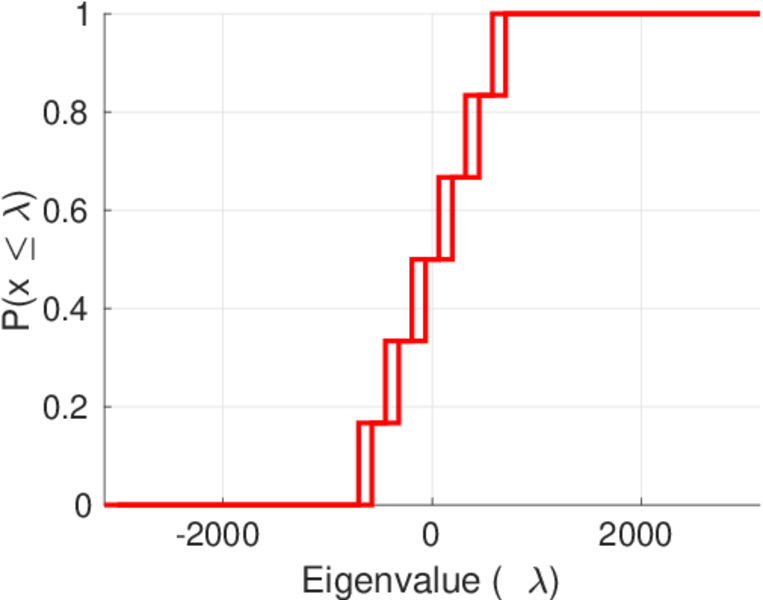
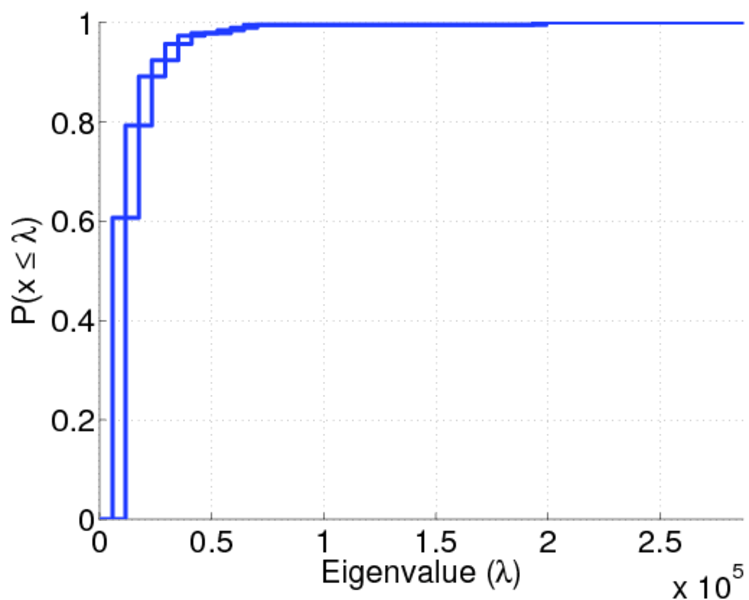
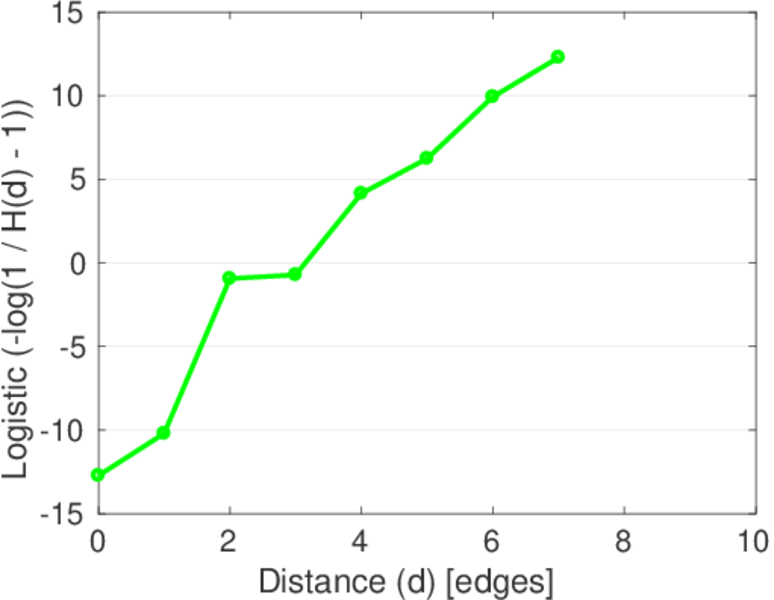
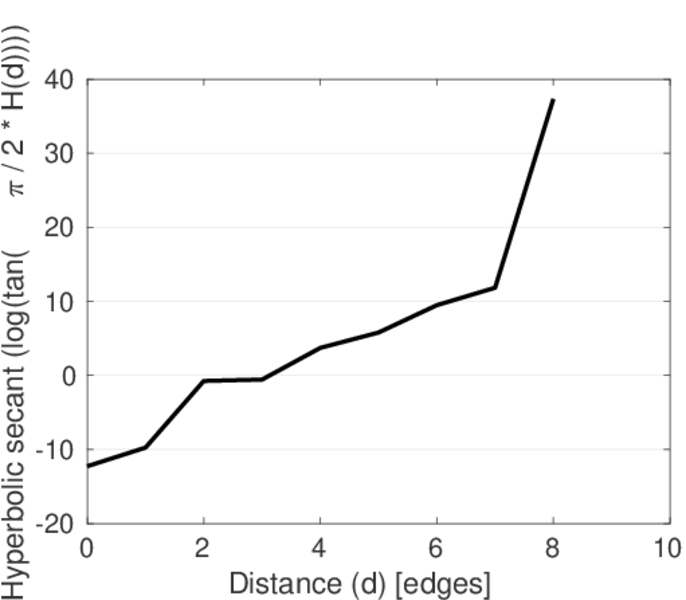
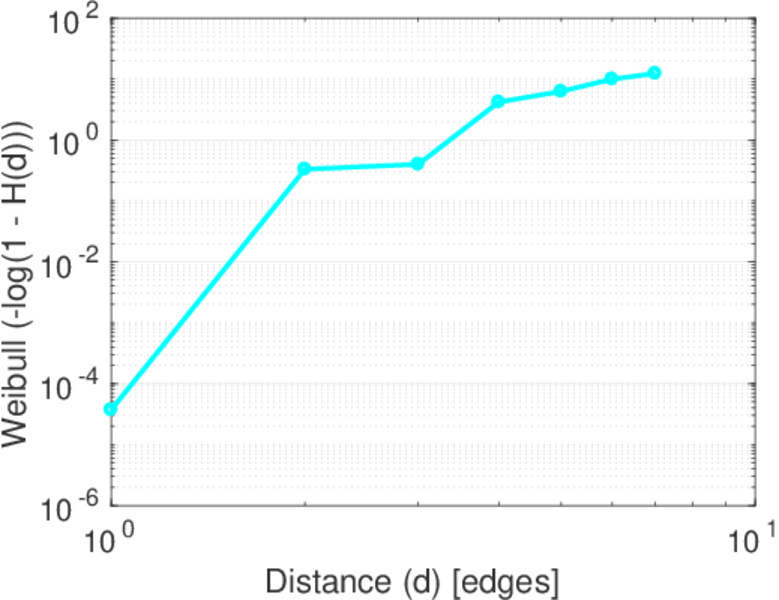
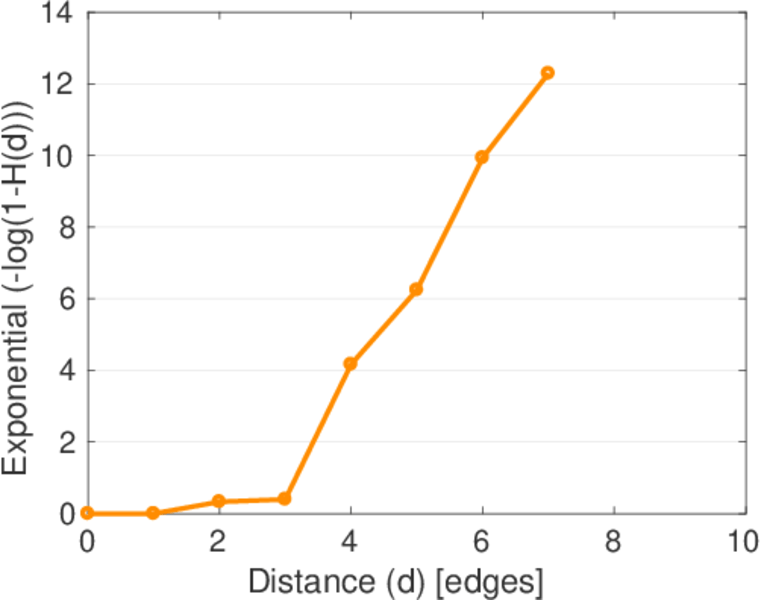
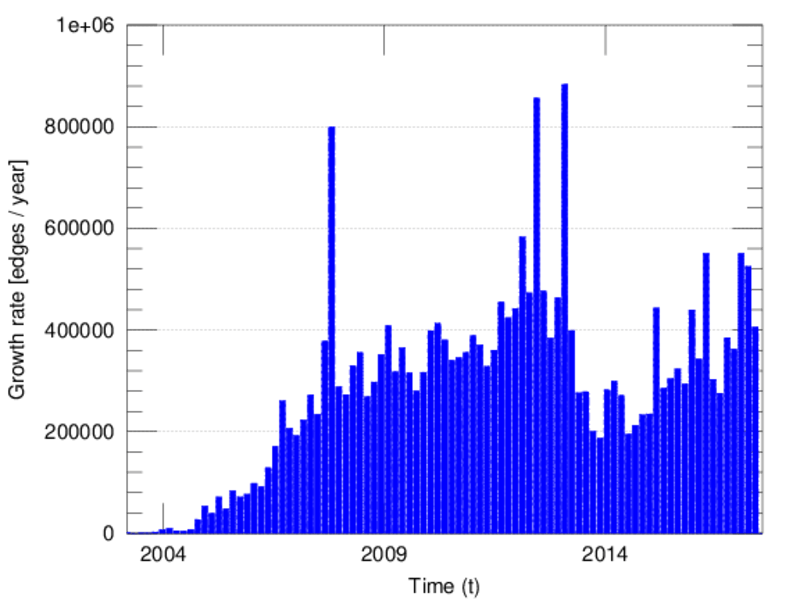
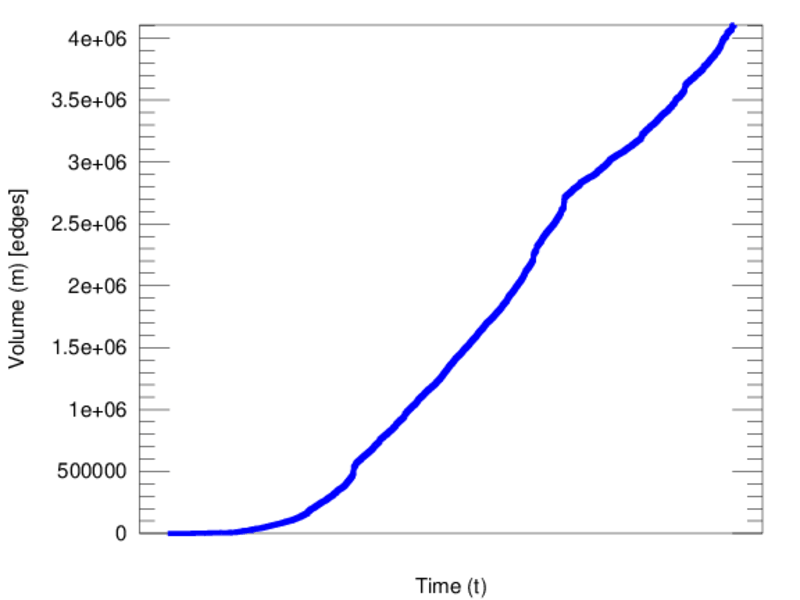
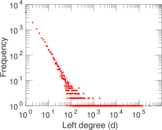
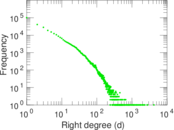
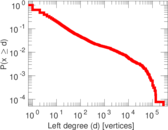
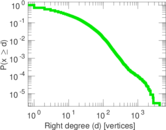
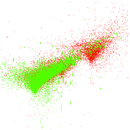
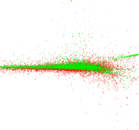
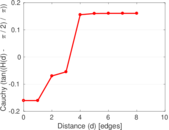
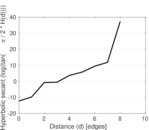
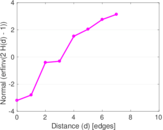
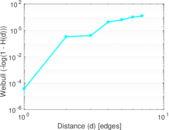
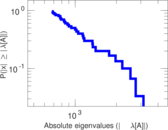
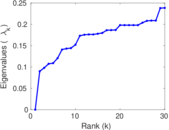
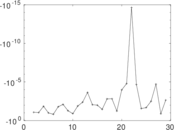
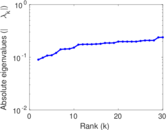
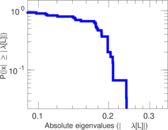
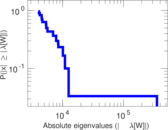
Plots


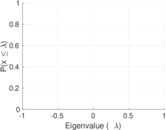
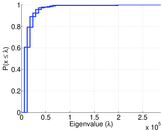


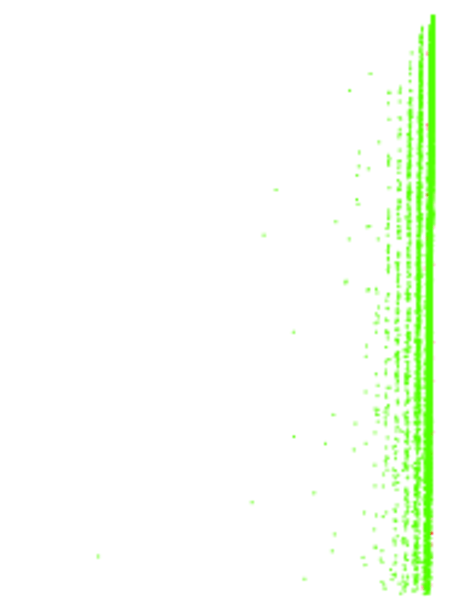
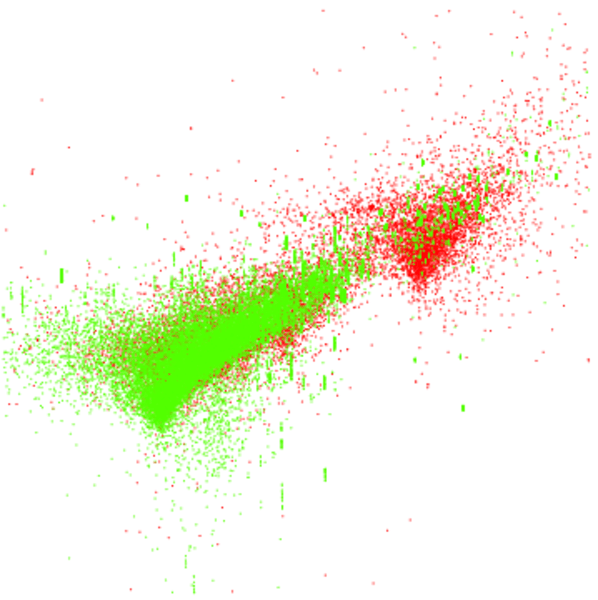
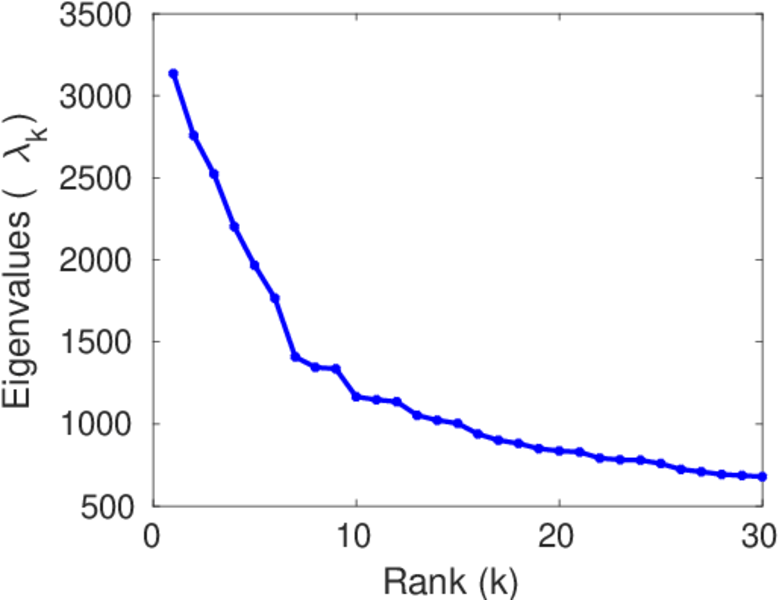
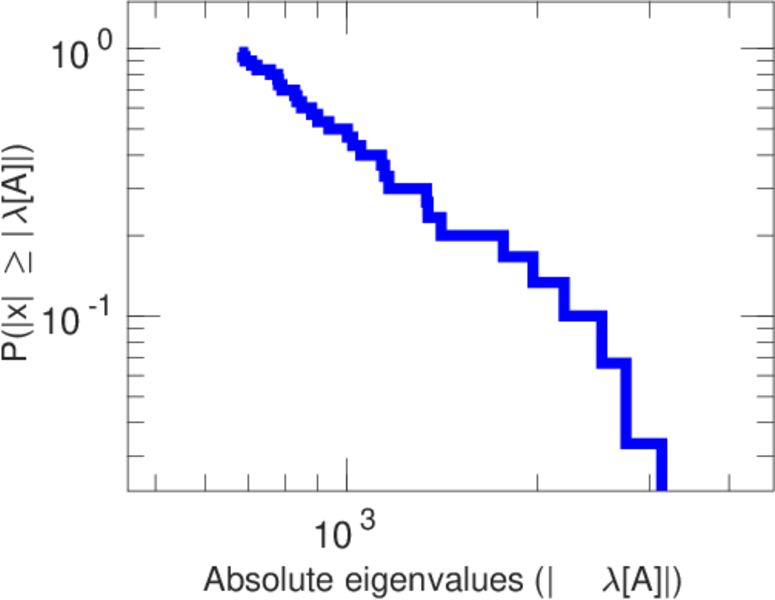
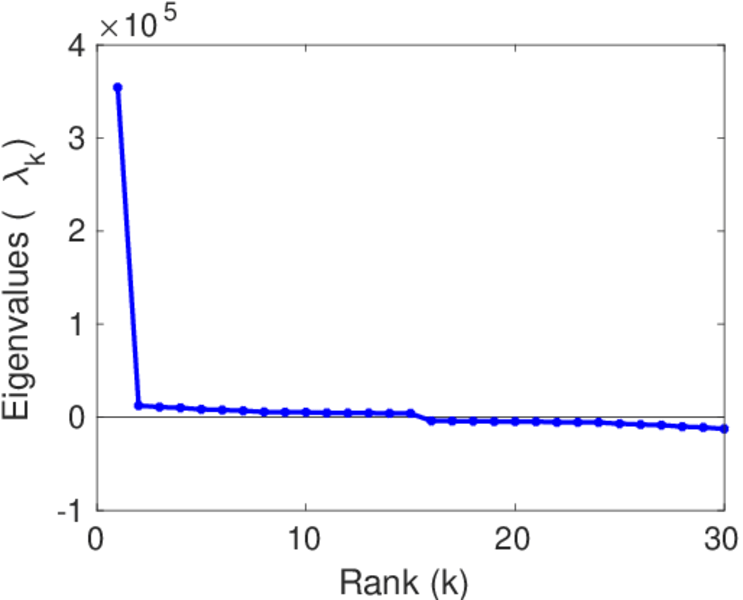
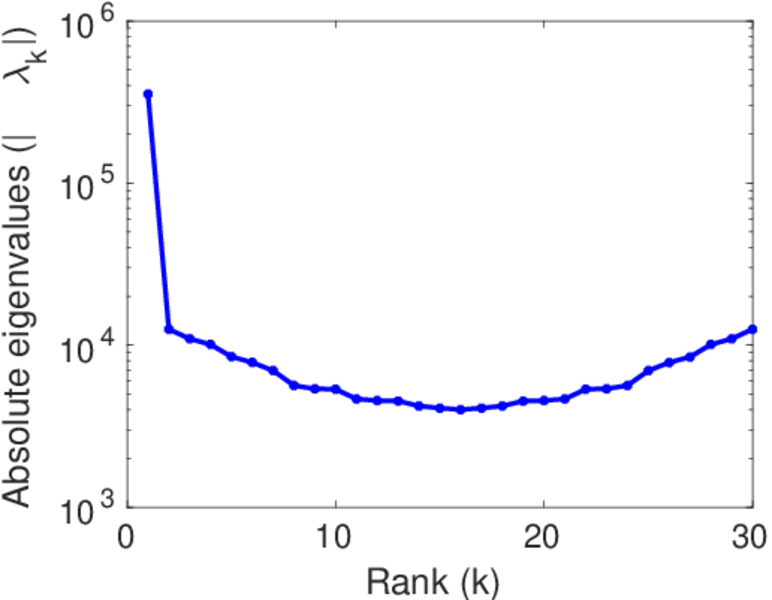
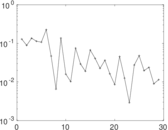
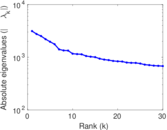
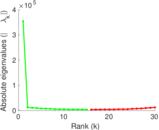
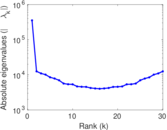
Matrix decompositions plots


Downloads
References
|
[1]
|
Jérôme Kunegis.
KONECT – The Koblenz Network Collection.
In Proc. Int. Conf. on World Wide Web Companion, pages
1343–1350, 2013.
[ http ]
|
|
[2]
|
Wikimedia Foundation.
Wikimedia downloads.
http://dumps.wikimedia.org/, January 2010.
|
 KONECT ‣ Networks ‣
Buy Me a Coffee
KONECT ‣ Networks ‣
Buy Me a Coffee