Wikipedia edits (hr)
This is the bipartite edit network of the Croatian Wikipedia. It contains users
and pages from the Croatian Wikipedia, connected by edit events. Each edge
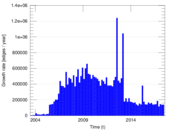
represents an edit. The dataset includes the timestamp of each edit.
Metadata
Statistics
| Size | n = | 496,141
|
| Left size | n1 = | 28,779
|
| Right size | n2 = | 467,362
|
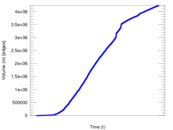
| Volume | m = | 4,236,890
|
| Unique edge count | m̿ = | 2,227,199
|
| Wedge count | s = | 37,363,697,860
|
| Cross count | x = | 3.916 81 × 1019
|
| Square count | q = | 46,164,065,977
|
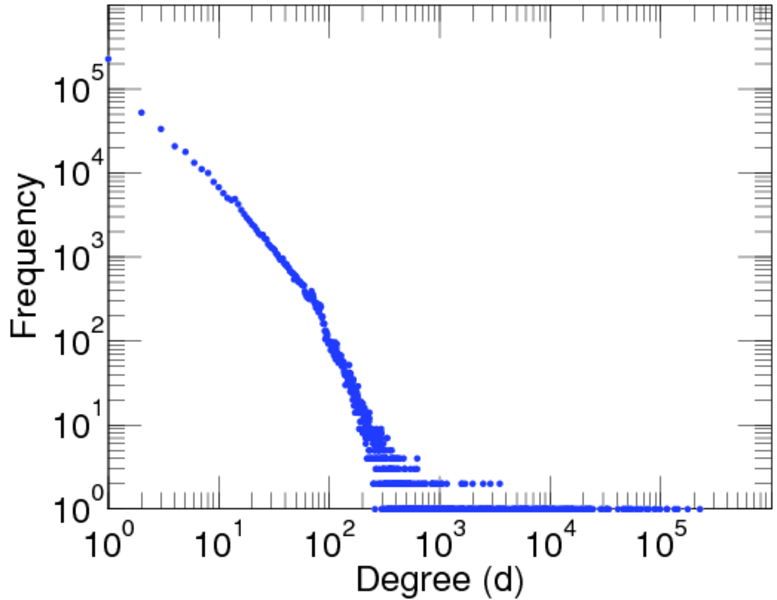
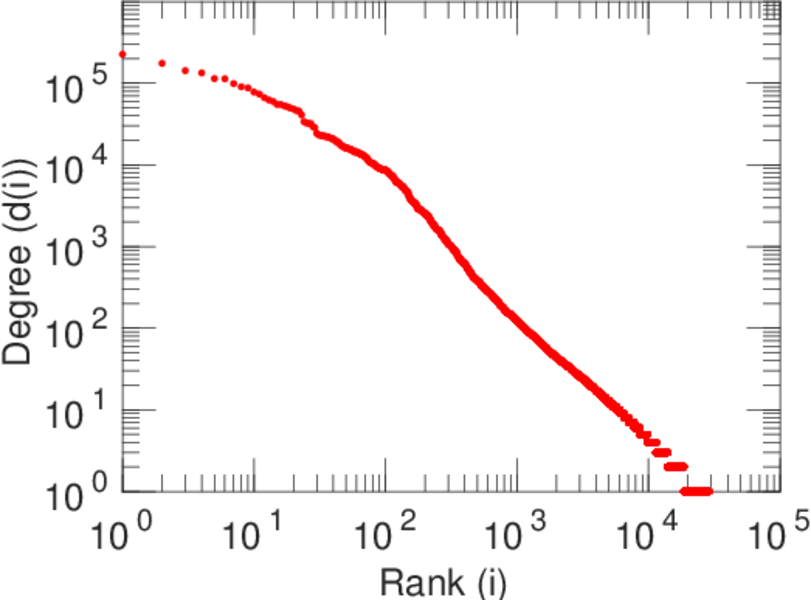
| Maximum degree | dmax = | 226,152
|
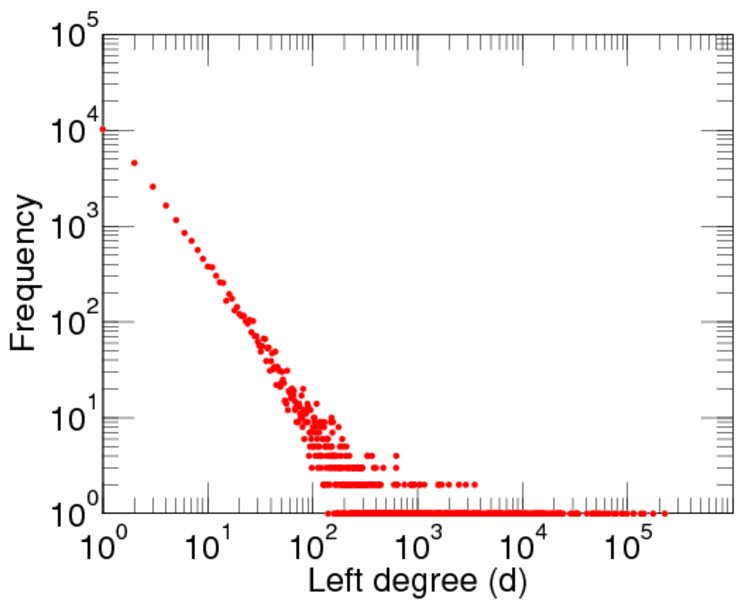
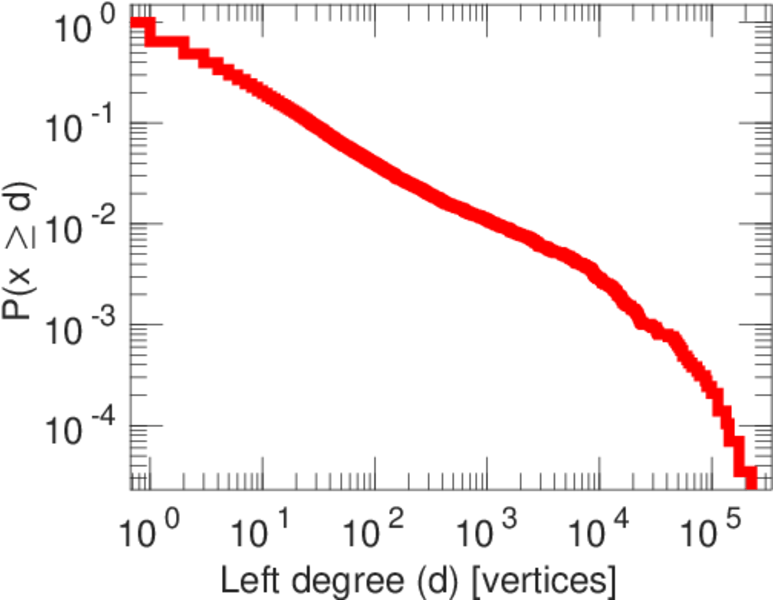
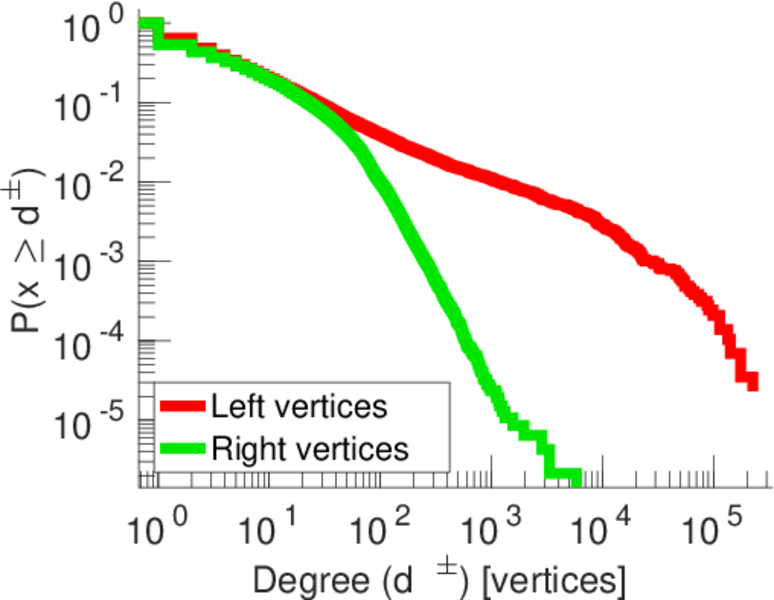
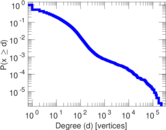
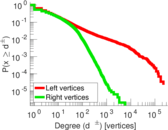
| Maximum left degree | d1max = | 226,152
|
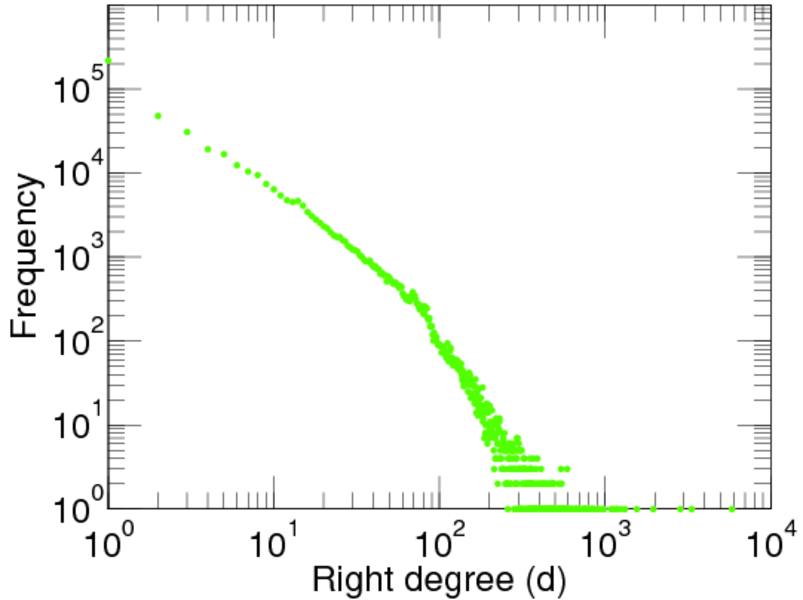
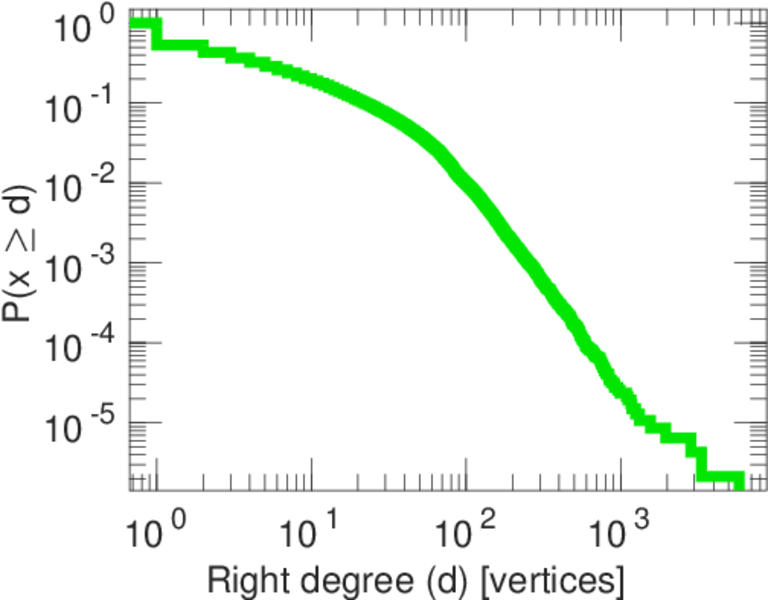
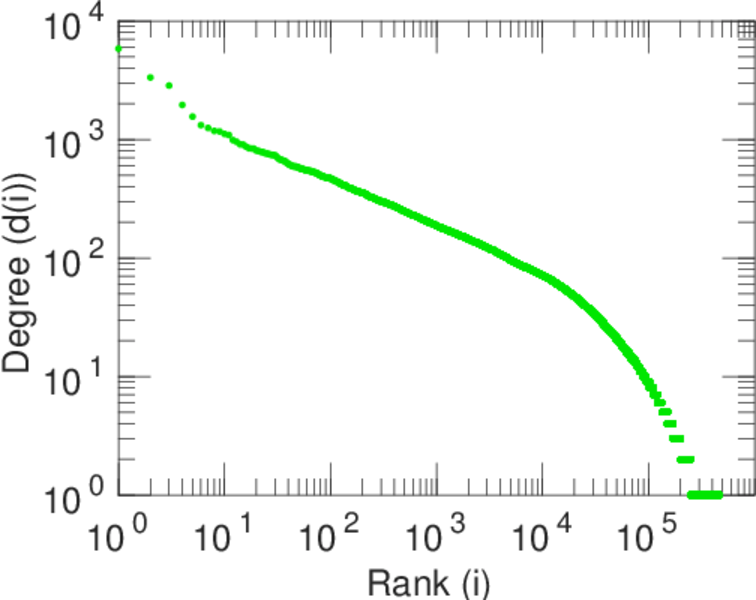
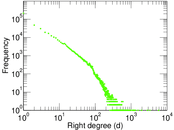
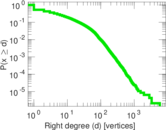
| Maximum right degree | d2max = | 5,845
|
| Average degree | d = | 17.079 4
|
| Average left degree | d1 = | 147.222
|
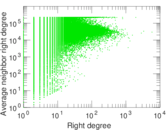
| Average right degree | d2 = | 9.065 54
|
| Fill | p = | 0.000 165 588
|
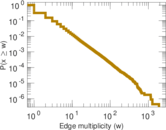
| Average edge multiplicity | m̃ = | 1.902 34
|
| Size of LCC | N = | 492,972
|
| Diameter | δ = | 10
|
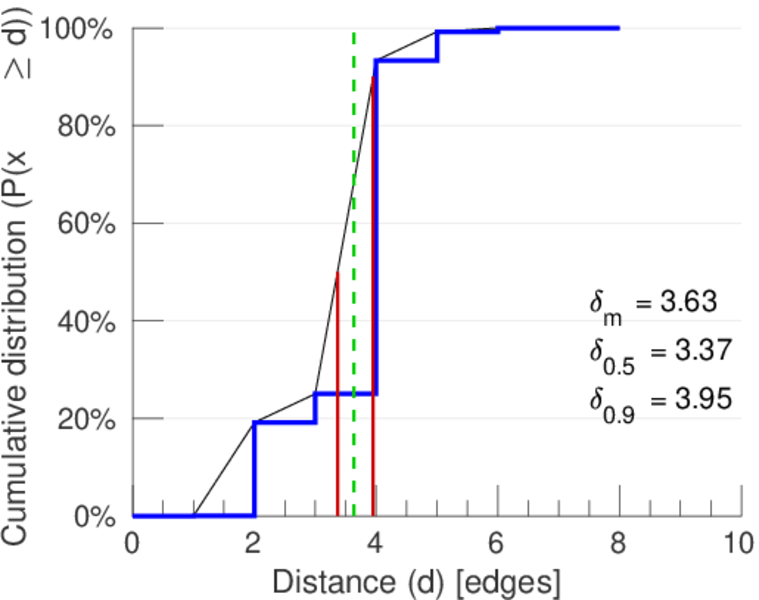
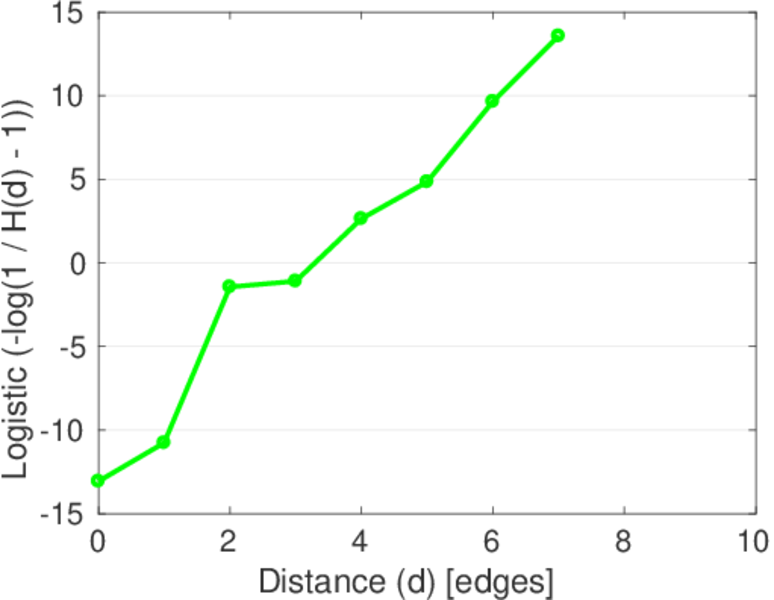
| 50-Percentile effective diameter | δ0.5 = | 3.365 68
|
| 90-Percentile effective diameter | δ0.9 = | 3.951 24
|
| Median distance | δM = | 4
|
| Mean distance | δm = | 3.632 82
|
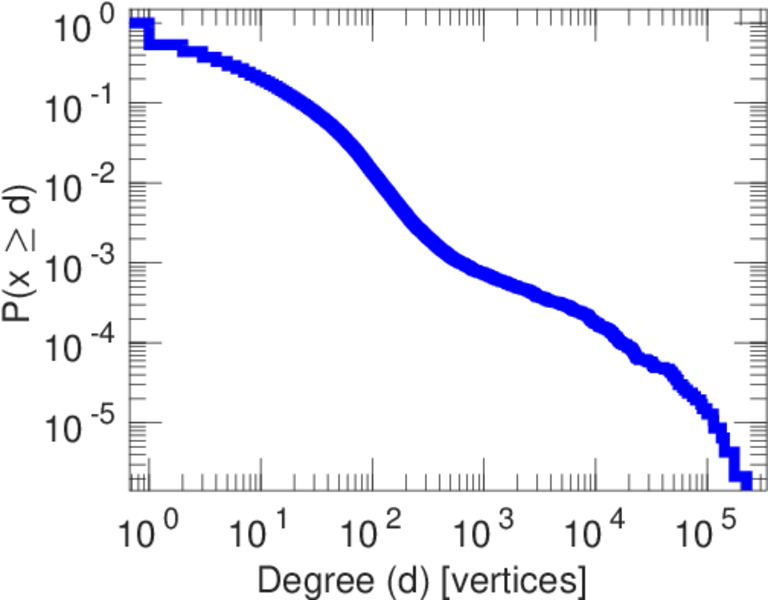
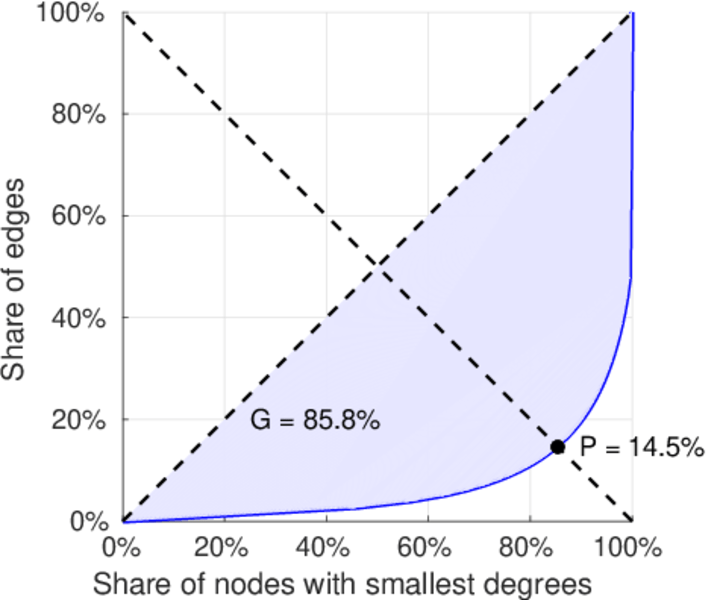
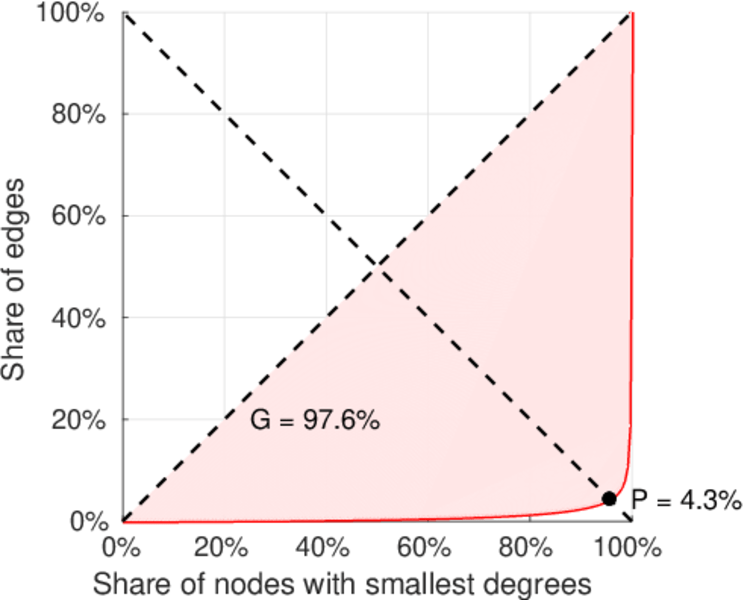
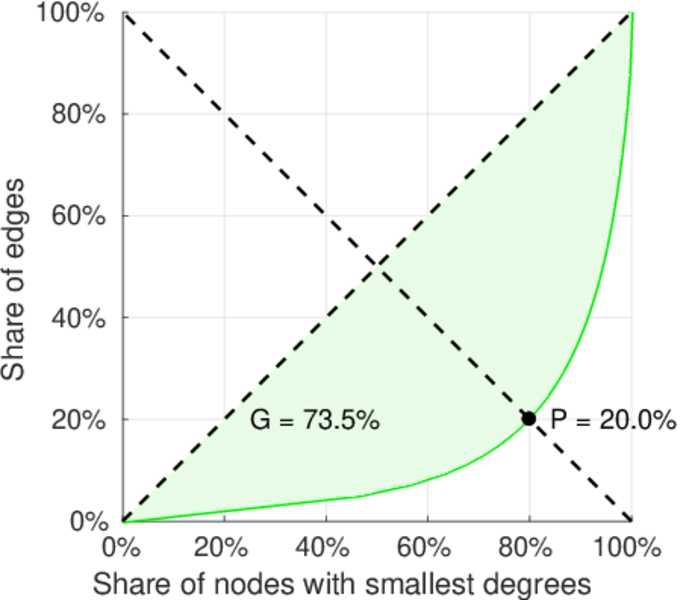
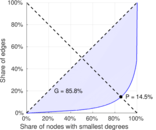
| Gini coefficient | G = | 0.863 478
|
| Balanced inequality ratio | P = | 0.143 613
|
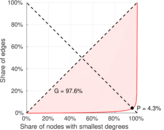
| Left balanced inequality ratio | P1 = | 0.042 731 6
|
| Right balanced inequality ratio | P2 = | 0.199 994
|
| Relative edge distribution entropy | Her = | 0.724 019
|
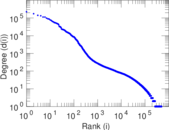
| Power law exponent | γ = | 2.261 30
|
| Tail power law exponent | γt = | 1.801 00
|
| Degree assortativity | ρ = | −0.230 929
|
| Degree assortativity p-value | pρ = | 0.000 00
|
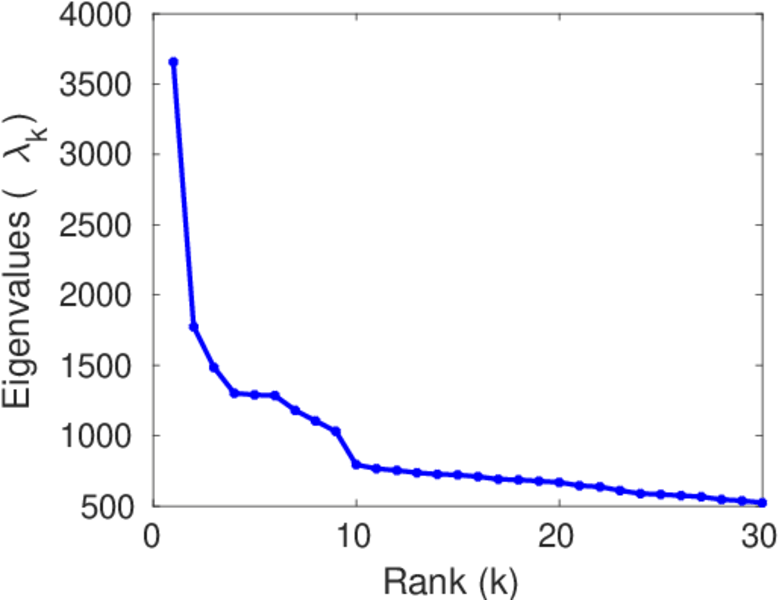
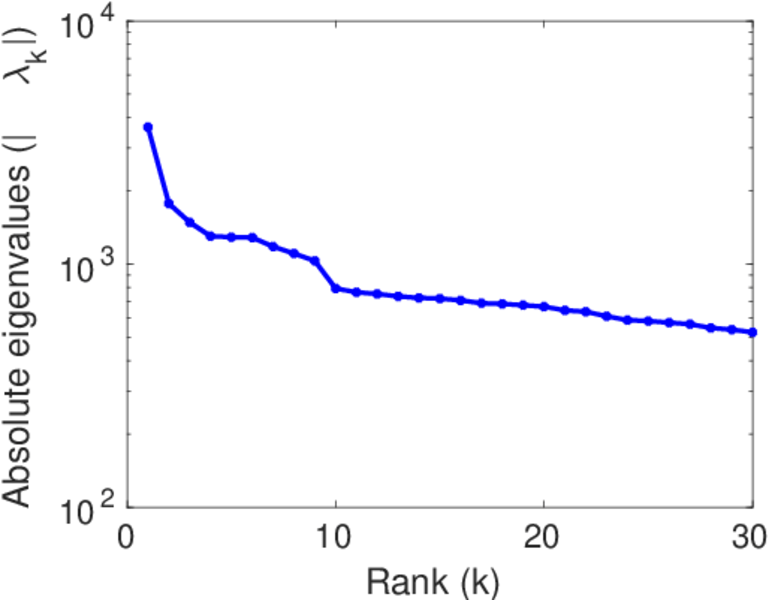
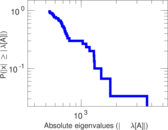
| Spectral norm | α = | 3,656.71
|
| Algebraic connectivity | a = | 0.102 083
|
| Spectral separation | |λ1[A] / λ2[A]| = | 2.061 16
|
| Controllability | C = | 446,346
|
| Relative controllability | Cr = | 0.902 196
|
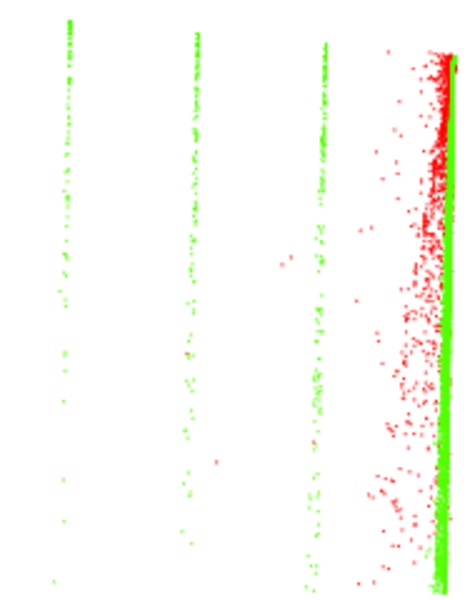
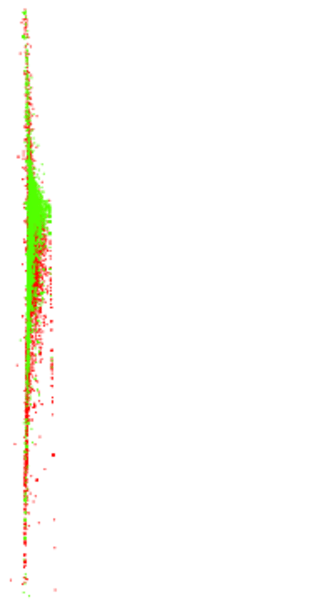
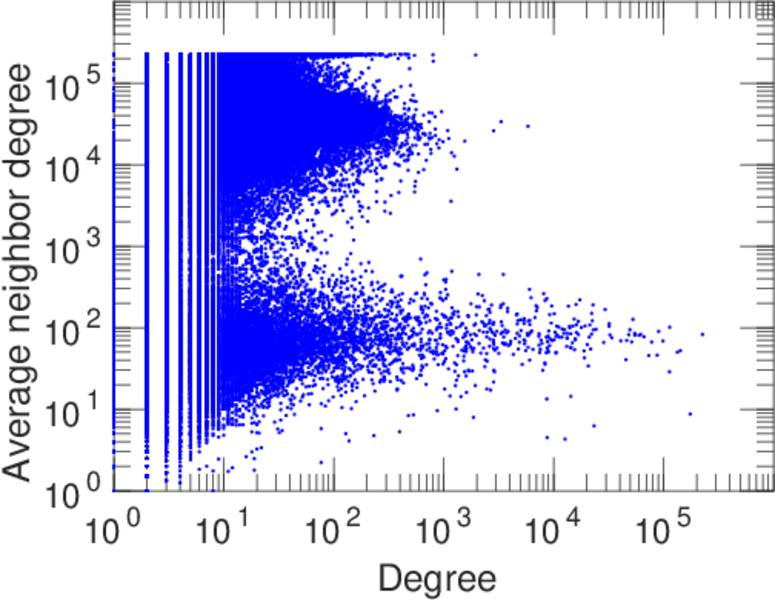
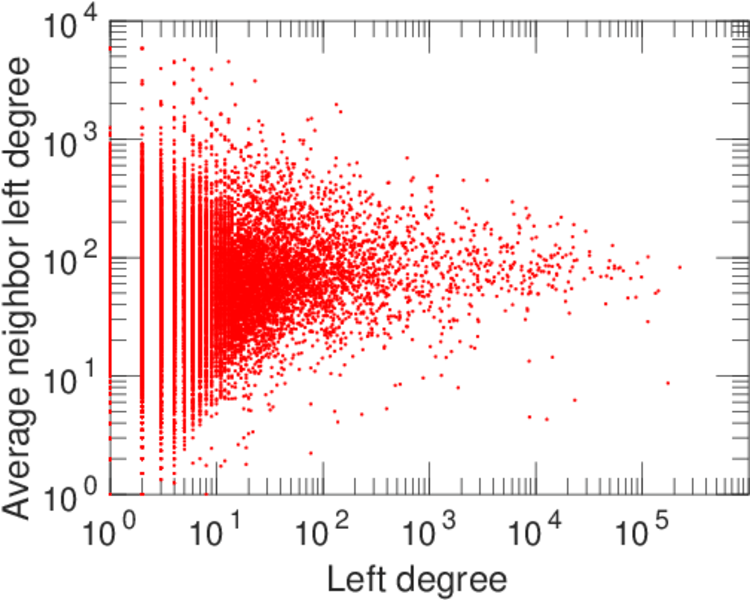
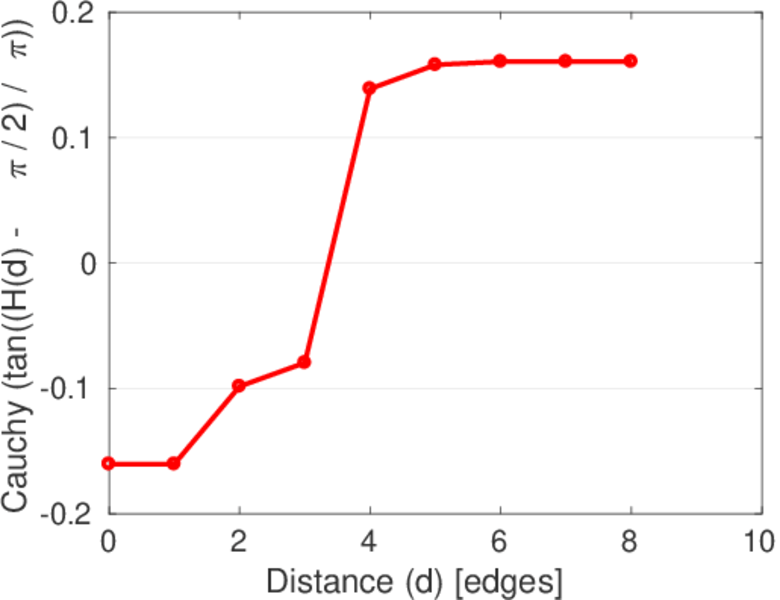
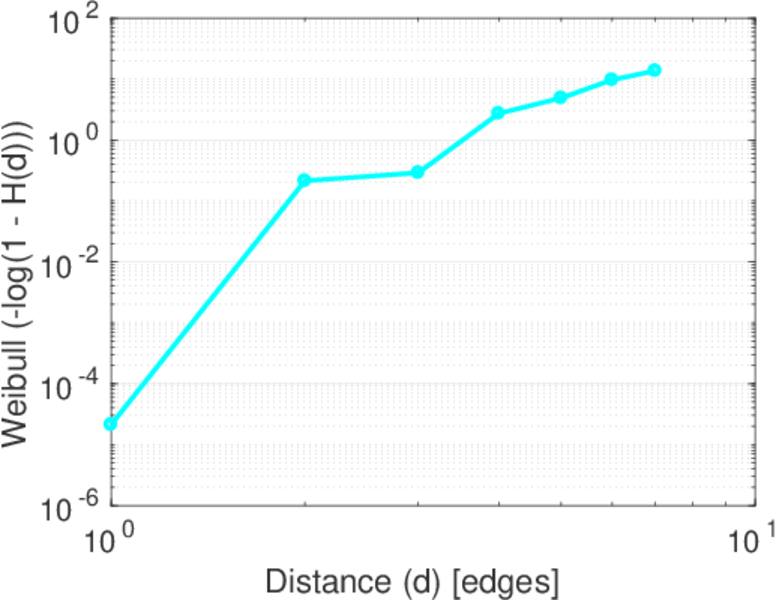
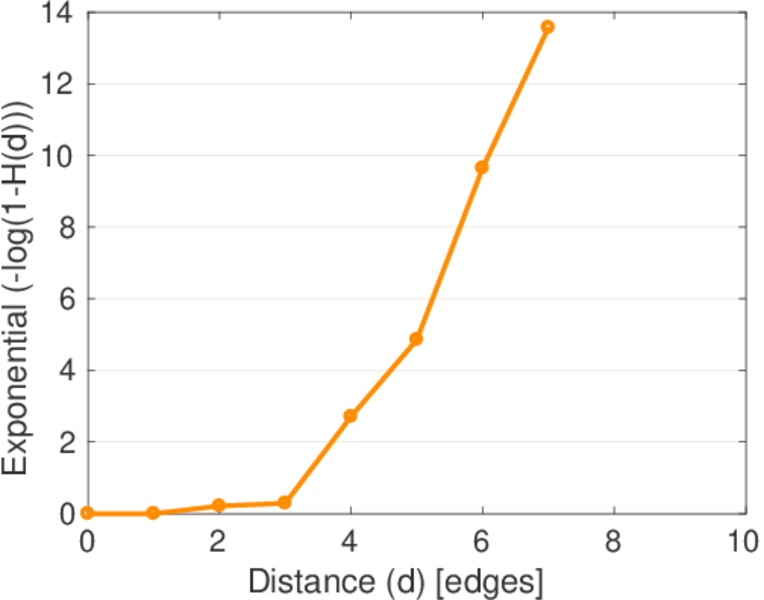
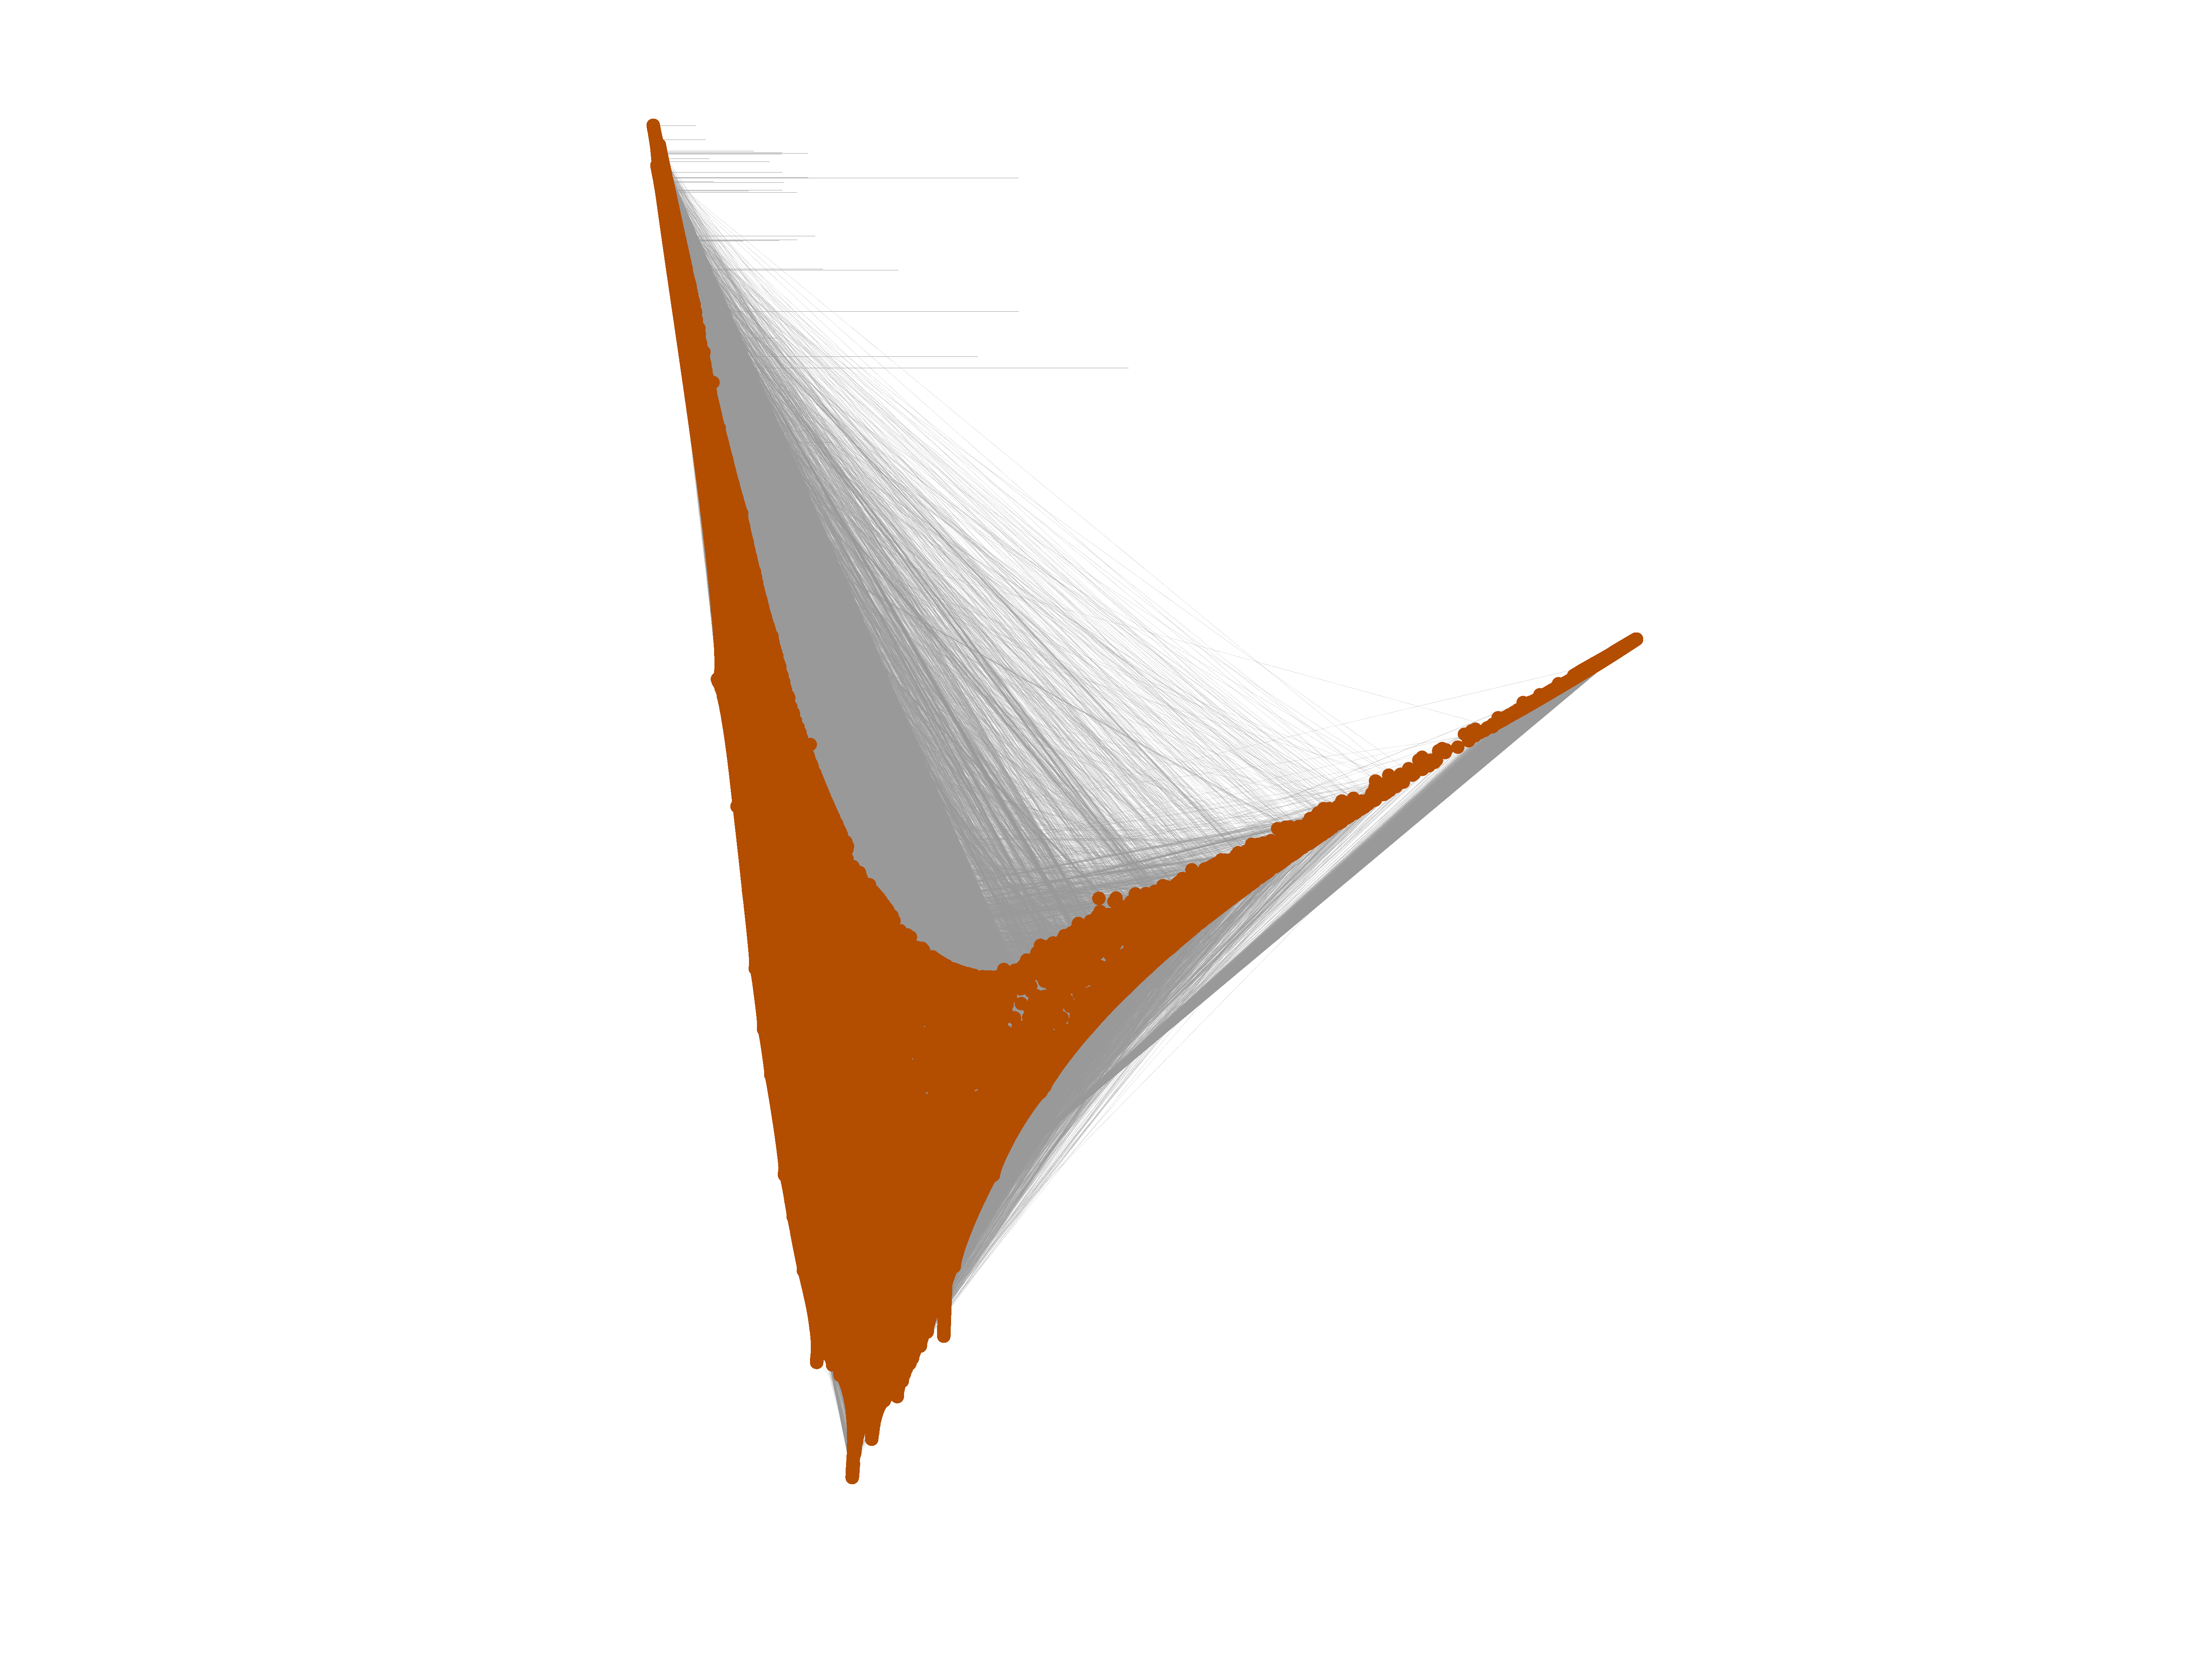
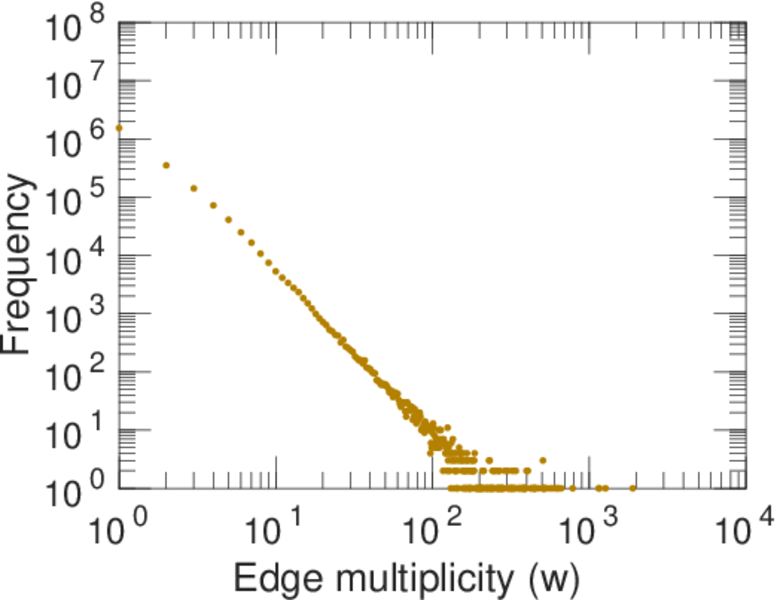
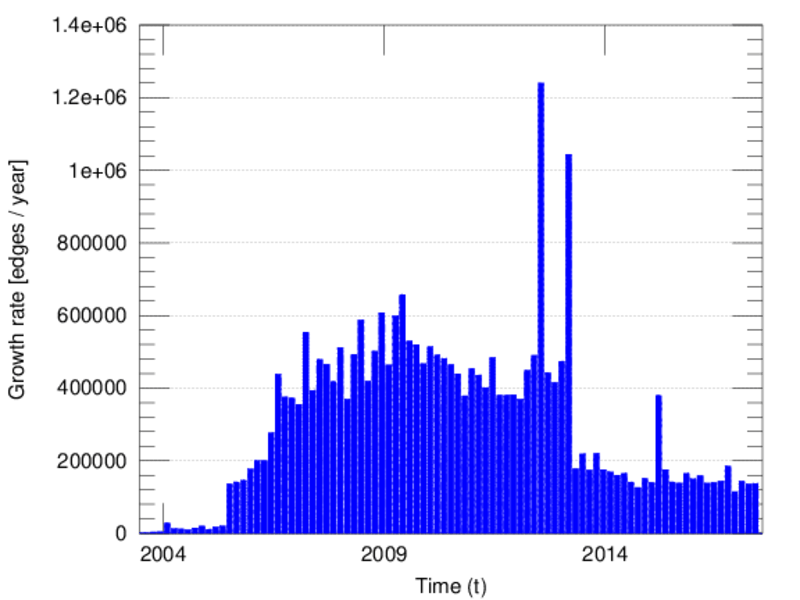
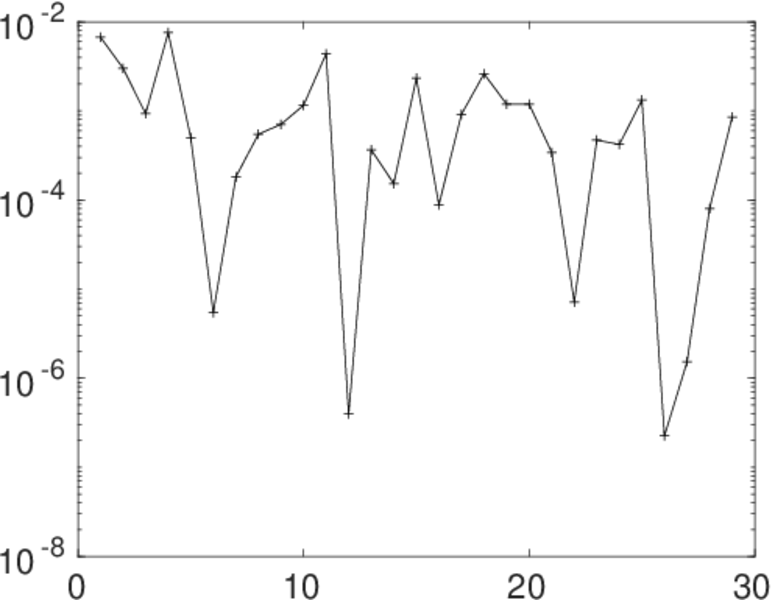
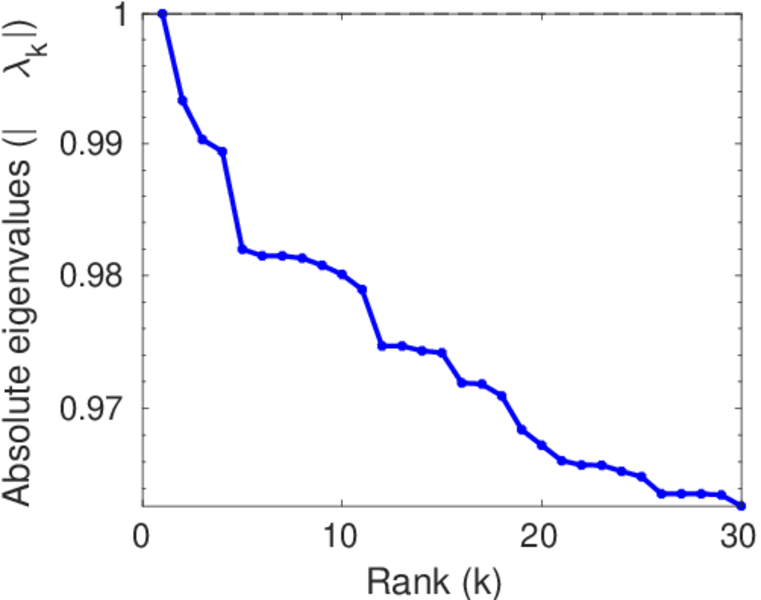
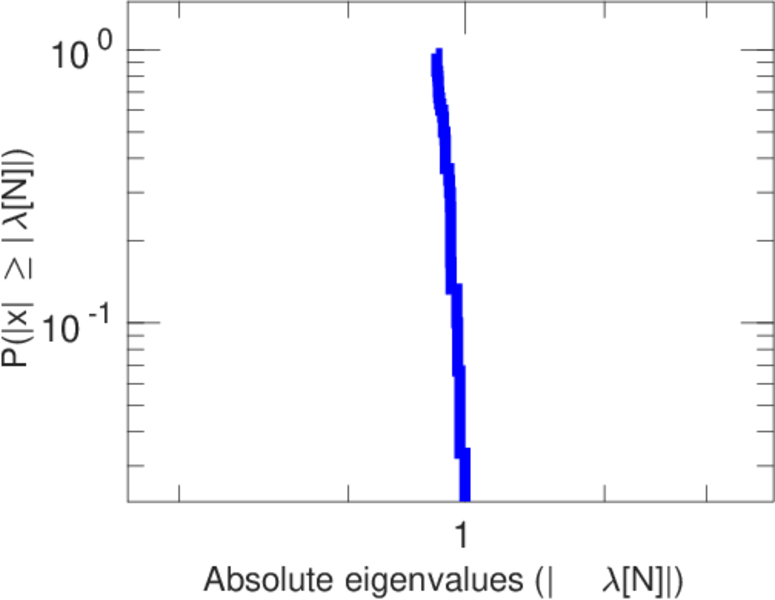
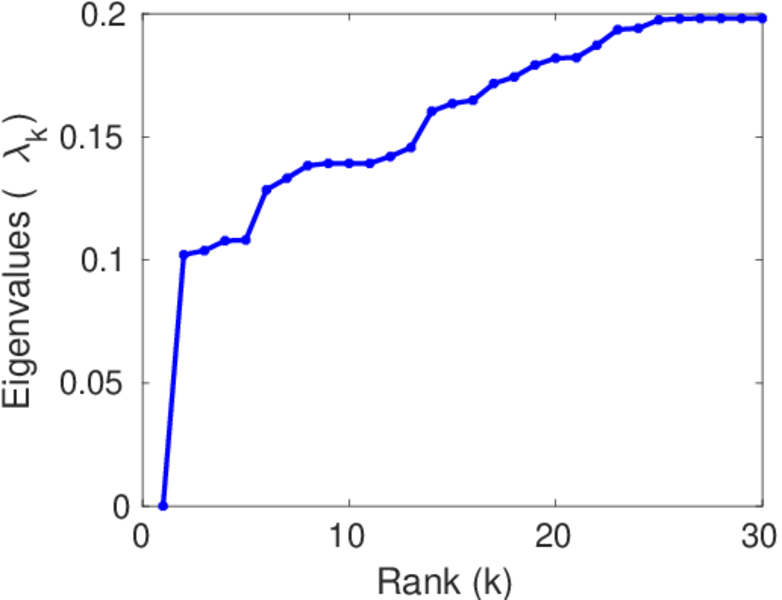
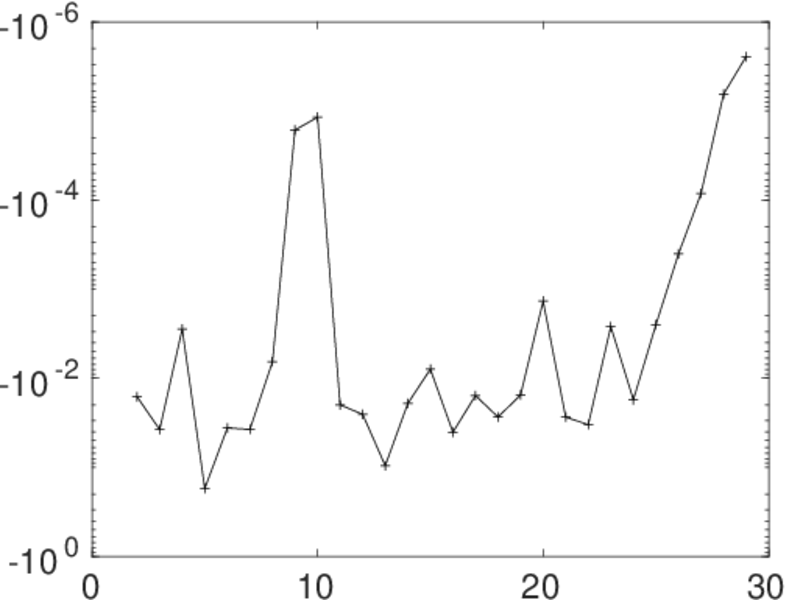
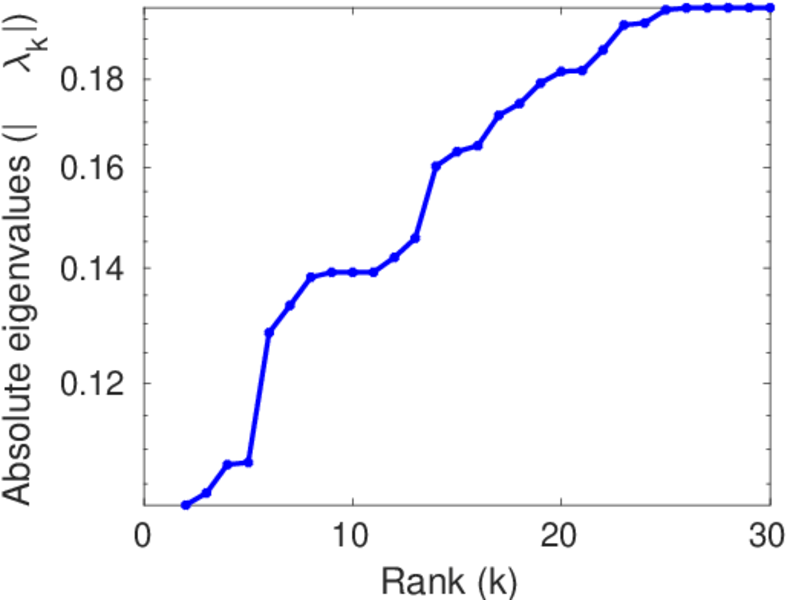
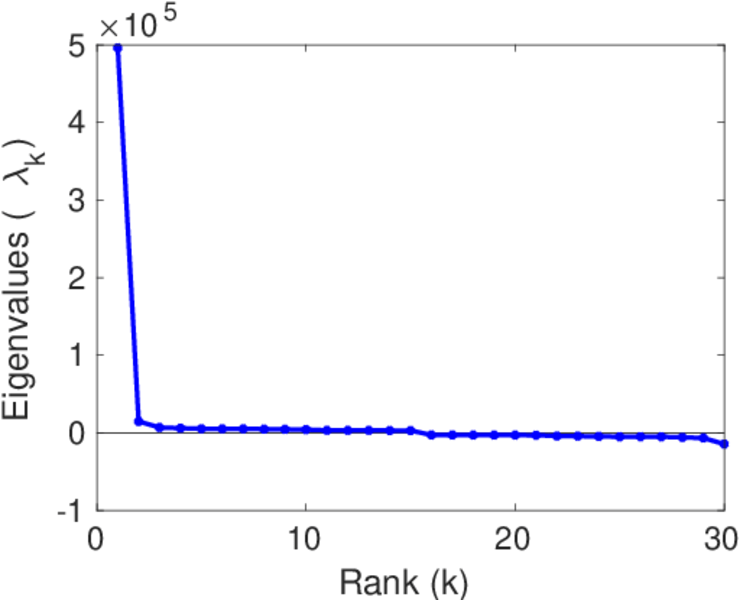
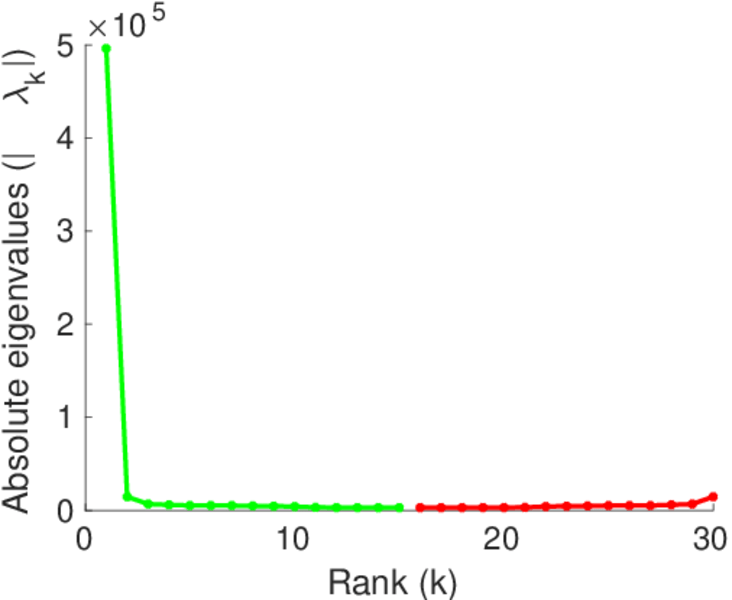
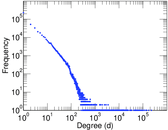
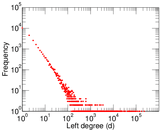
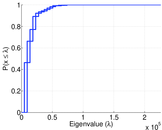
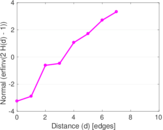
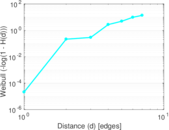
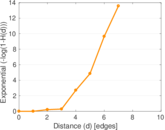
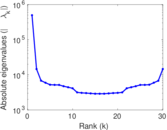
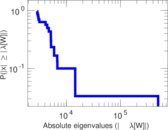
Plots


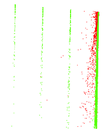
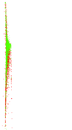
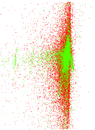


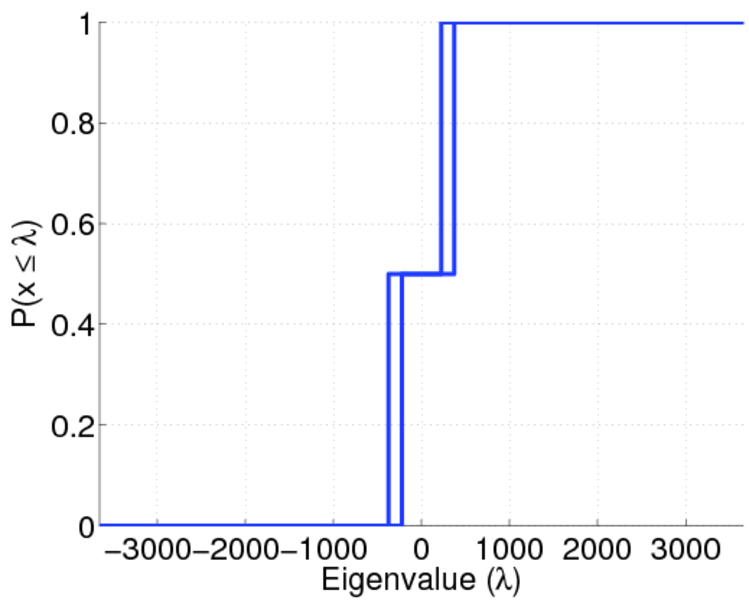
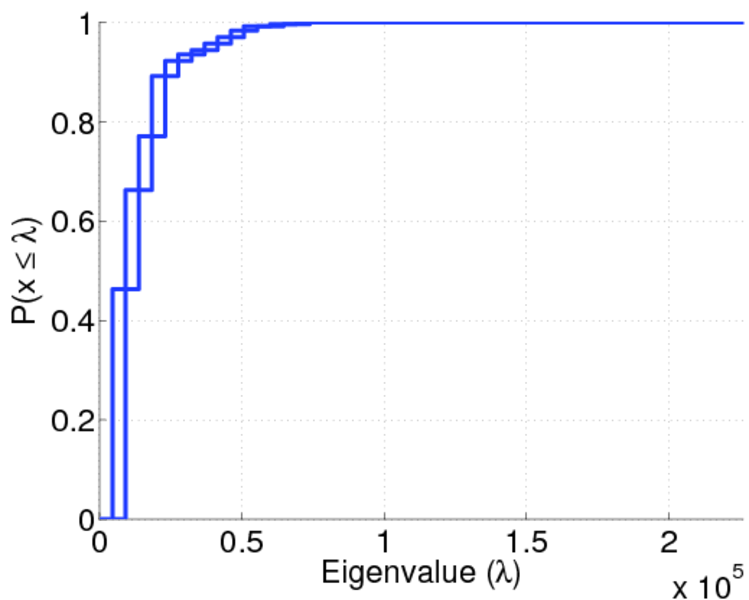
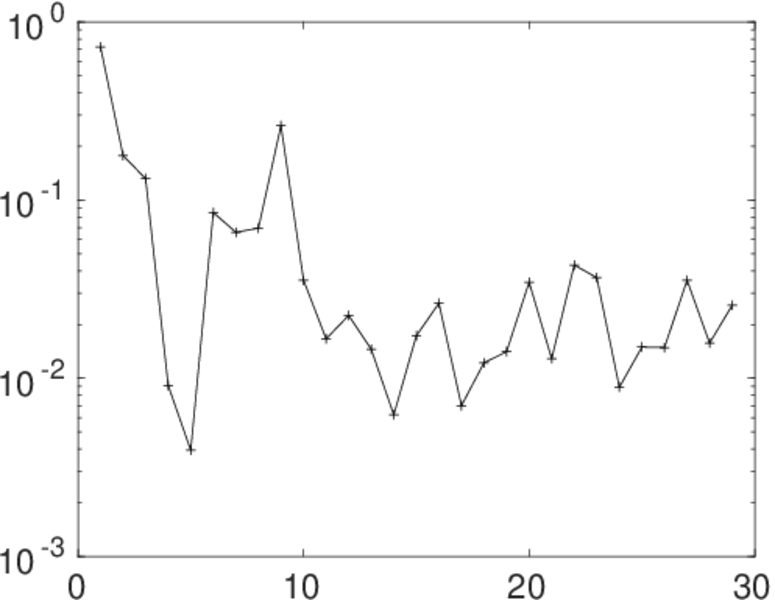
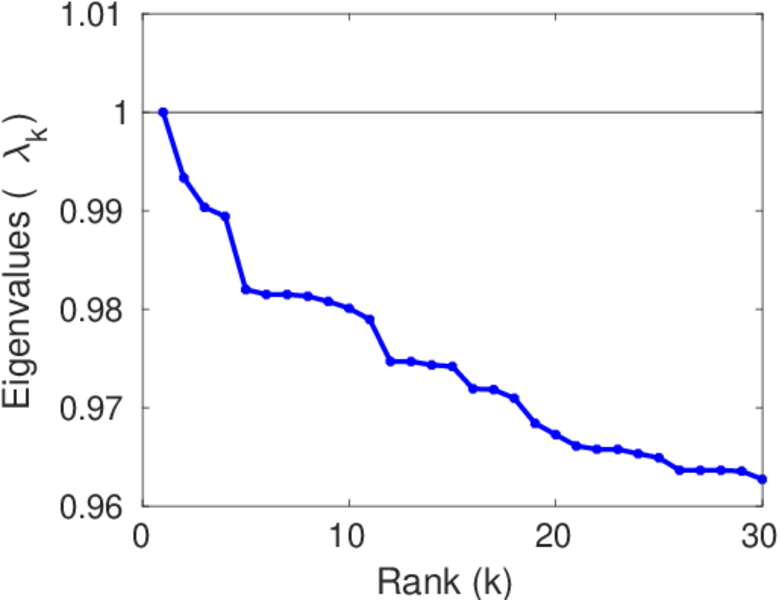
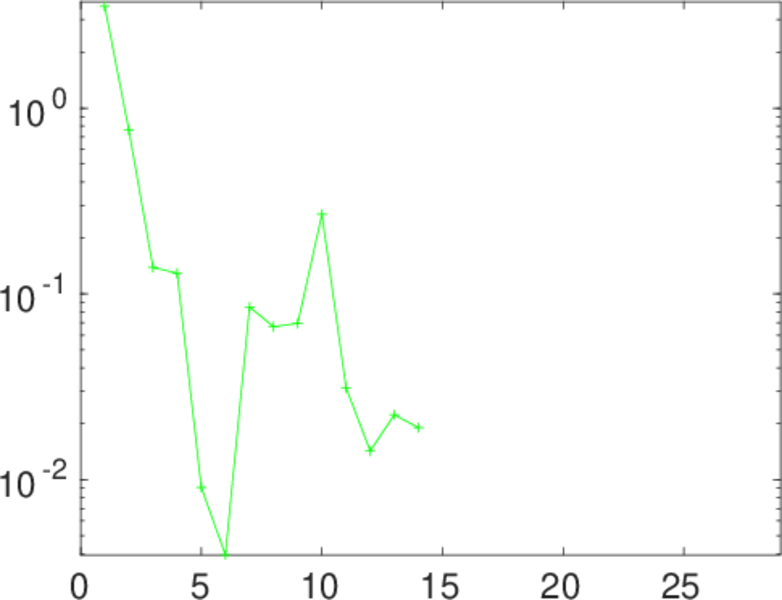
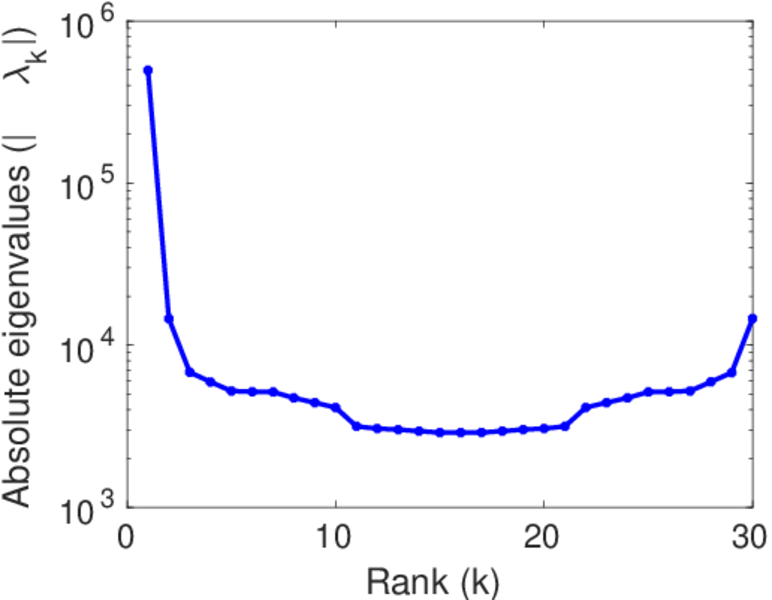
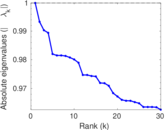
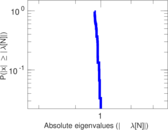
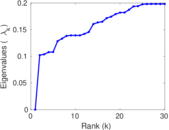
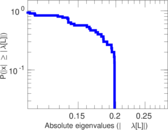
Matrix decompositions plots


Downloads
References
|
[1]
|
Jérôme Kunegis.
KONECT – The Koblenz Network Collection.
In Proc. Int. Conf. on World Wide Web Companion, pages
1343–1350, 2013.
[ http ]
|
|
[2]
|
Wikimedia Foundation.
Wikimedia downloads.
http://dumps.wikimedia.org/, January 2010.
|
 KONECT ‣ Networks ‣
Buy Me a Coffee
KONECT ‣ Networks ‣
Buy Me a Coffee