Wikipedia edits (hy)
This is the bipartite edit network of the Armenian Wikipedia. It contains users
and pages from the Armenian Wikipedia, connected by edit events. Each edge
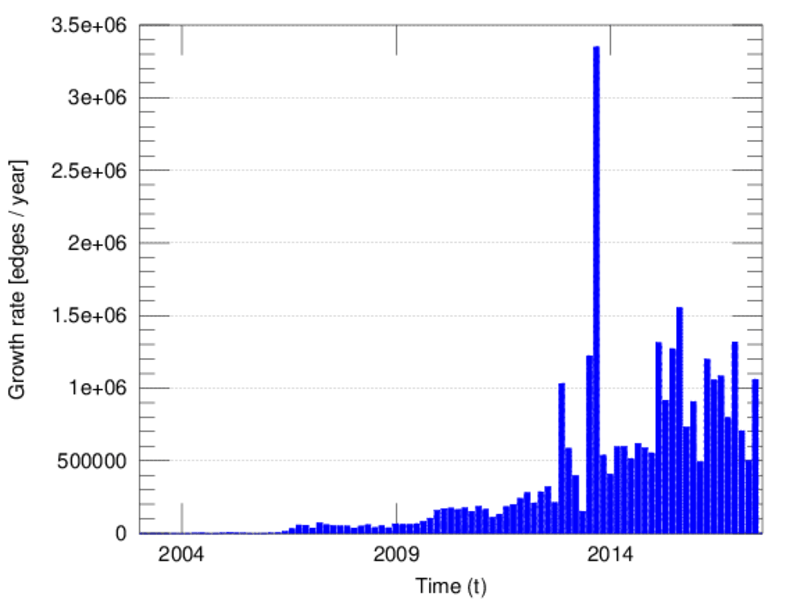
represents an edit. The dataset includes the timestamp of each edit.
Metadata
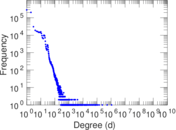
Statistics
| Size | n = | 767,832
|
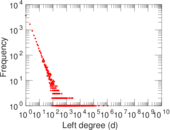
| Left size | n1 = | 11,615
|
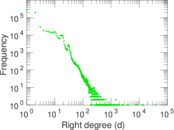
| Right size | n2 = | 756,217
|
| Volume | m = | 4,977,757
|
| Unique edge count | m̿ = | 2,303,210
|
| Wedge count | s = | 138,354,099,329
|
| Cross count | x = | 9.493 23 × 1020
|
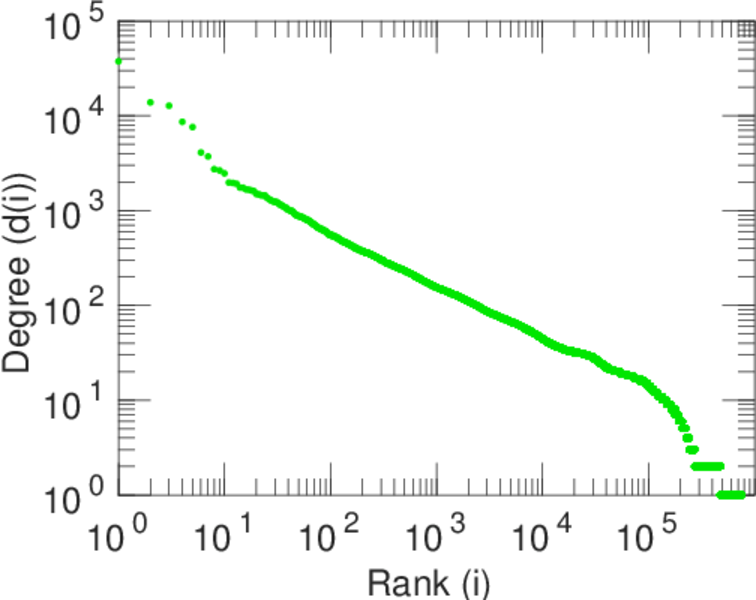
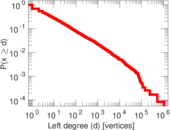
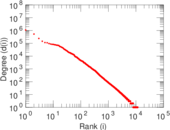
| Maximum degree | dmax = | 1,084,649
|
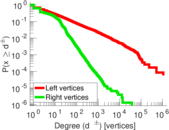
| Maximum left degree | d1max = | 1,084,649
|
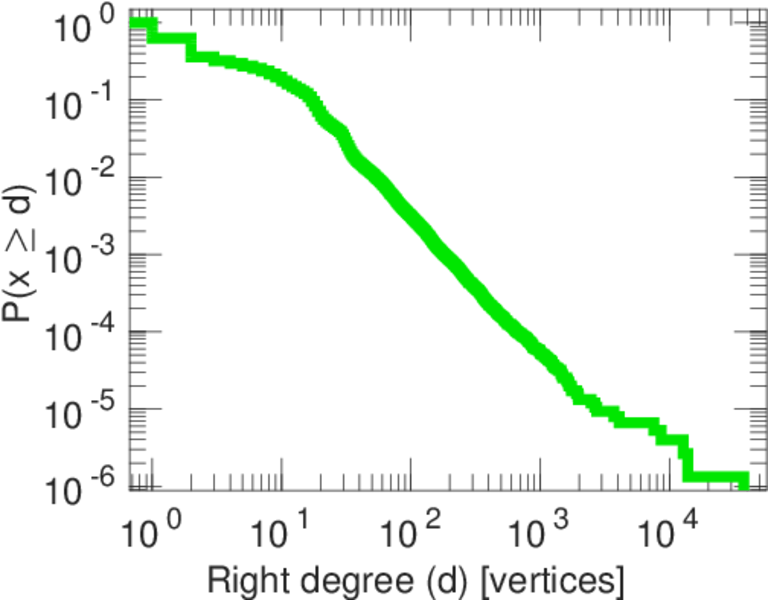
| Maximum right degree | d2max = | 37,532
|
| Average degree | d = | 12.965 7
|
| Average left degree | d1 = | 428.563
|
| Average right degree | d2 = | 6.582 45
|
| Average edge multiplicity | m̃ = | 2.161 23
|
| Size of LCC | N = | 763,099
|
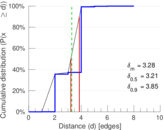
| Diameter | δ = | 11
|
| 50-Percentile effective diameter | δ0.5 = | 3.205 02
|
| 90-Percentile effective diameter | δ0.9 = | 3.850 42
|
| Median distance | δM = | 4
|
| Mean distance | δm = | 3.280 46
|
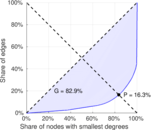
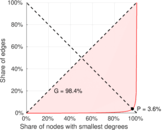
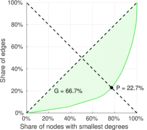
| Balanced inequality ratio | P = | 0.160 924
|
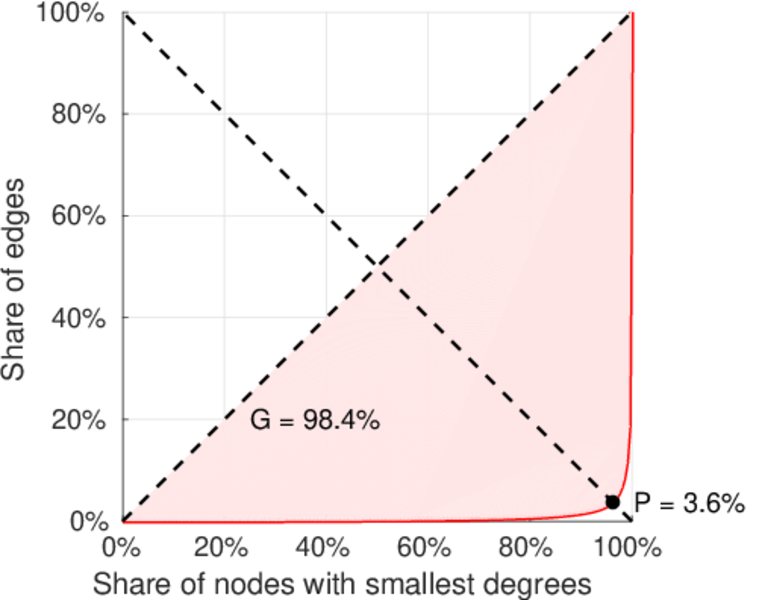
| Left balanced inequality ratio | P1 = | 0.035 689 6
|
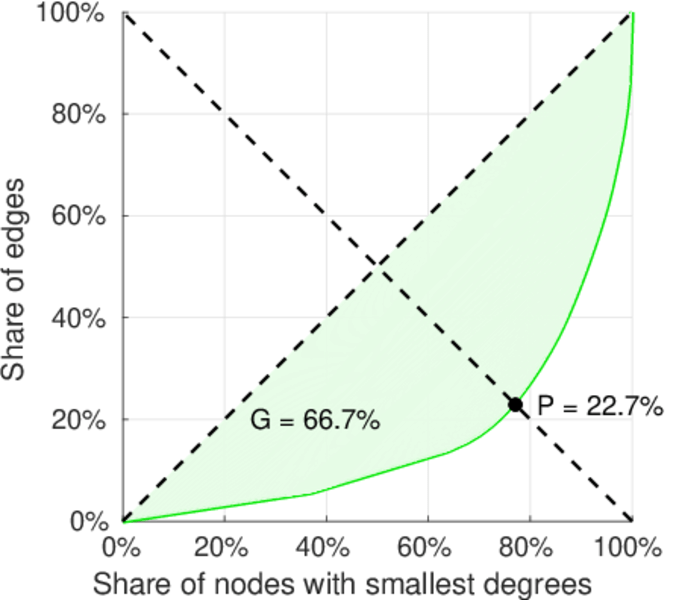
| Right balanced inequality ratio | P2 = | 0.227 365
|
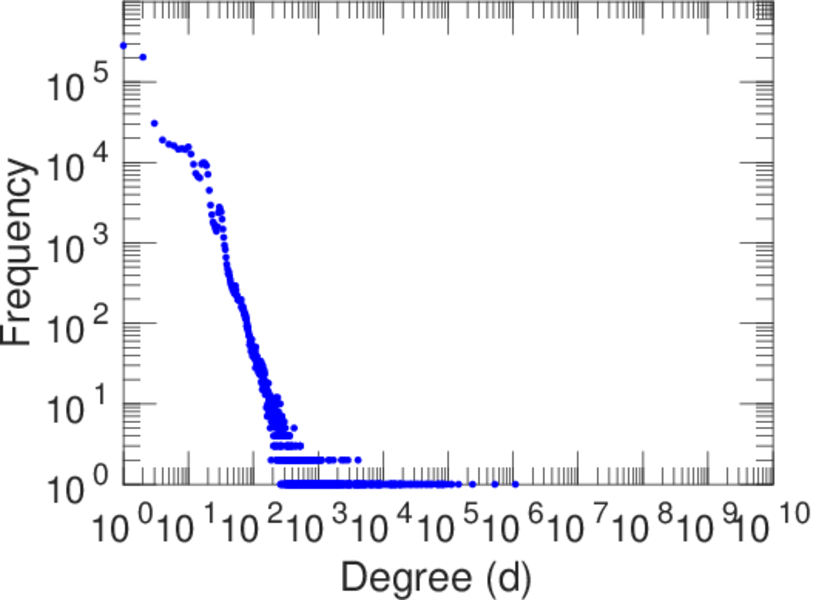
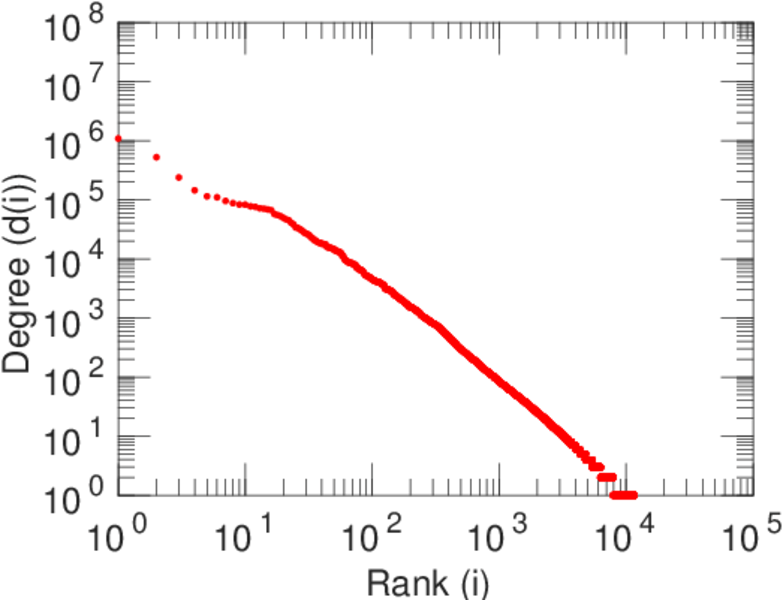
| Tail power law exponent | γt = | 2.751 00
|
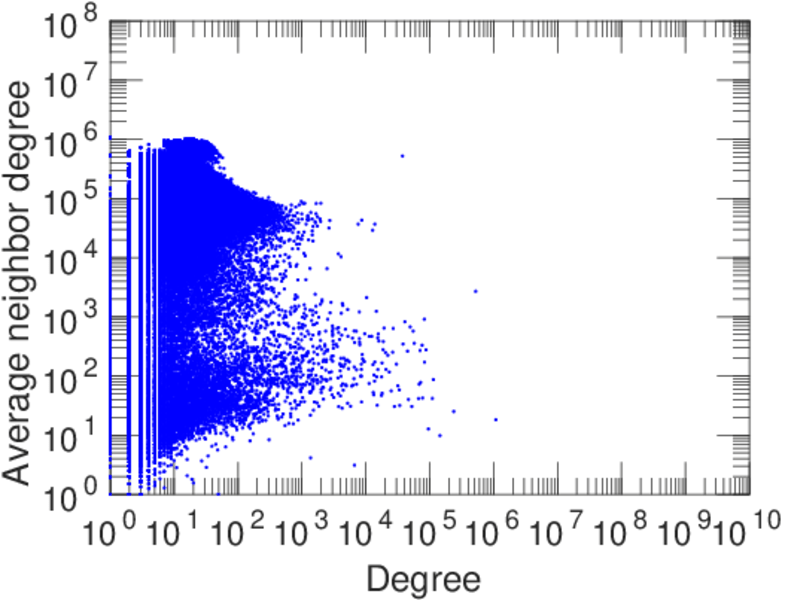
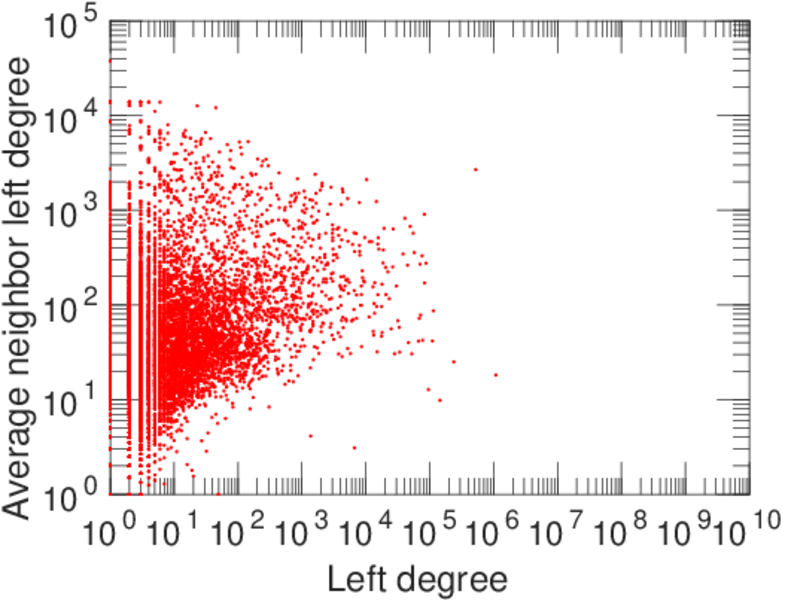
| Degree assortativity | ρ = | −0.256 920
|
| Degree assortativity p-value | pρ = | 0.000 00
|
| Spectral norm | α = | 37,216.2
|
| Spectral separation | |λ1[A] / λ2[A]| = | 7.402 45
|
| Controllability | C = | 744,407
|
| Relative controllability | Cr = | 0.972 045
|
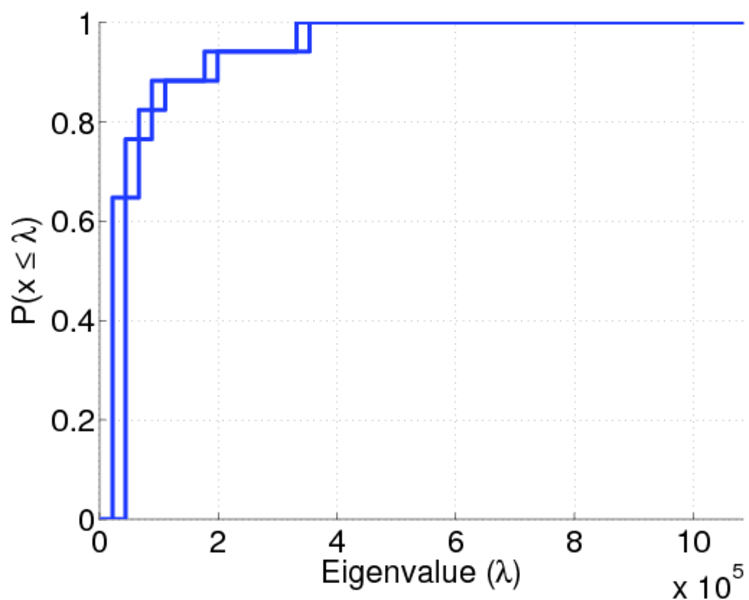
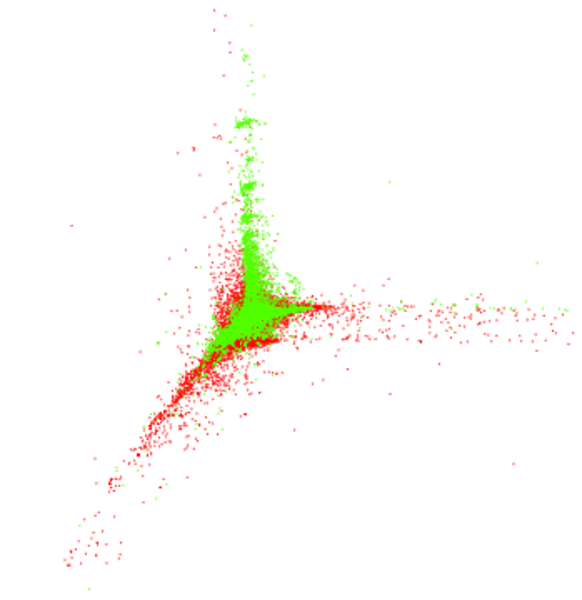
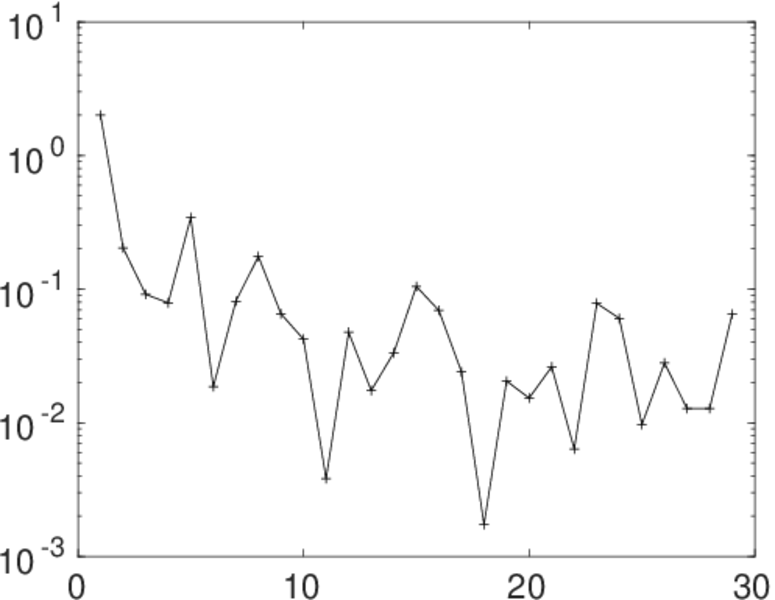
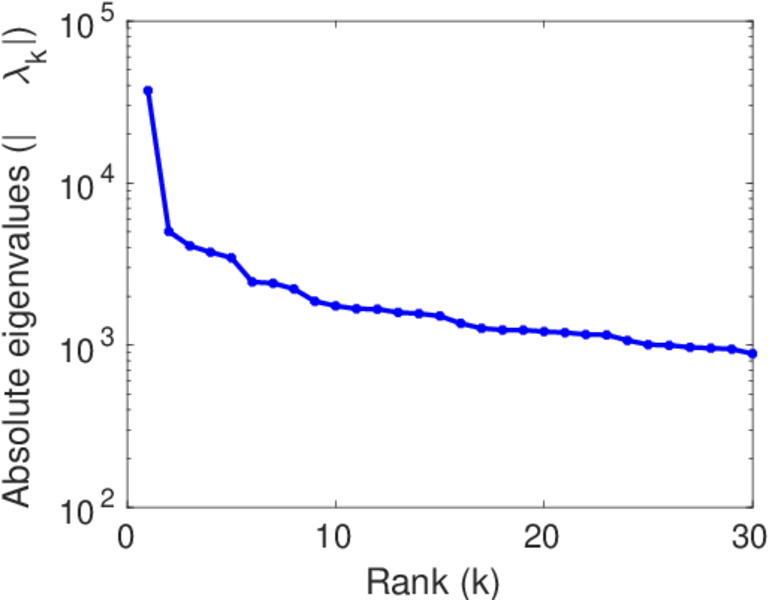
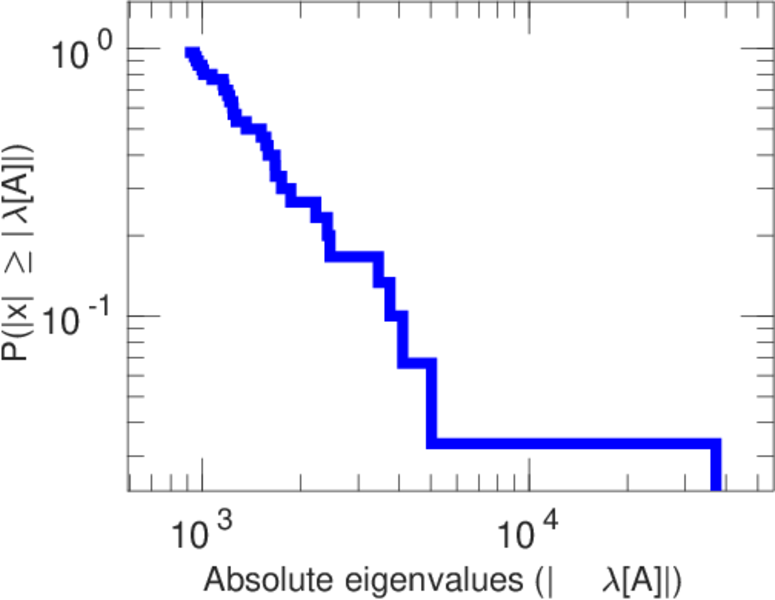
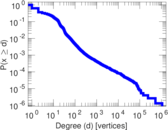
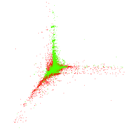
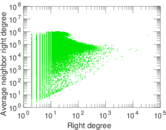
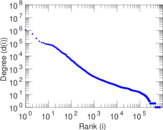
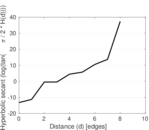
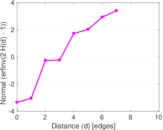
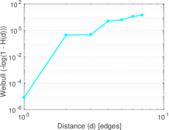
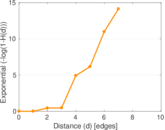
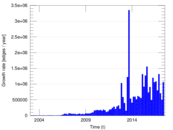
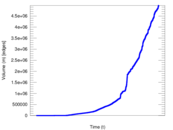
Plots


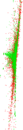


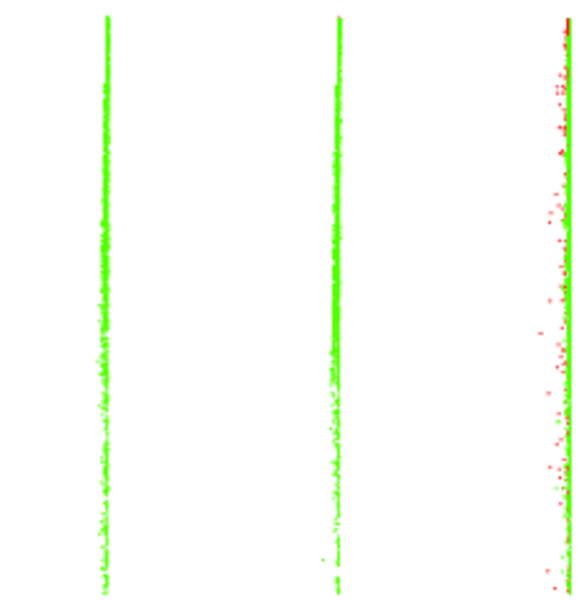
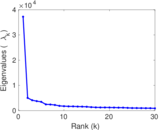
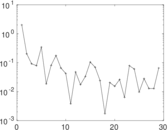
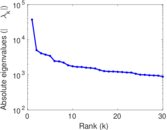
Matrix decompositions plots

Downloads
References
|
[1]
|
Jérôme Kunegis.
KONECT – The Koblenz Network Collection.
In Proc. Int. Conf. on World Wide Web Companion, pages
1343–1350, 2013.
[ http ]
|
|
[2]
|
Wikimedia Foundation.
Wikimedia downloads.
http://dumps.wikimedia.org/, January 2010.
|
 KONECT ‣ Networks ‣
Buy Me a Coffee
KONECT ‣ Networks ‣
Buy Me a Coffee