Wikipedia edits (id)
This is the bipartite edit network of the Indonesian Wikipedia. It contains
users and pages from the Indonesian Wikipedia, connected by edit events. Each
edge represents an edit. The dataset includes the timestamp of each edit.
Metadata
Statistics
| Size | n = | 2,308,975
|
| Left size | n1 = | 125,481
|
| Right size | n2 = | 2,183,494
|
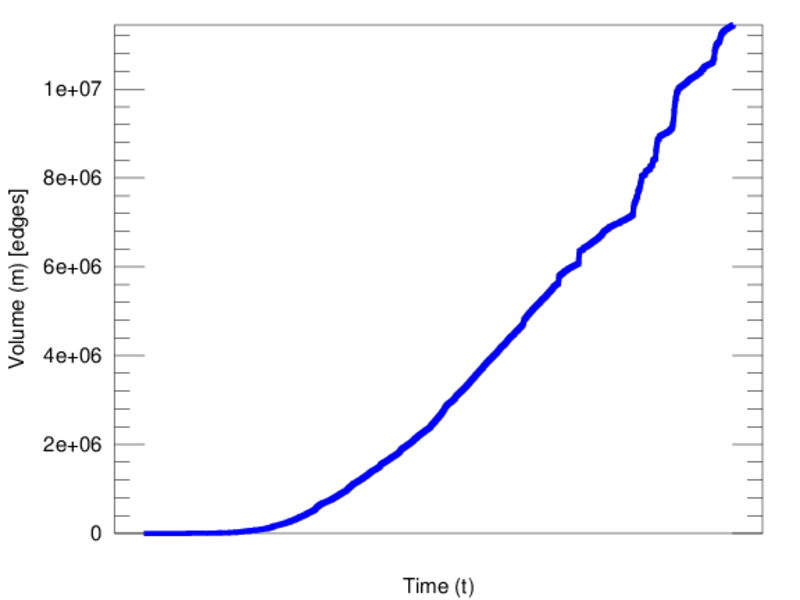
| Volume | m = | 11,441,391
|
| Unique edge count | m̿ = | 6,126,592
|
| Wedge count | s = | 449,475,807,219
|
| Claw count | z = | 49,734,218,329,744,864
|
| Cross count | x = | 5.107 64 × 1021
|
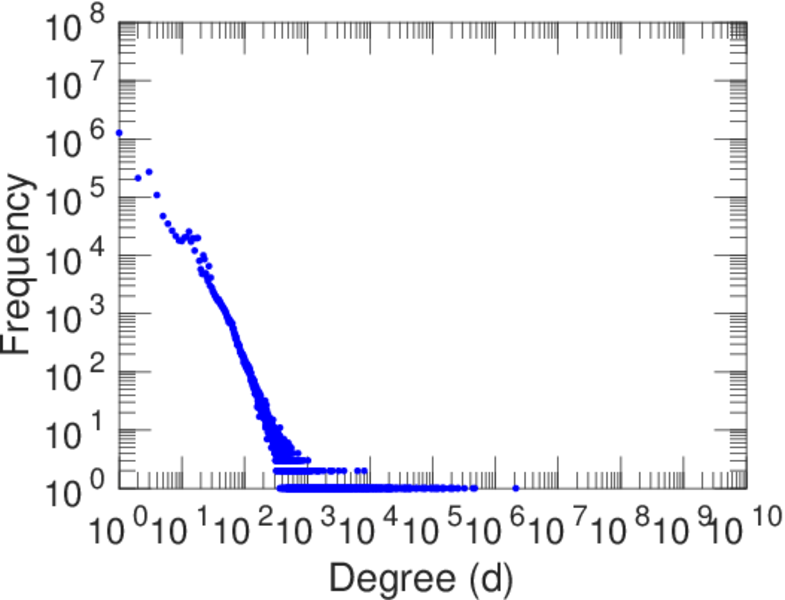
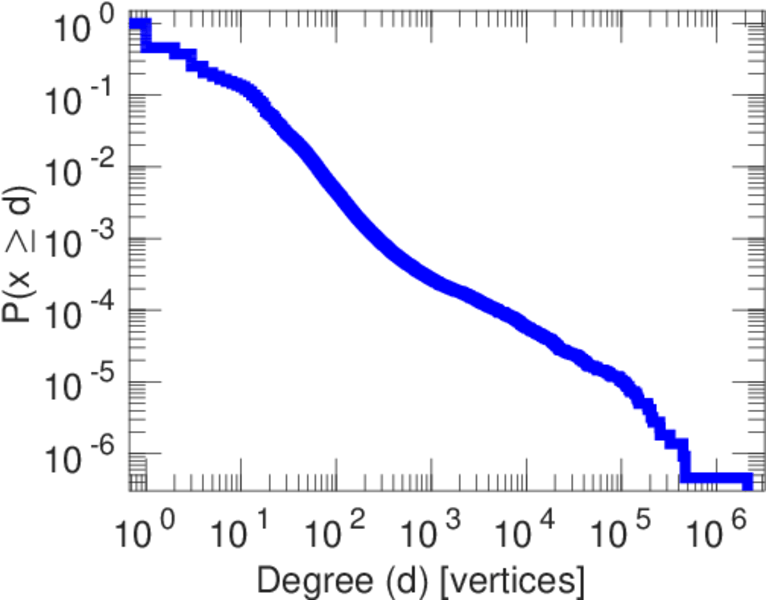
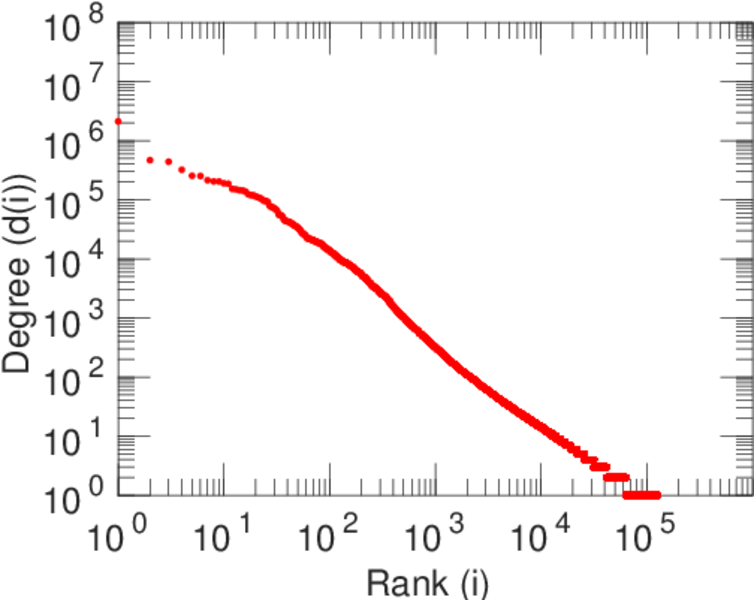
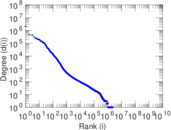
| Maximum degree | dmax = | 2,117,651
|
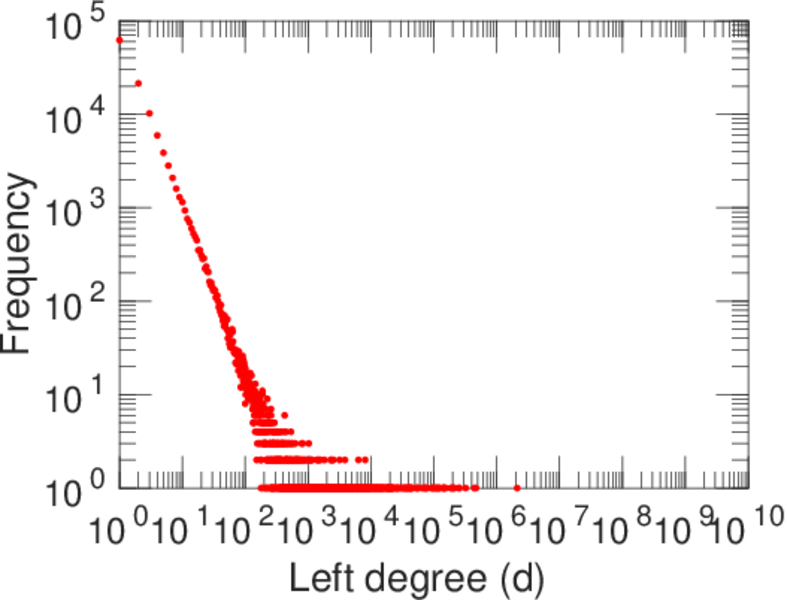
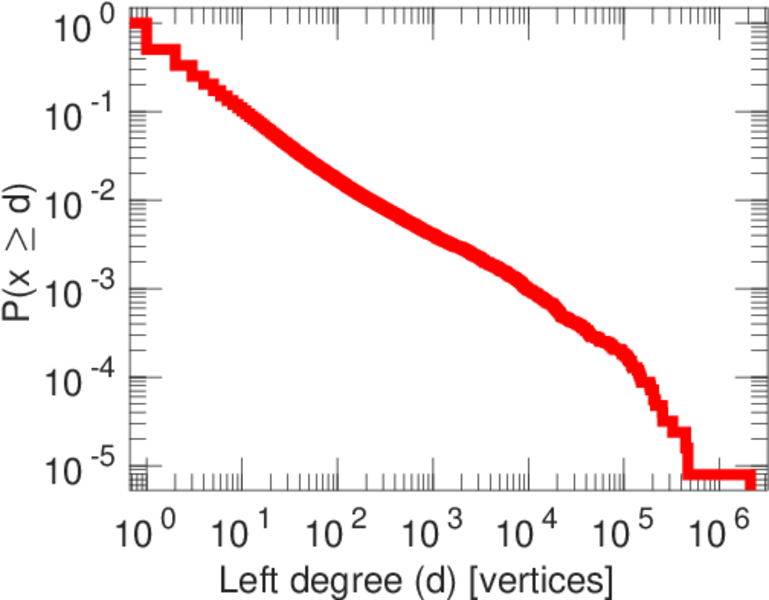
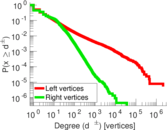
| Maximum left degree | d1max = | 2,117,651
|
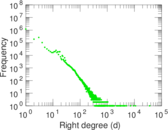
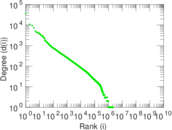
| Maximum right degree | d2max = | 36,499
|
| Average degree | d = | 9.910 36
|
| Average left degree | d1 = | 91.180 3
|
| Average right degree | d2 = | 5.239 95
|
| Fill | p = | 2.236 09 × 10−5
|
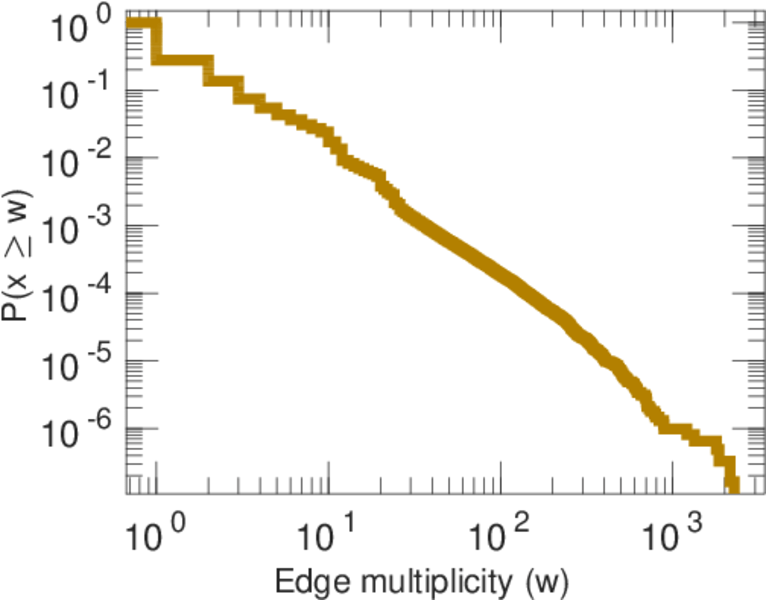
| Average edge multiplicity | m̃ = | 1.867 50
|
| Size of LCC | N = | 2,267,128
|
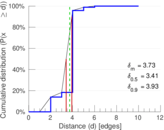
| Diameter | δ = | 12
|
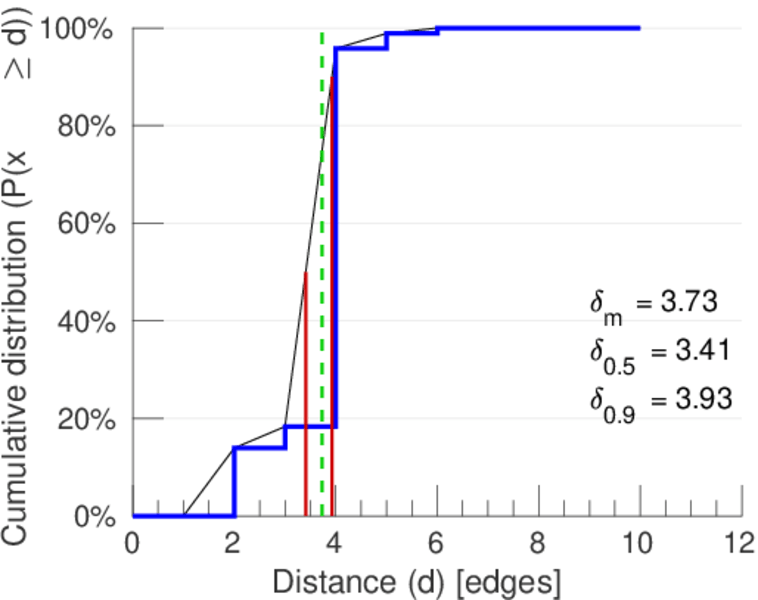
| 50-Percentile effective diameter | δ0.5 = | 3.408 97
|
| 90-Percentile effective diameter | δ0.9 = | 3.925 24
|
| Median distance | δM = | 4
|
| Mean distance | δm = | 3.731 11
|
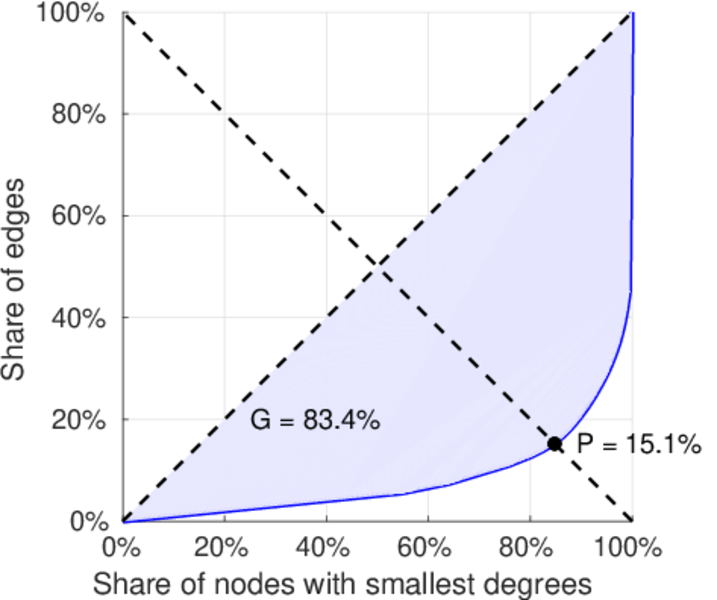
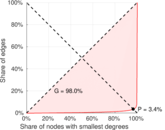
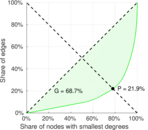
| Balanced inequality ratio | P = | 0.147 533
|
| Left balanced inequality ratio | P1 = | 0.033 614 4
|
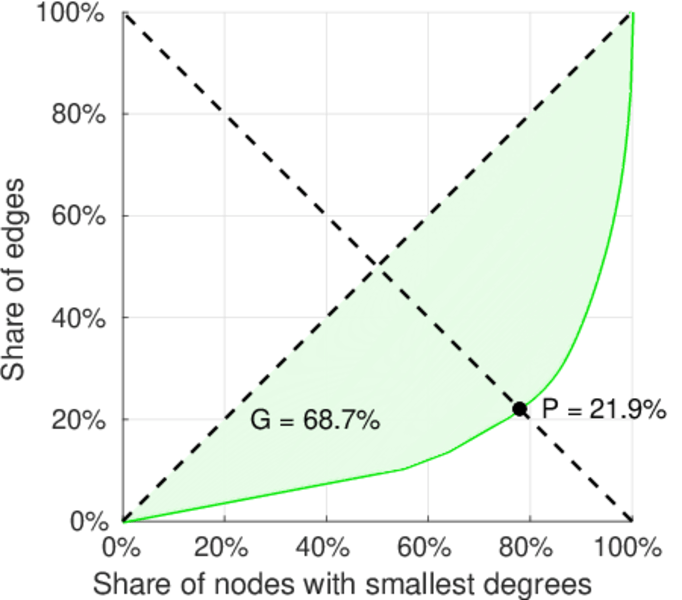
| Right balanced inequality ratio | P2 = | 0.219 134
|
| Relative edge distribution entropy | Her = | 0.696 458
|
| Power law exponent | γ = | 2.971 74
|
| Tail power law exponent | γt = | 2.081 00
|
| Degree assortativity | ρ = | −0.061 512 4
|
| Degree assortativity p-value | pρ = | 0.000 00
|
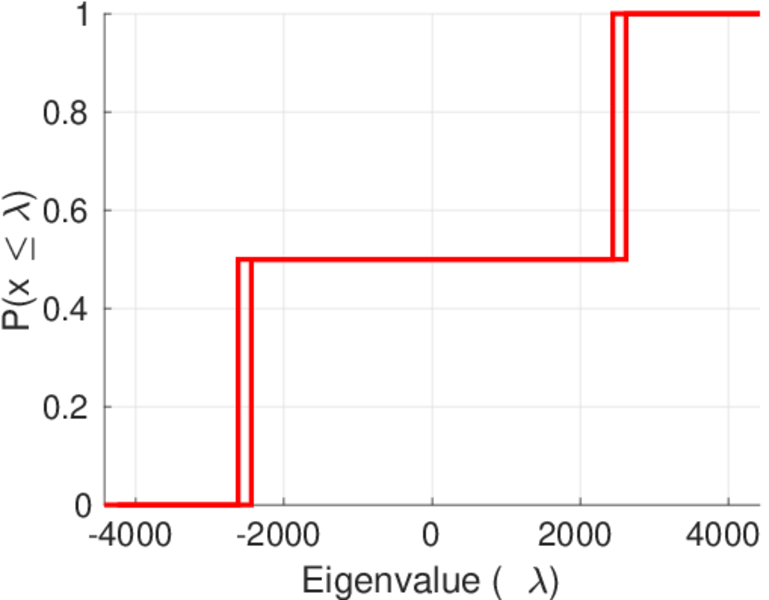
| Spectral norm | α = | 4,426.12
|
| Controllability | C = | 2,131,320
|
| Relative controllability | Cr = | 0.924 046
|
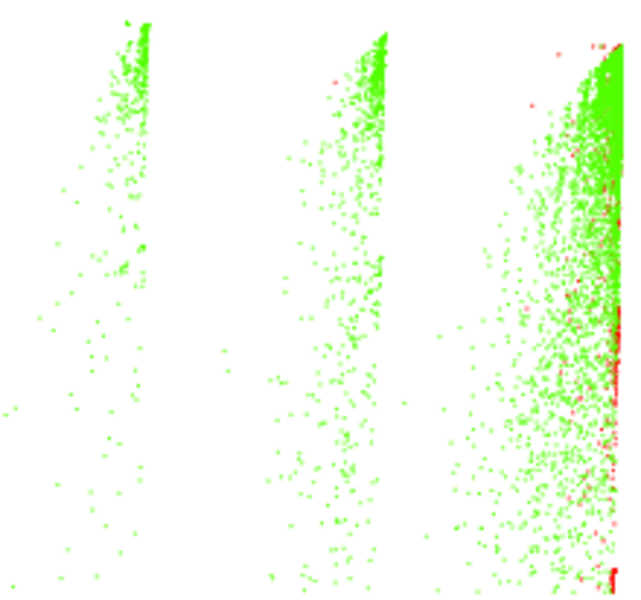
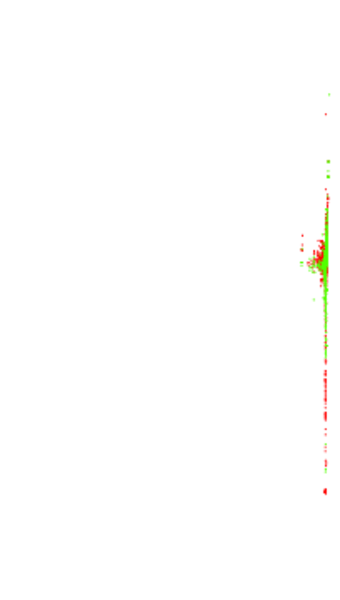
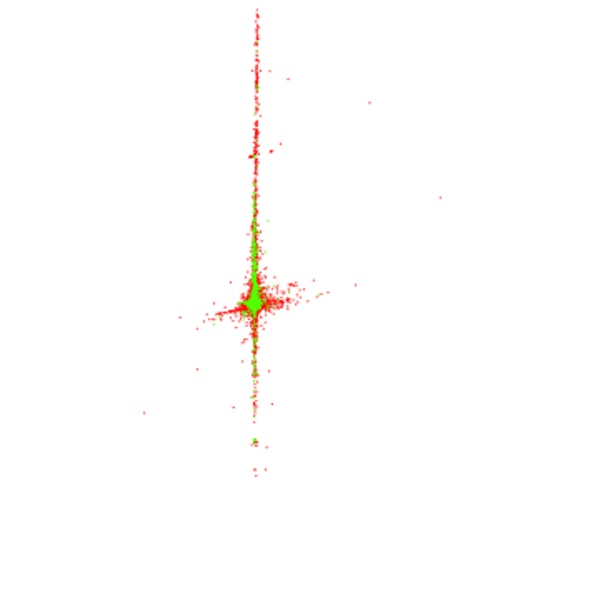
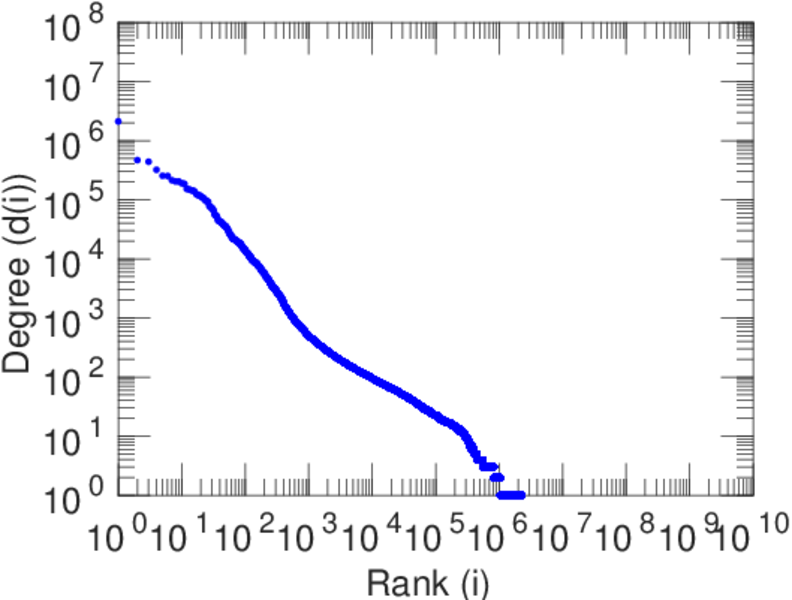
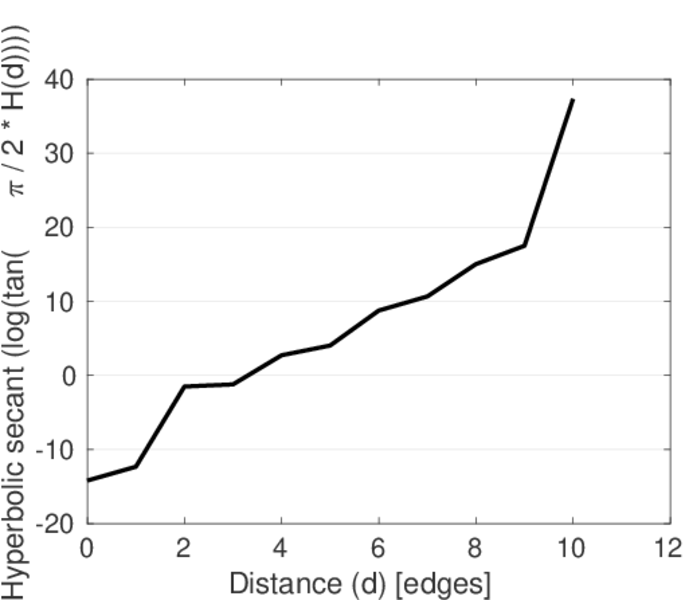
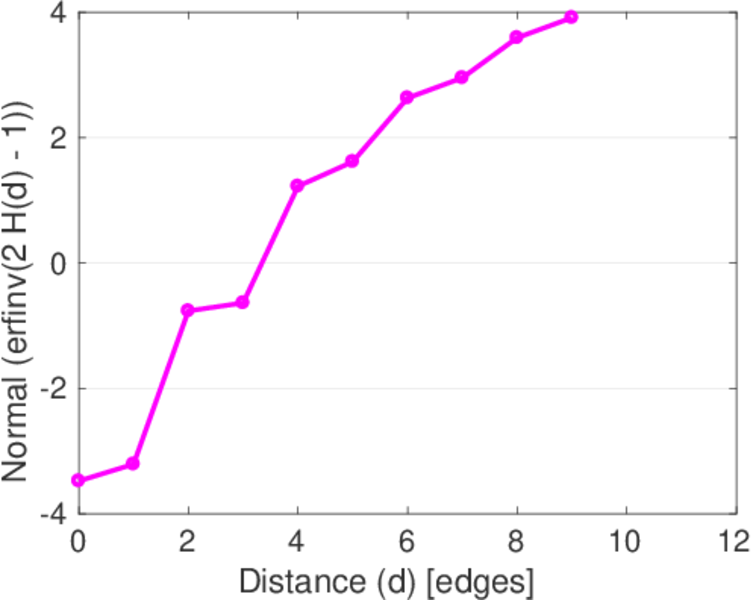
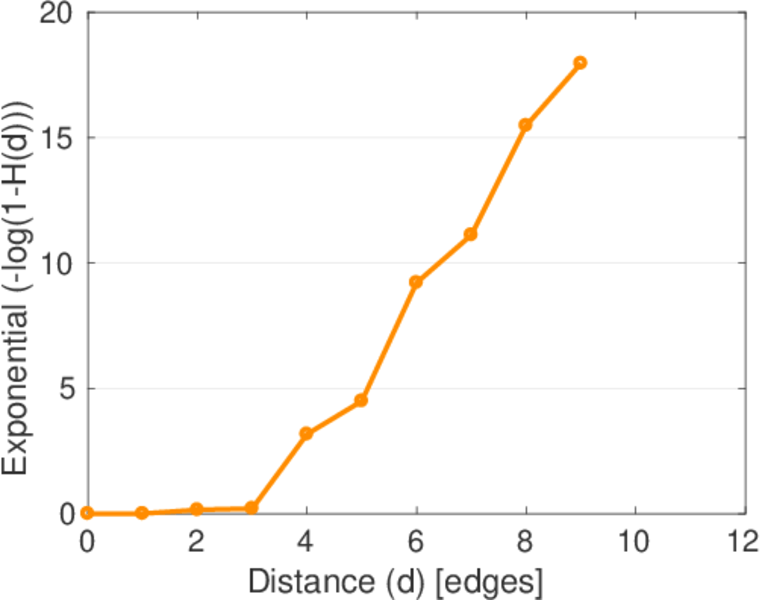
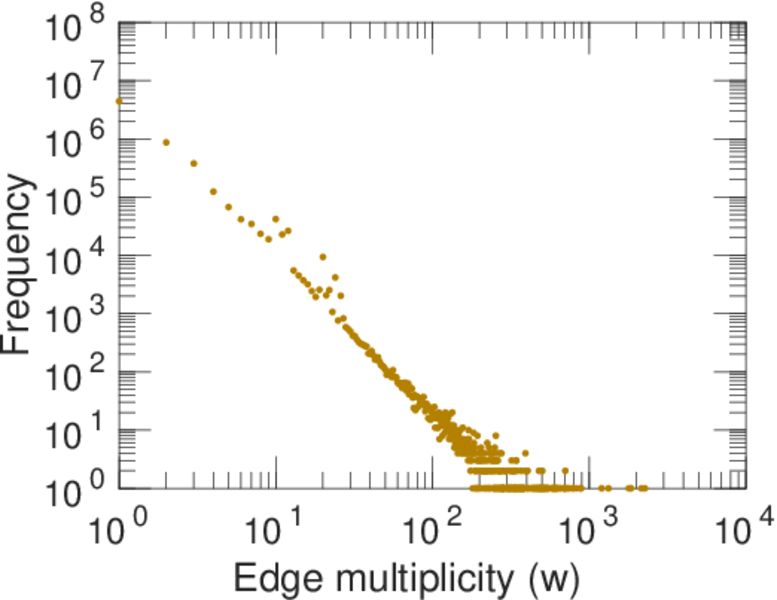
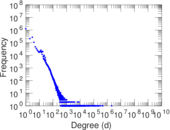
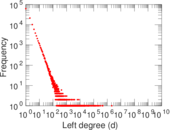
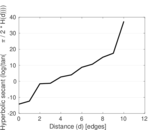
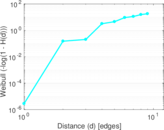
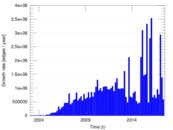
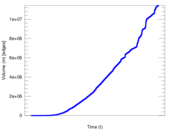
Plots


Downloads
References
|
[1]
|
Jérôme Kunegis.
KONECT – The Koblenz Network Collection.
In Proc. Int. Conf. on World Wide Web Companion, pages
1343–1350, 2013.
[ http ]
|
|
[2]
|
Wikimedia Foundation.
Wikimedia downloads.
http://dumps.wikimedia.org/, January 2010.
|
 KONECT ‣ Networks ‣
Buy Me a Coffee
KONECT ‣ Networks ‣
Buy Me a Coffee