Wikipedia edits (ka)
This is the bipartite edit network of the Georgian Wikipedia. It contains users
and pages from the Georgian Wikipedia, connected by edit events. Each edge
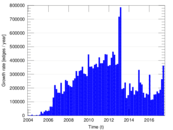
represents an edit. The dataset includes the timestamp of each edit.
Metadata
Statistics
| Size | n = | 337,163
|
| Left size | n1 = | 11,230
|
| Right size | n2 = | 325,933
|
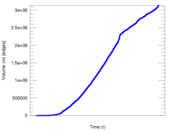
| Volume | m = | 3,135,173
|
| Unique edge count | m̿ = | 1,409,327
|
| Wedge count | s = | 16,115,587,424
|
| Claw count | z = | 216,479,232,866,756
|
| 4-Tour count | T4 = | 247,182,705,442
|
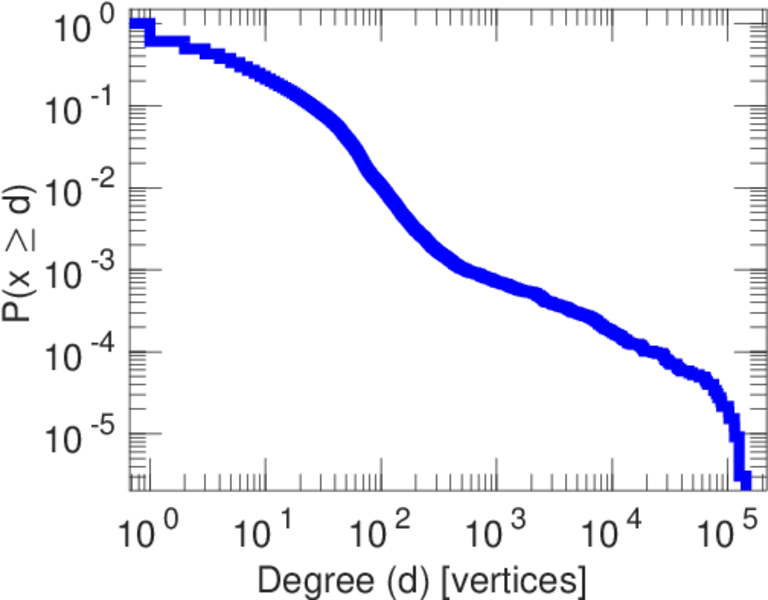
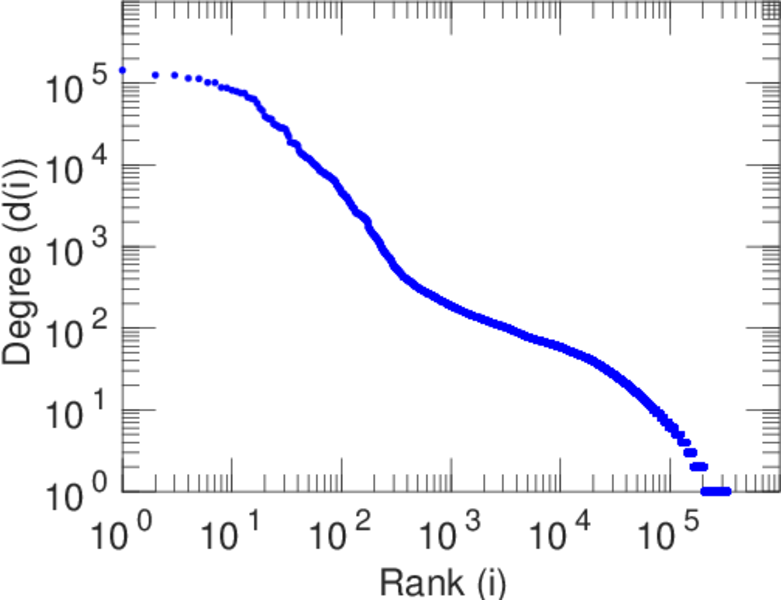
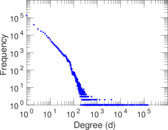
| Maximum degree | dmax = | 144,028
|
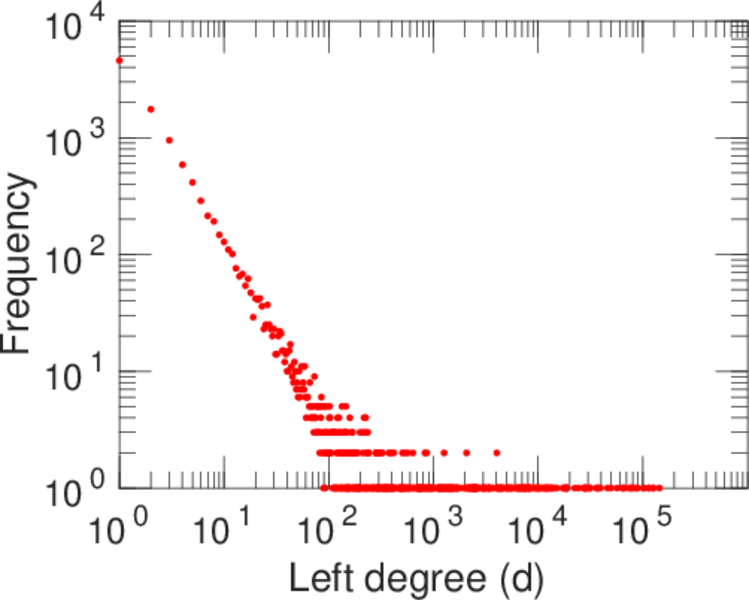
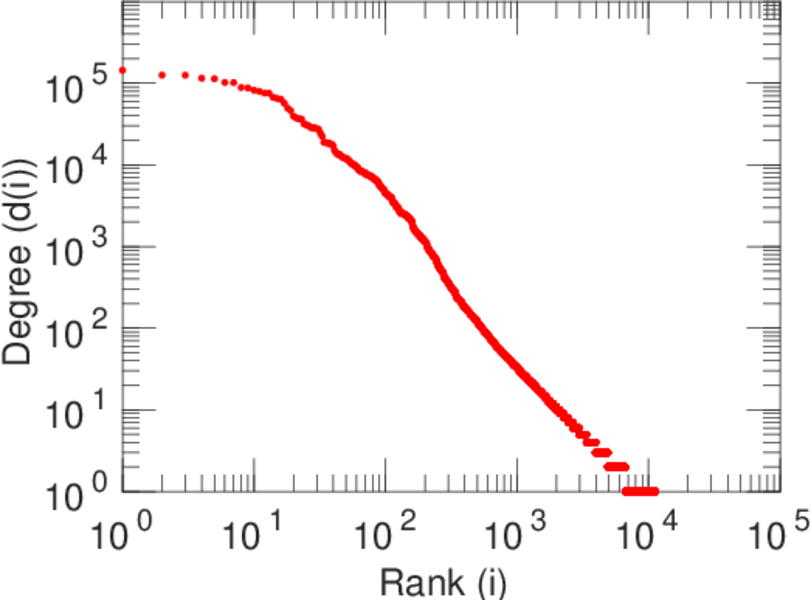
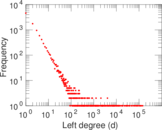
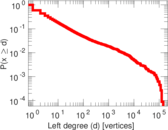
| Maximum left degree | d1max = | 144,028
|
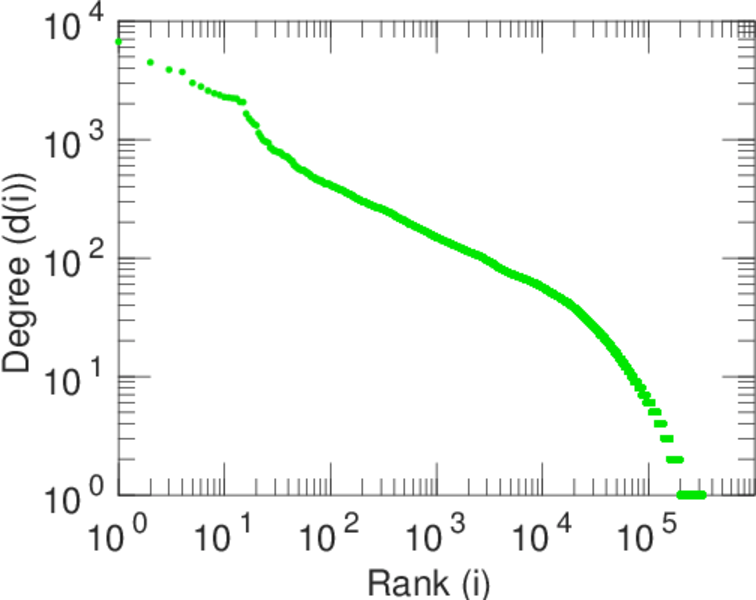
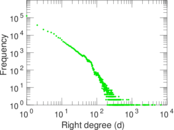
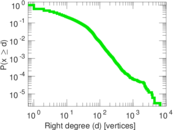
| Maximum right degree | d2max = | 6,692
|
| Average degree | d = | 18.597 4
|
| Average left degree | d1 = | 279.178
|
| Average right degree | d2 = | 9.619 07
|
| Fill | p = | 0.000 385 038
|
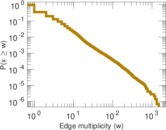
| Average edge multiplicity | m̃ = | 2.224 59
|
| Size of LCC | N = | 334,873
|
| Diameter | δ = | 12
|
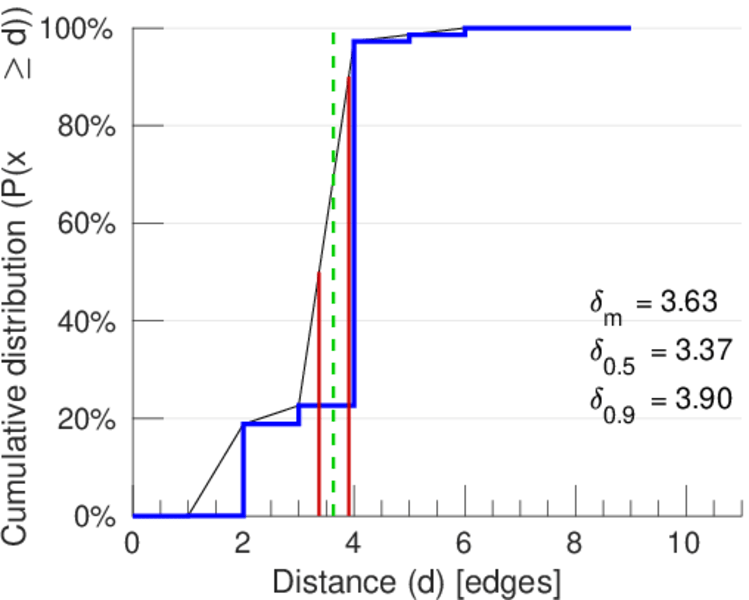
| 50-Percentile effective diameter | δ0.5 = | 3.366 81
|
| 90-Percentile effective diameter | δ0.9 = | 3.902 72
|
| Median distance | δM = | 4
|
| Mean distance | δm = | 3.626 84
|
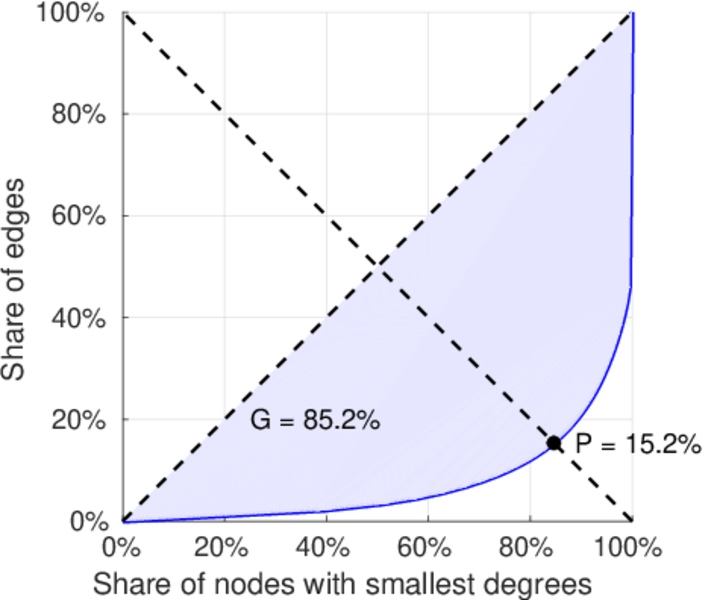
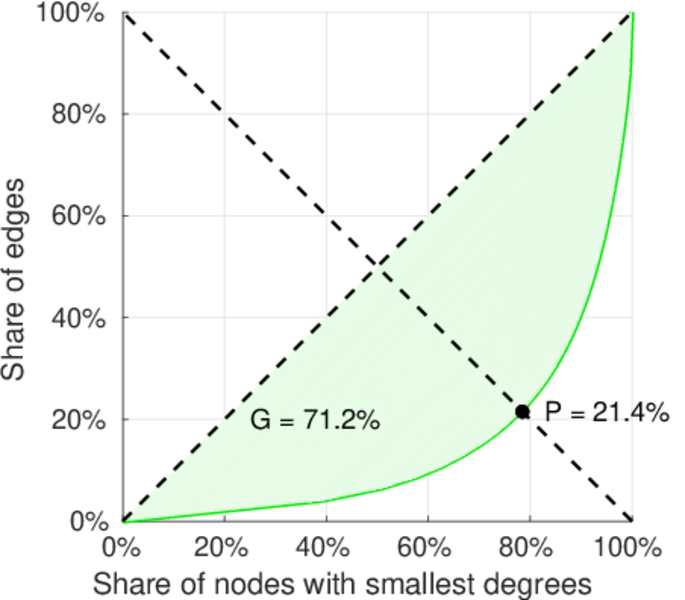
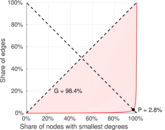
| Gini coefficient | G = | 0.853 706
|
| Balanced inequality ratio | P = | 0.150 395
|
| Left balanced inequality ratio | P1 = | 0.027 549 0
|
| Right balanced inequality ratio | P2 = | 0.213 836
|
| Relative edge distribution entropy | Her = | 0.715 158
|
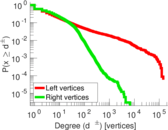
| Power law exponent | γ = | 2.254 32
|
| Tail power law exponent with p | γ3 = | 1.801 00
|
| p-value | p = | 0.000 00
|
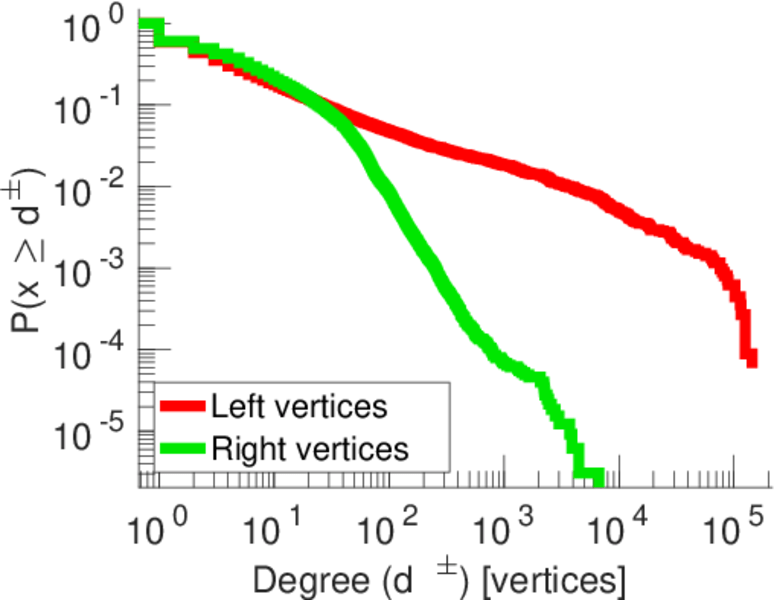
| Left tail power law exponent with p | γ3,1 = | 1.791 00
|
| Left p-value | p1 = | 0.000 00
|
| Right tail power law exponent with p | γ3,2 = | 4.511 00
|
| Right p-value | p2 = | 0.000 00
|
| Degree assortativity | ρ = | −0.193 348
|
| Degree assortativity p-value | pρ = | 0.000 00
|
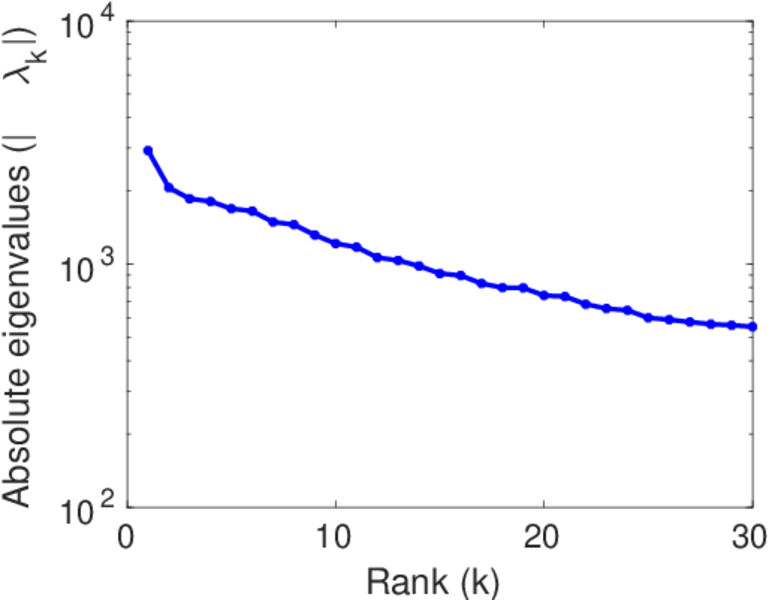
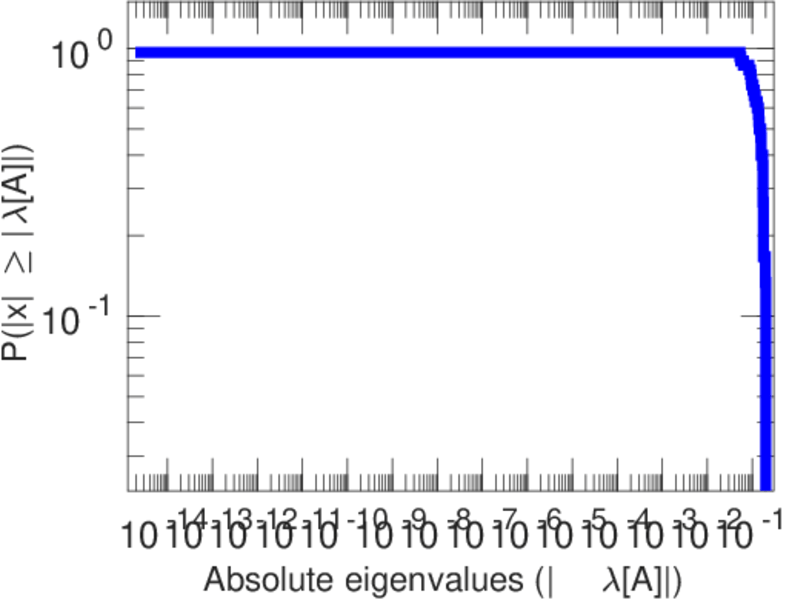
| Spectral norm | α = | 2,931.90
|
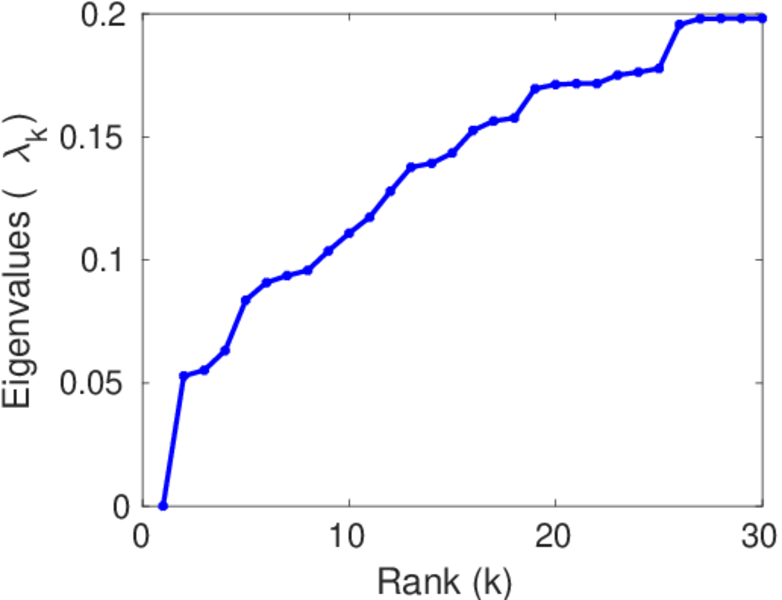
| Algebraic connectivity | a = | 0.052 802 1
|
| Spectral separation | |λ1[A] / λ2[A]| = | 1.422 16
|
| Controllability | C = | 316,453
|
| Relative controllability | Cr = | 0.940 059
|
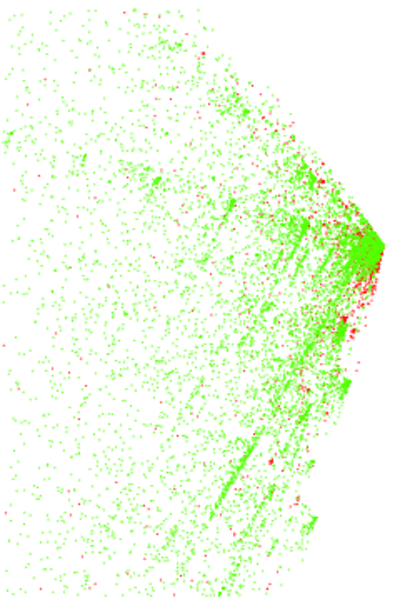
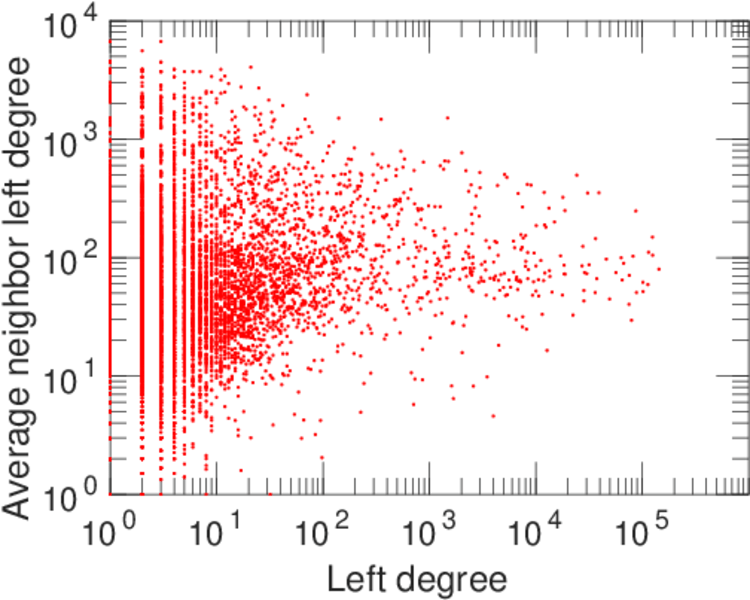
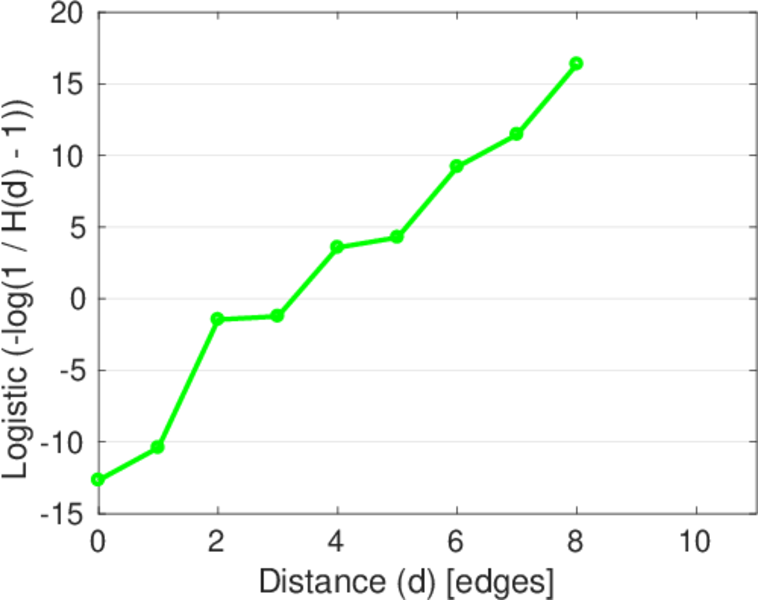
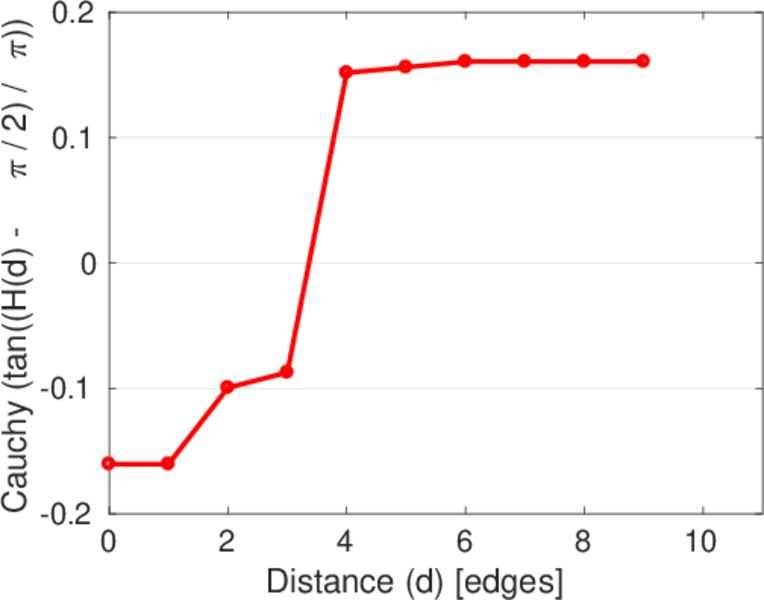
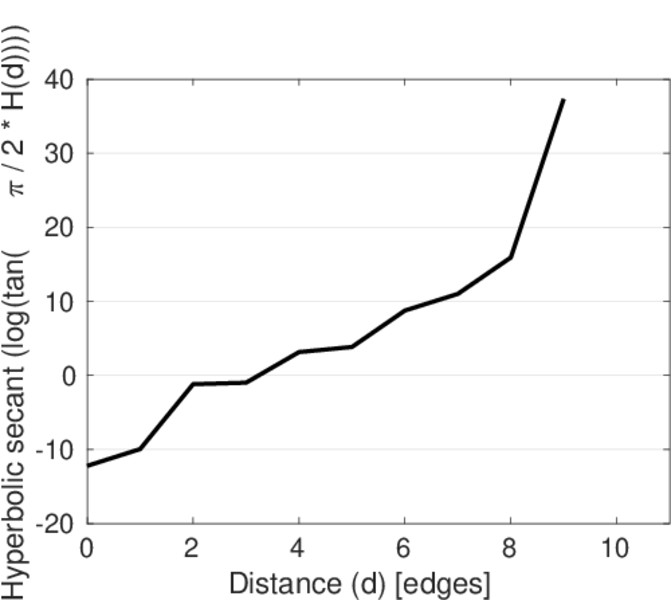
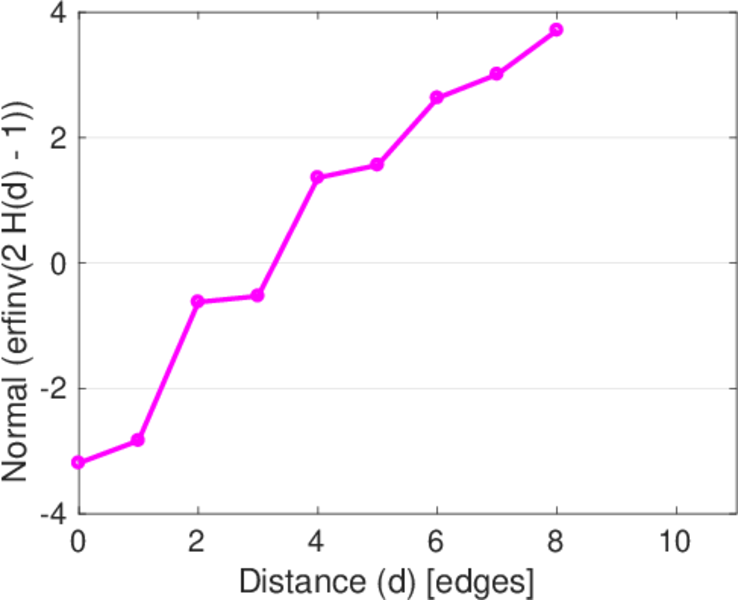
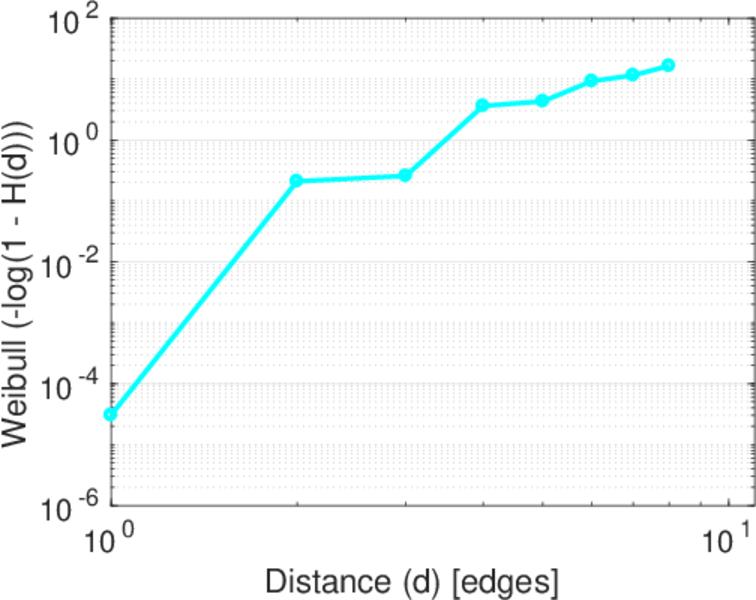
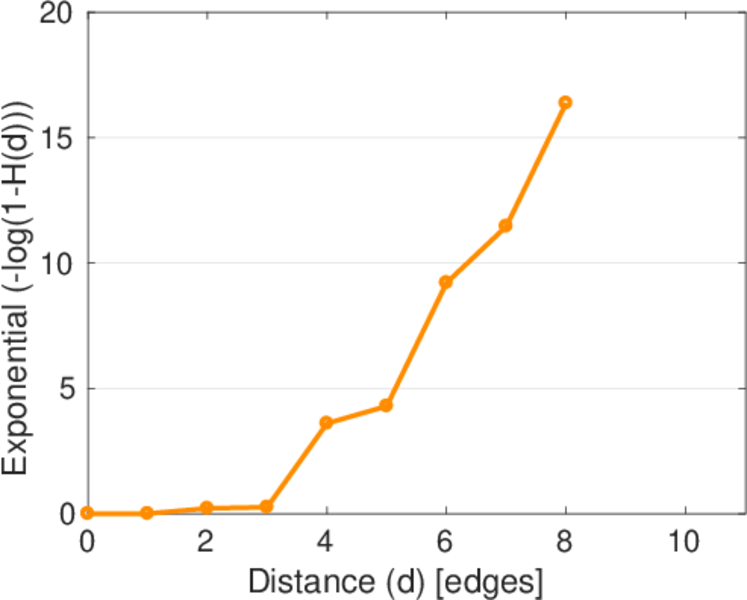
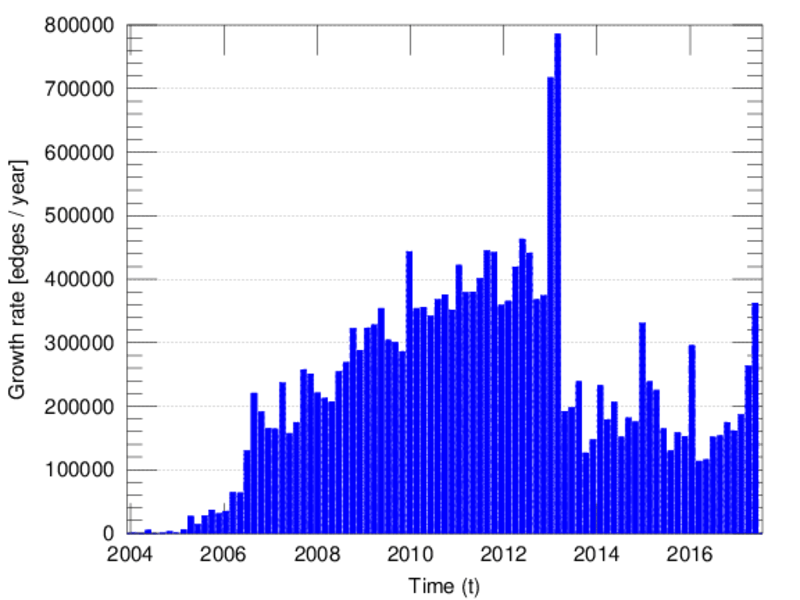
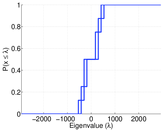
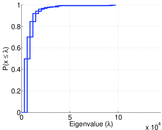
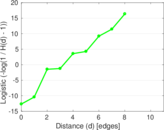
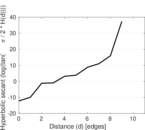
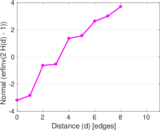
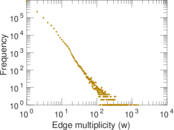
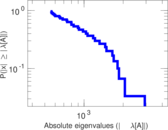
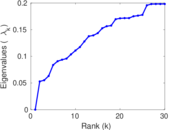
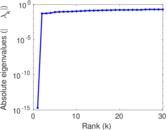
Plots


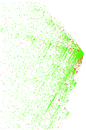
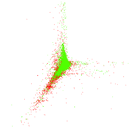


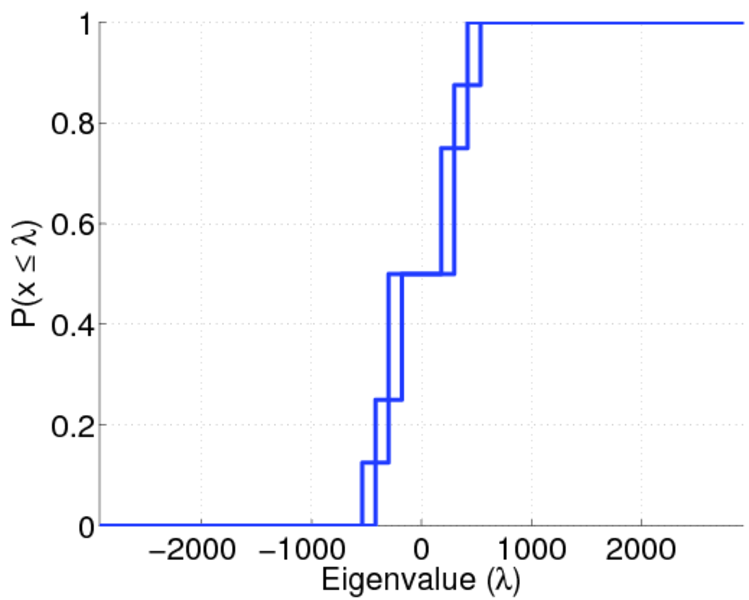
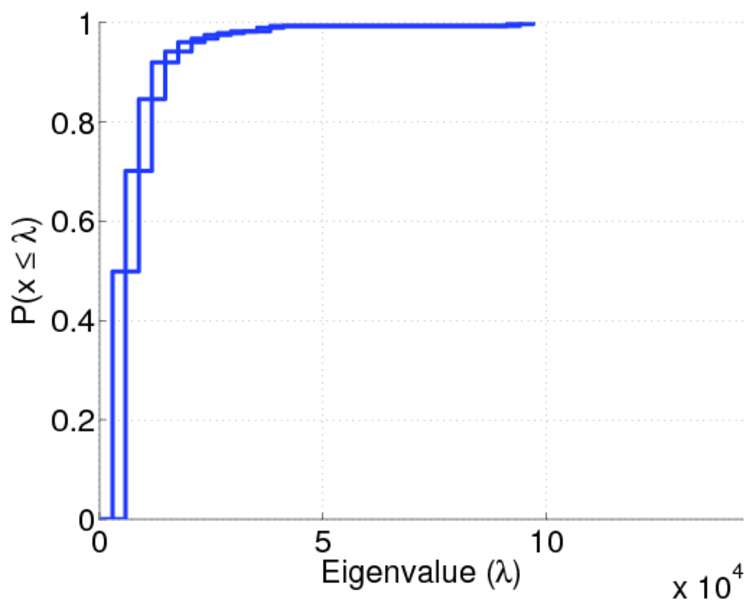
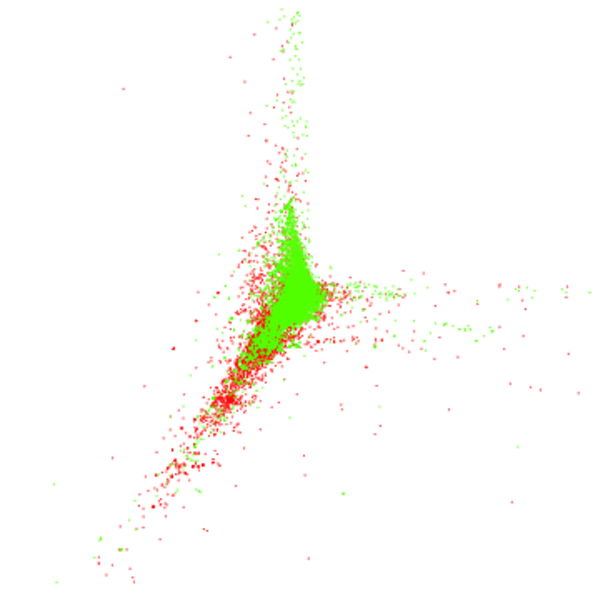
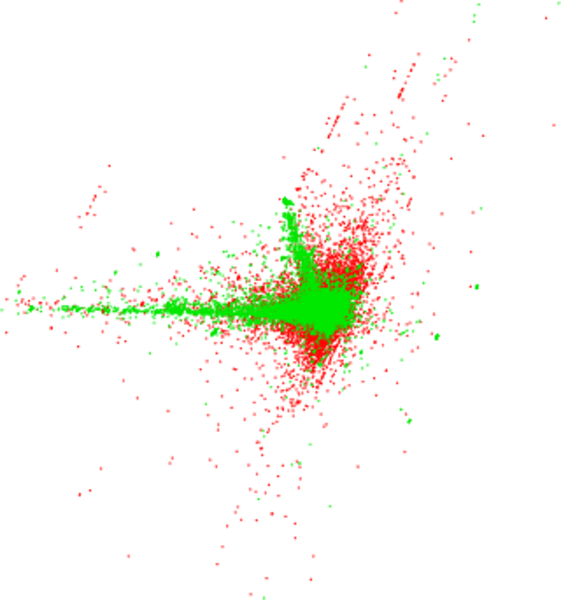
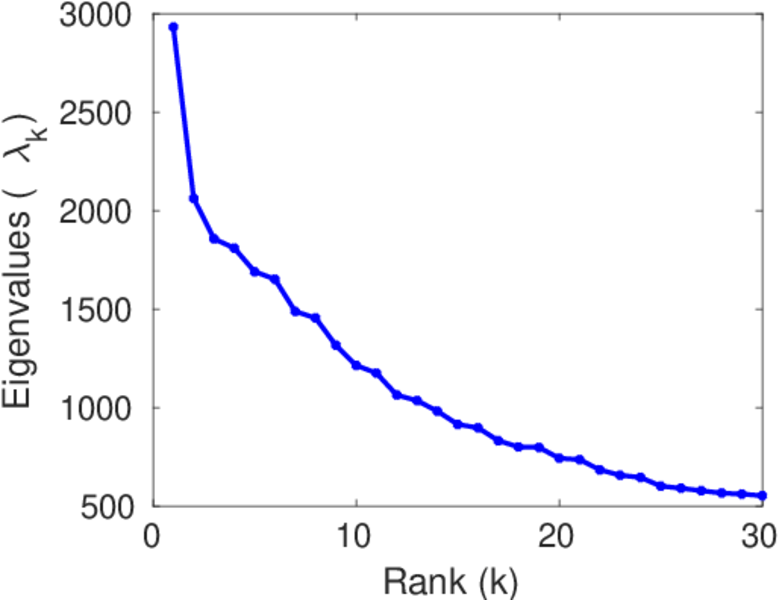
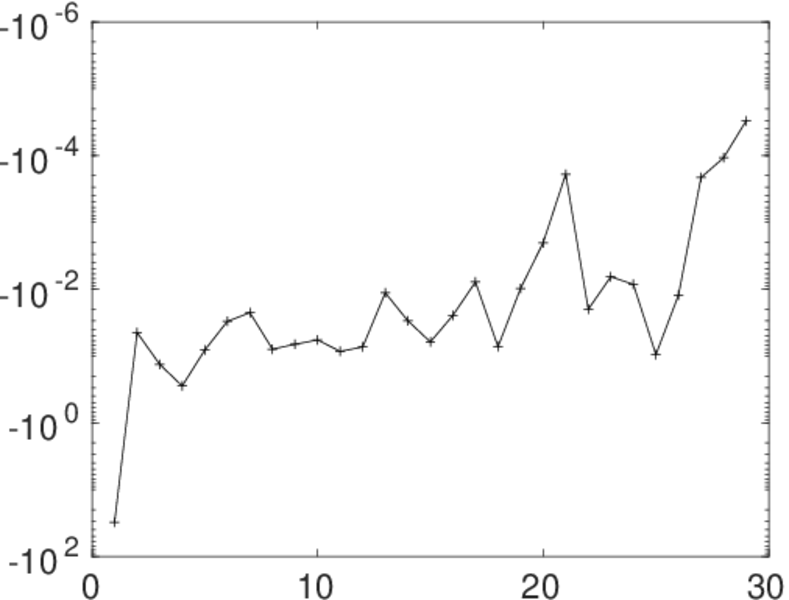
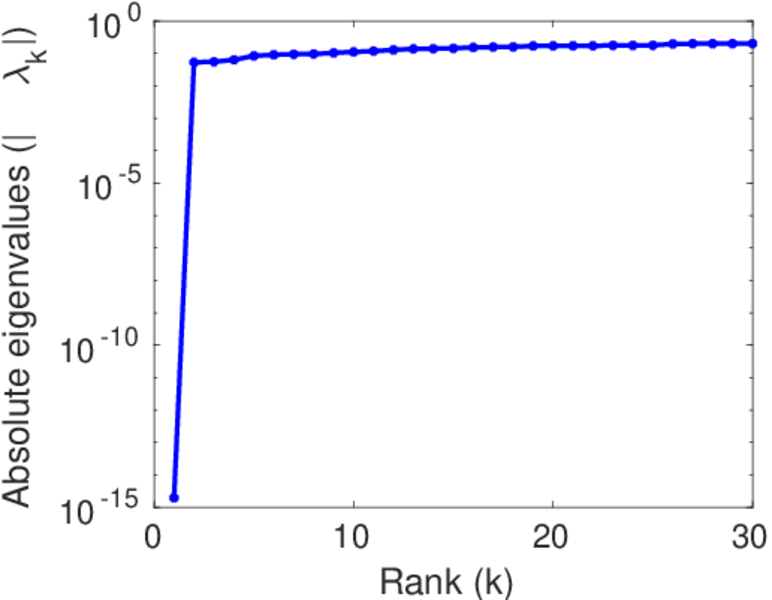
Matrix decompositions plots


Downloads
References
|
[1]
|
Jérôme Kunegis.
KONECT – The Koblenz Network Collection.
In Proc. Int. Conf. on World Wide Web Companion, pages
1343–1350, 2013.
[ http ]
|
|
[2]
|
Wikimedia Foundation.
Wikimedia downloads.
http://dumps.wikimedia.org/, January 2010.
|
 KONECT ‣ Networks ‣
Buy Me a Coffee
KONECT ‣ Networks ‣
Buy Me a Coffee