Wiktionary edits (mg)
This is the bipartite edit network of the Malagasy Wiktionary. It contains
users and pages from the Malagasy Wiktionary, connected by edit events. Each
edge represents an edit. The dataset includes the timestamp of each edit.
Metadata
Statistics
| Size | n = | 4,064,239
|
| Left size | n1 = | 605
|
| Right size | n2 = | 4,063,634
|
| Volume | m = | 22,720,139
|
| Unique edge count | m̿ = | 8,826,281
|
| Wedge count | s = | 11,305,885,983,027
|
| Cross count | x = | 1.200 46 × 1025
|
| Maximum degree | dmax = | 17,070,942
|
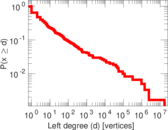
| Maximum left degree | d1max = | 17,070,942
|
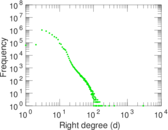
| Maximum right degree | d2max = | 2,958
|
| Average degree | d = | 11.180 5
|
| Average left degree | d1 = | 37,553.9
|
| Average right degree | d2 = | 5.591 09
|
| Fill | p = | 0.003 590 11
|
| Average edge multiplicity | m̃ = | 2.574 15
|
| Size of LCC | N = | 4,063,962
|
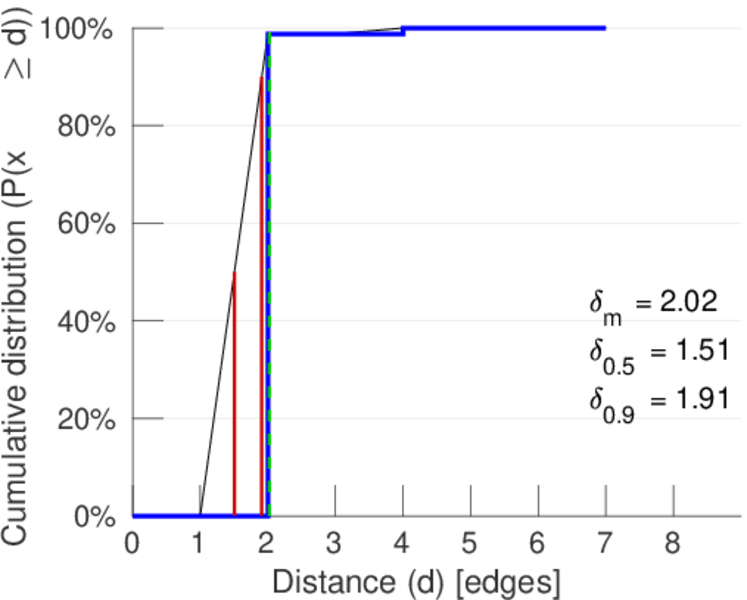
| Diameter | δ = | 12
|
| 50-Percentile effective diameter | δ0.5 = | 1.506 28
|
| 90-Percentile effective diameter | δ0.9 = | 1.911 31
|
| Median distance | δM = | 2
|
| Mean distance | δm = | 2.024 81
|
| Gini coefficient | G = | 0.644 620
|
| Balanced inequality ratio | P = | 0.262 754
|
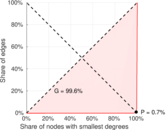
| Left balanced inequality ratio | P1 = | 0.006 783 89
|
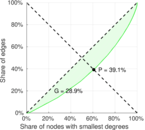
| Right balanced inequality ratio | P2 = | 0.390 843
|
| Relative edge distribution entropy | Her = | 0.593 797
|
| Power law exponent | γ = | 2.513 32
|
| Tail power law exponent | γt = | 6.981 00
|
| Degree assortativity | ρ = | −0.472 070
|
| Degree assortativity p-value | pρ = | 0.000 00
|
| Spectral norm | α = | 11,087.1
|
| Spectral separation | |λ1[A] / λ2[A]| = | 6.653 42
|
| Controllability | C = | 4,063,060
|
| Relative controllability | Cr = | 0.999 722
|
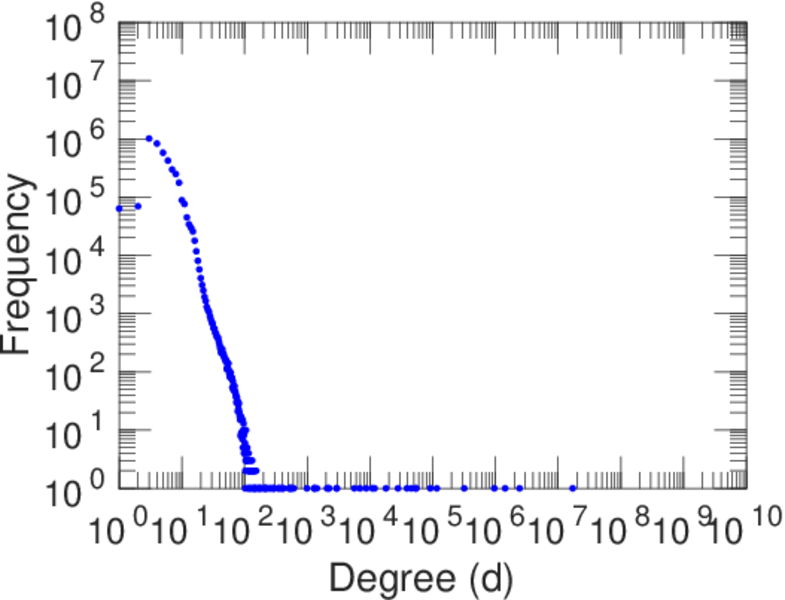
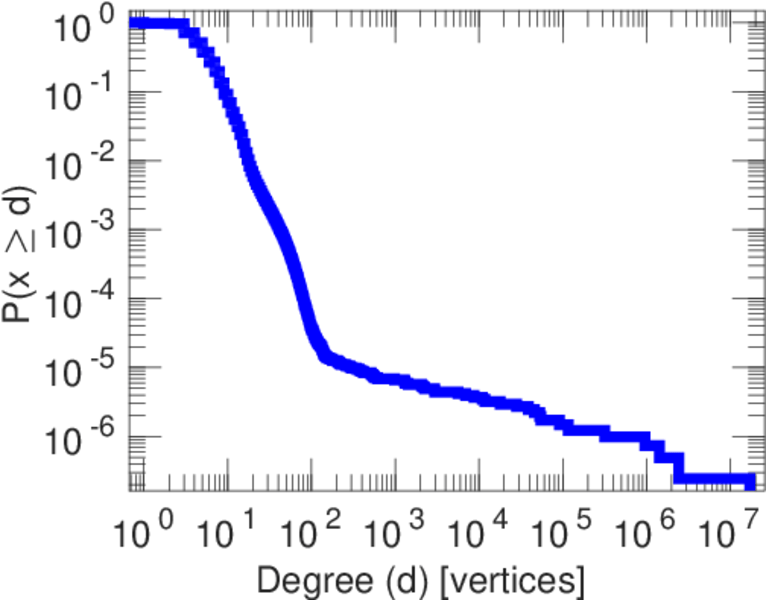
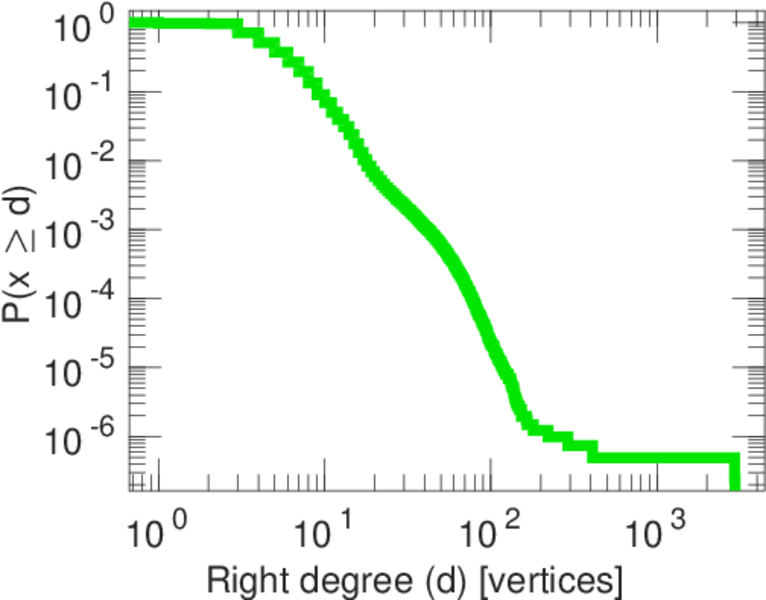
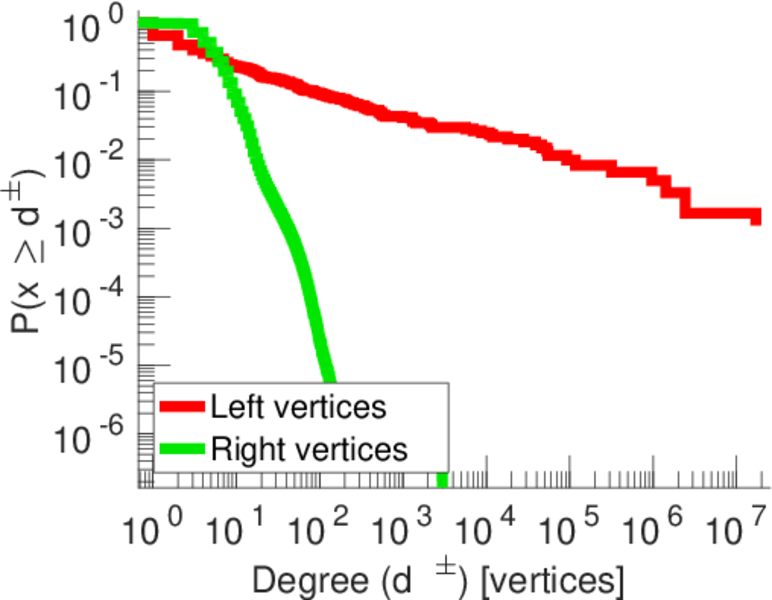
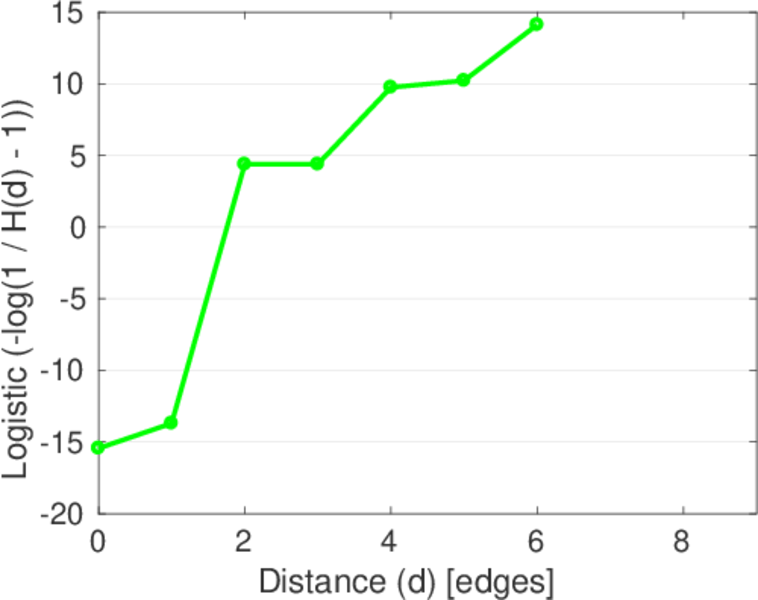
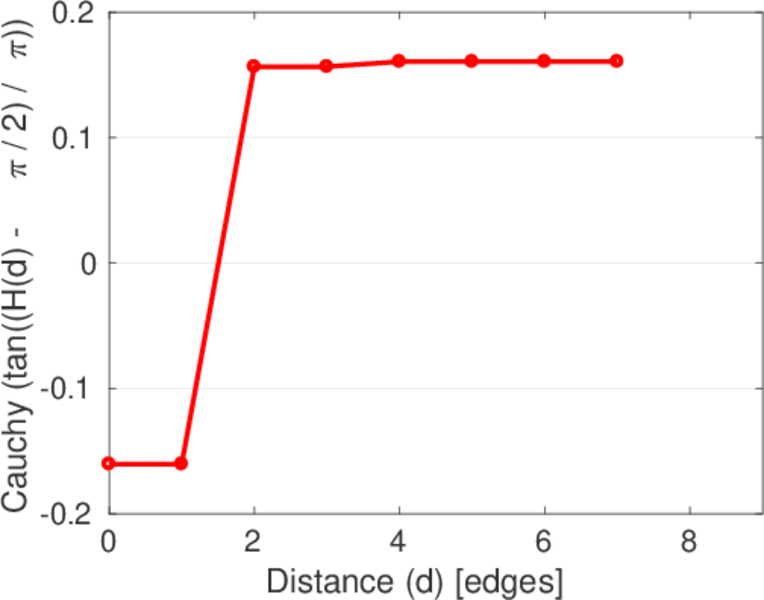
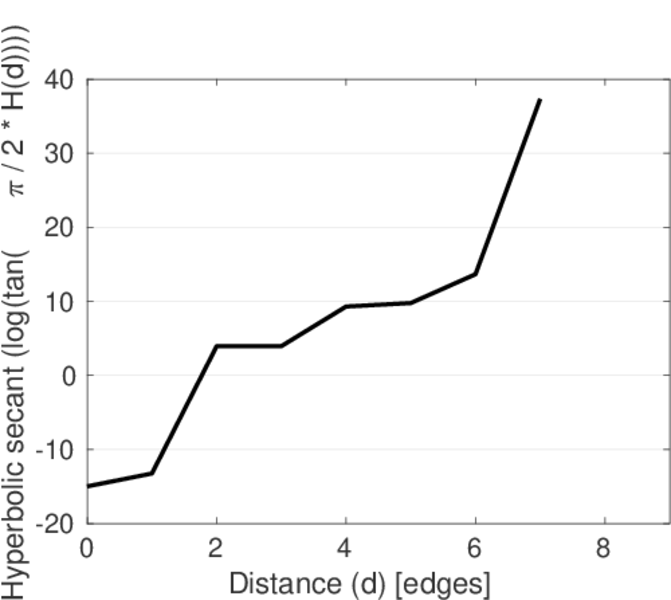
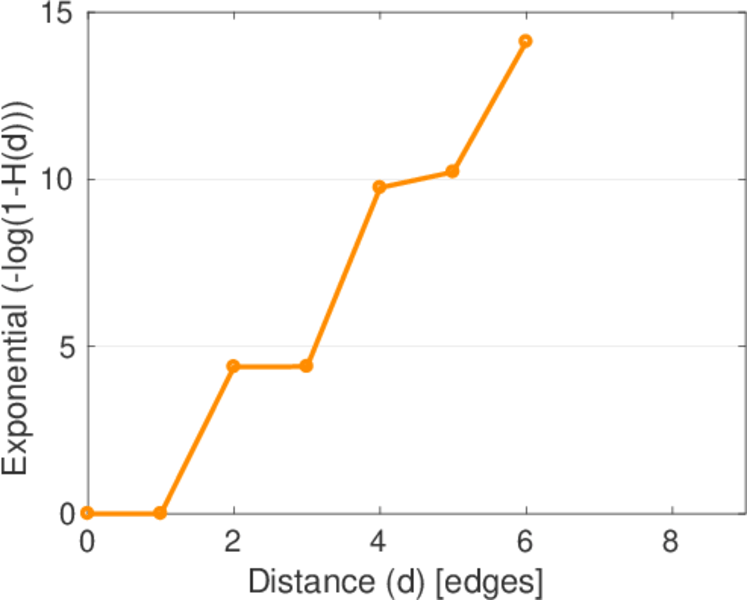
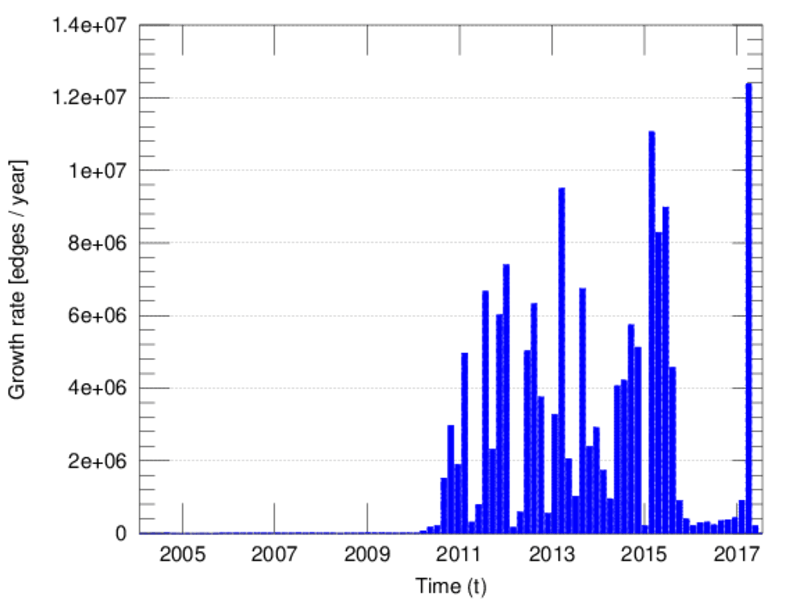
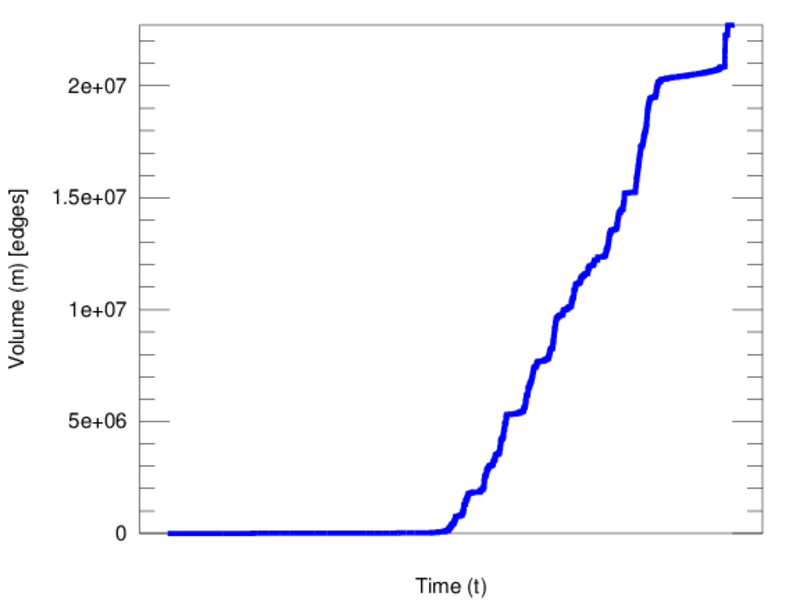
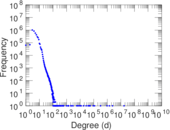
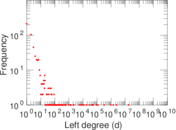
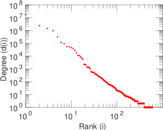
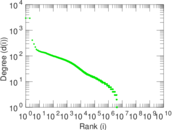
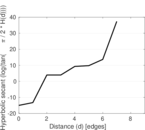
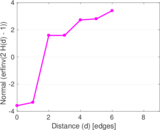
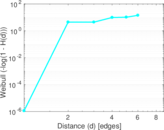
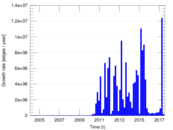
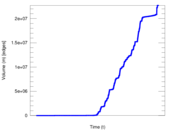
Plots


Downloads
References
|
[1]
|
Jérôme Kunegis.
KONECT – The Koblenz Network Collection.
In Proc. Int. Conf. on World Wide Web Companion, pages
1343–1350, 2013.
[ http ]
|
|
[2]
|
Wikimedia Foundation.
Wikimedia downloads.
http://dumps.wikimedia.org/, January 2010.
|
 KONECT ‣ Networks ‣
Buy Me a Coffee
KONECT ‣ Networks ‣
Buy Me a Coffee