Wikipedia edits (no)
This is the bipartite edit network of the Norwegian Wikipedia. It contains
users and pages from the Norwegian Wikipedia, connected by edit events. Each
edge represents an edit. The dataset includes the timestamp of each edit.
Metadata
Statistics
| Size | n = | 1,340,021
|
| Left size | n1 = | 115,666
|
| Right size | n2 = | 1,224,355
|
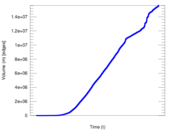
| Volume | m = | 15,620,508
|
| Unique edge count | m̿ = | 8,032,077
|
| Wedge count | s = | 371,989,182,099
|
| Claw count | z = | 33,412,508,809,572,236
|
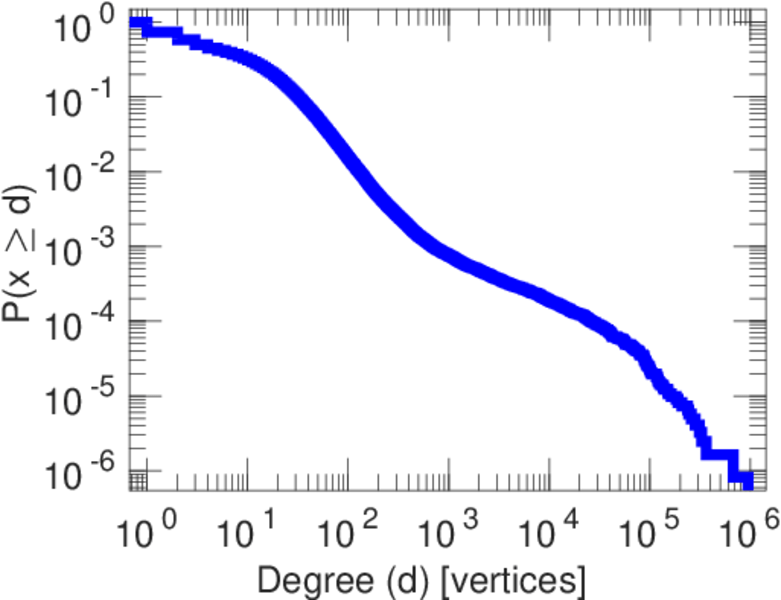
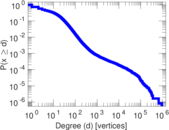
| Maximum degree | dmax = | 945,682
|
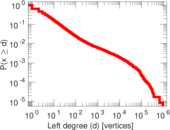
| Maximum left degree | d1max = | 945,682
|
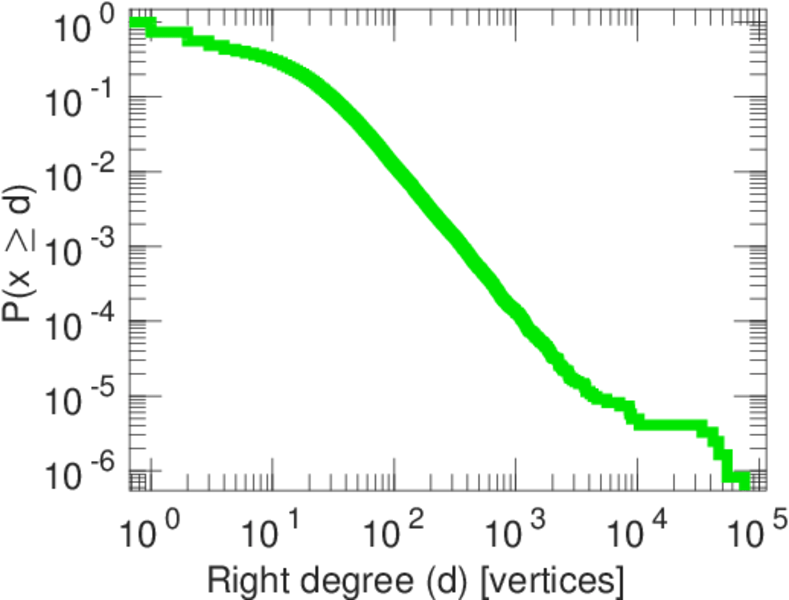
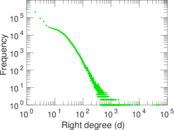
| Maximum right degree | d2max = | 75,915
|
| Average degree | d = | 23.313 8
|
| Average left degree | d1 = | 135.048
|
| Average right degree | d2 = | 12.758 2
|
| Fill | p = | 5.671 72 × 10−5
|
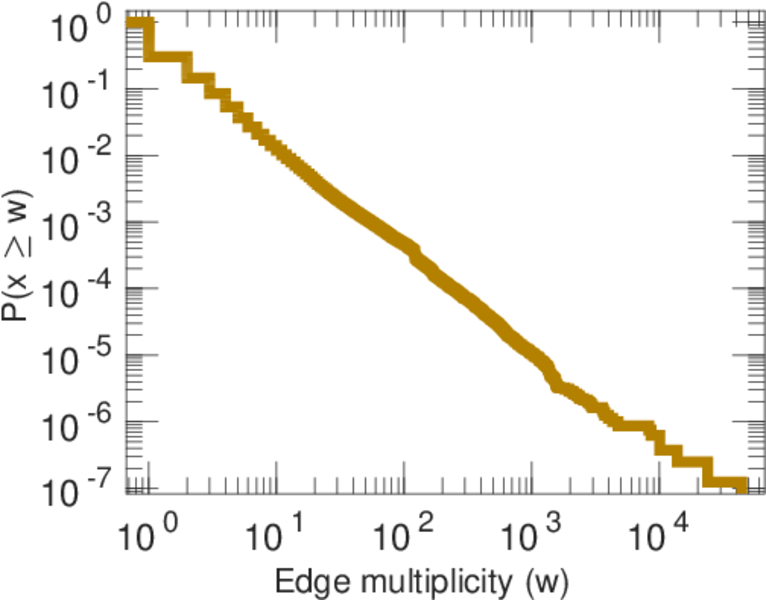
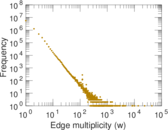
| Average edge multiplicity | m̃ = | 1.944 77
|
| Size of LCC | N = | 1,326,500
|
| Diameter | δ = | 11
|
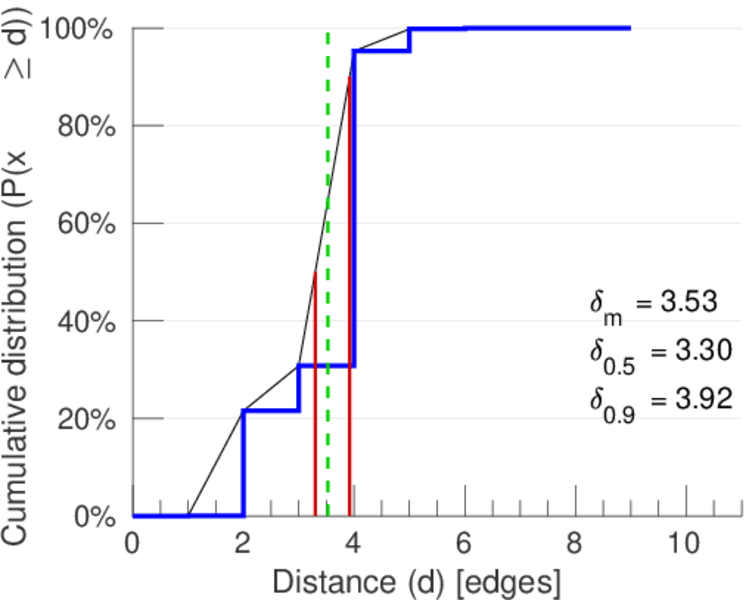
| 50-Percentile effective diameter | δ0.5 = | 3.298 18
|
| 90-Percentile effective diameter | δ0.9 = | 3.918 54
|
| Median distance | δM = | 4
|
| Mean distance | δm = | 3.526 60
|
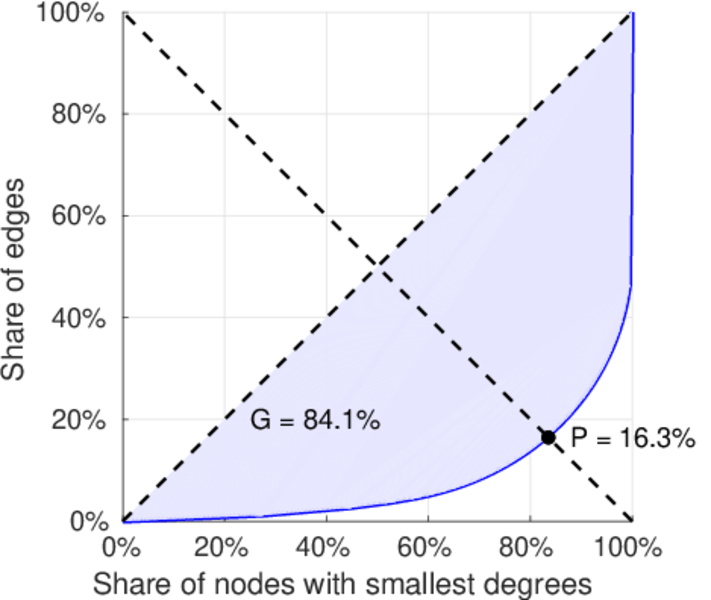
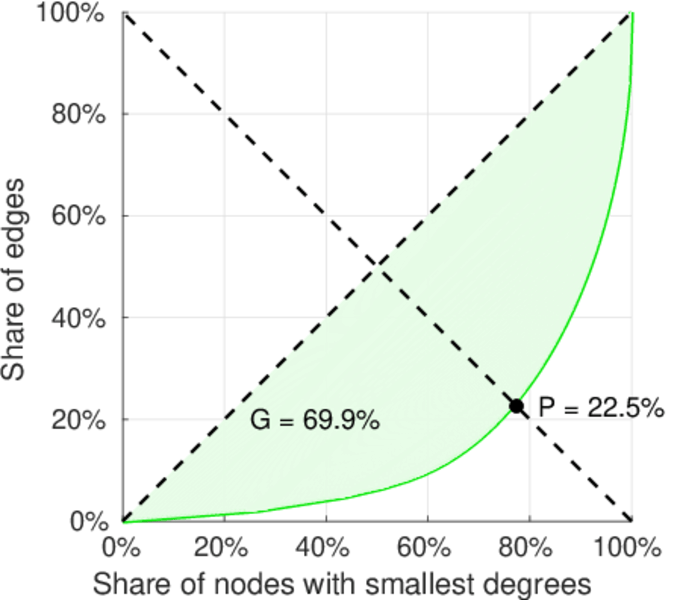
| Gini coefficient | G = | 0.841 874
|
| Balanced inequality ratio | P = | 0.164 293
|
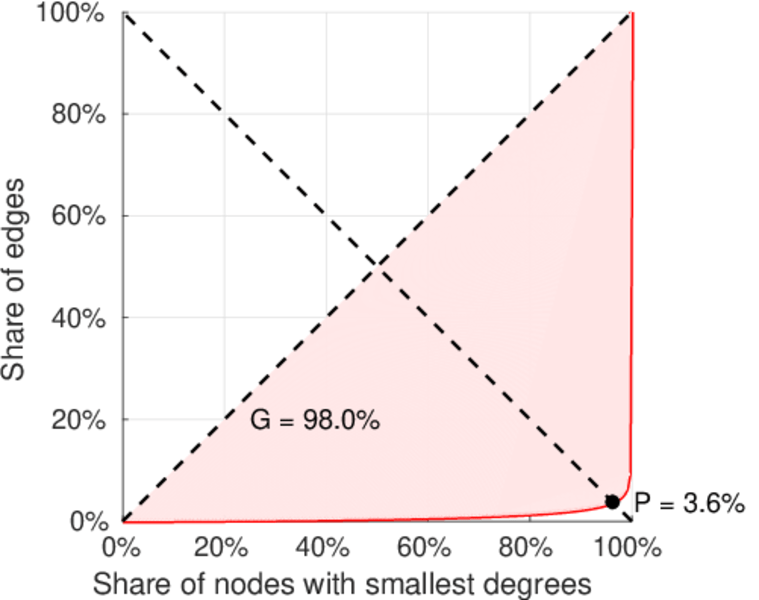
| Left balanced inequality ratio | P1 = | 0.036 127 4
|
| Right balanced inequality ratio | P2 = | 0.224 579
|
| Relative edge distribution entropy | Her = | 0.726 600
|
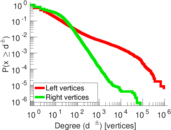
| Power law exponent | γ = | 1.876 63
|
| Degree assortativity | ρ = | −0.115 580
|
| Degree assortativity p-value | pρ = | 0.000 00
|
| Spectral norm | α = | 52,871.7
|
| Algebraic connectivity | a = | 0.017 284 8
|
| Controllability | C = | 1,169,397
|
| Relative controllability | Cr = | 0.875 681
|
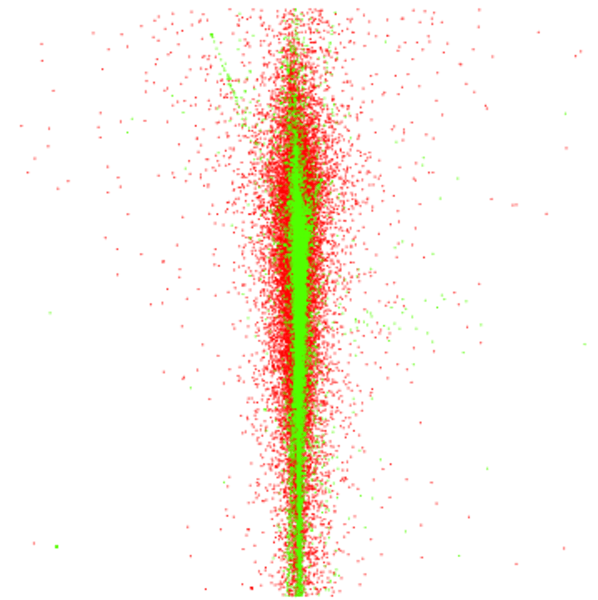
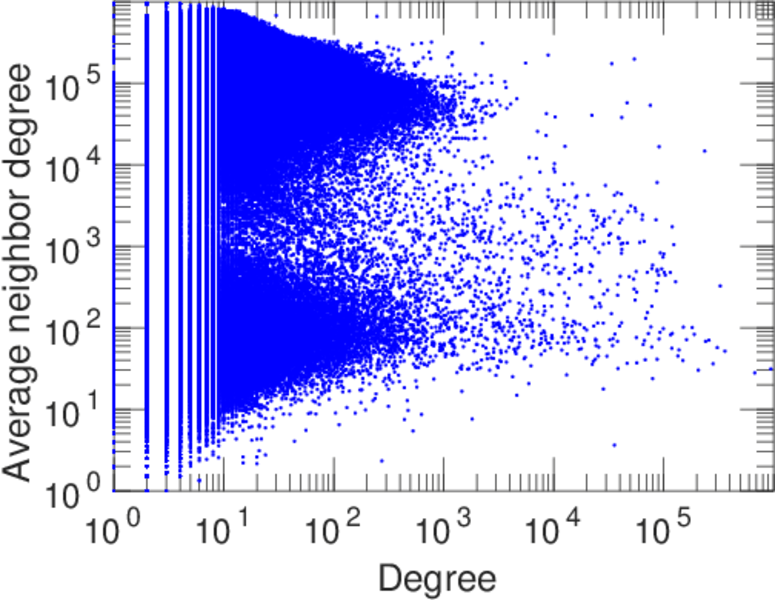
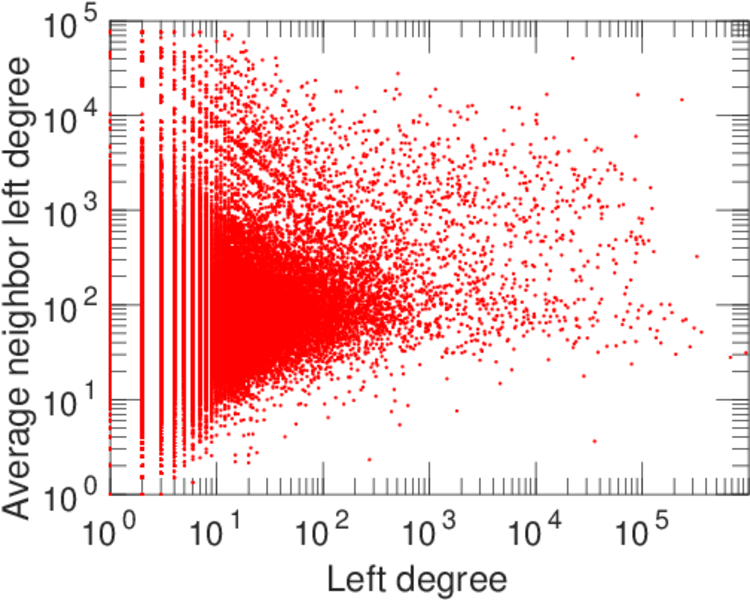
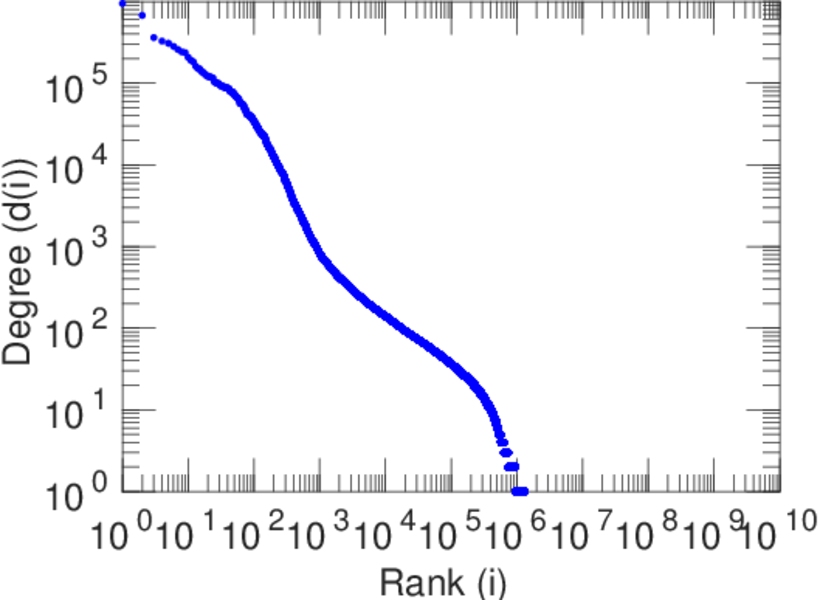
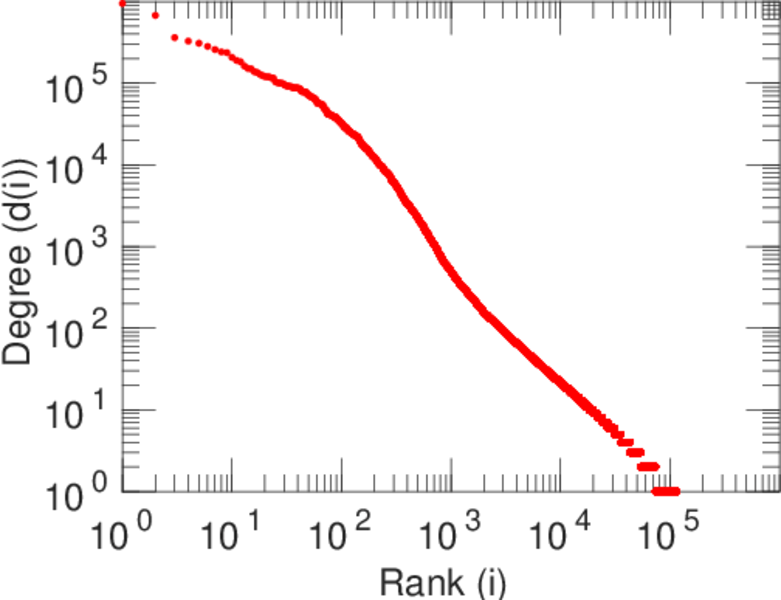
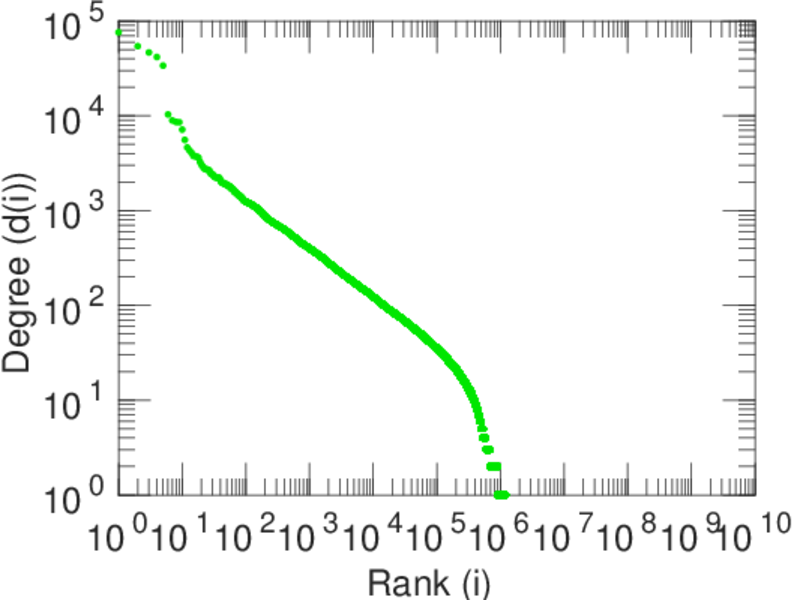
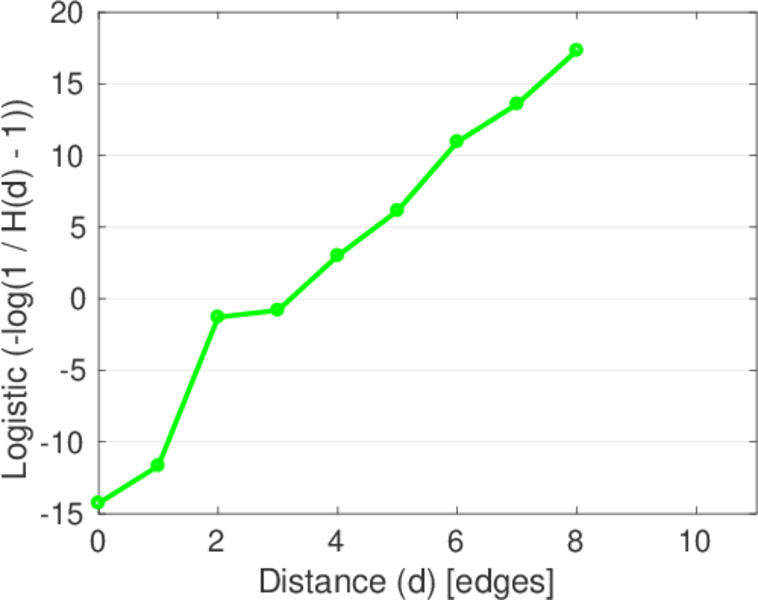
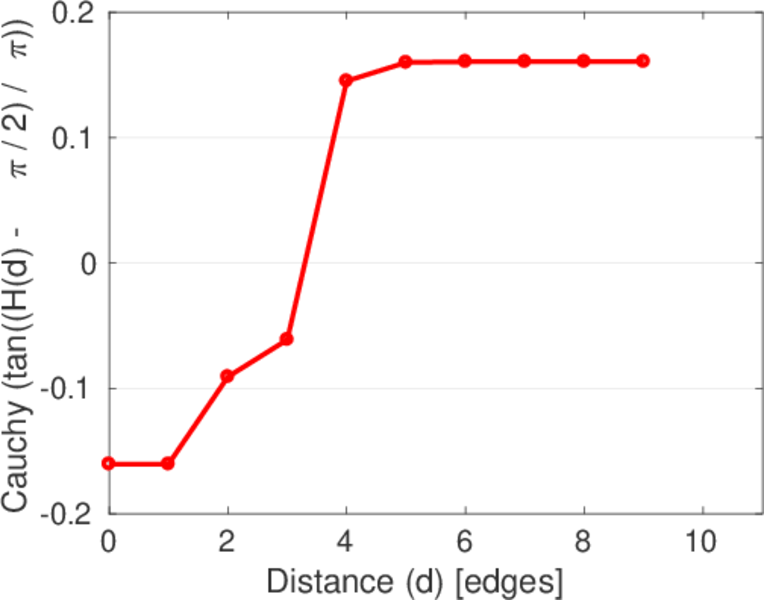
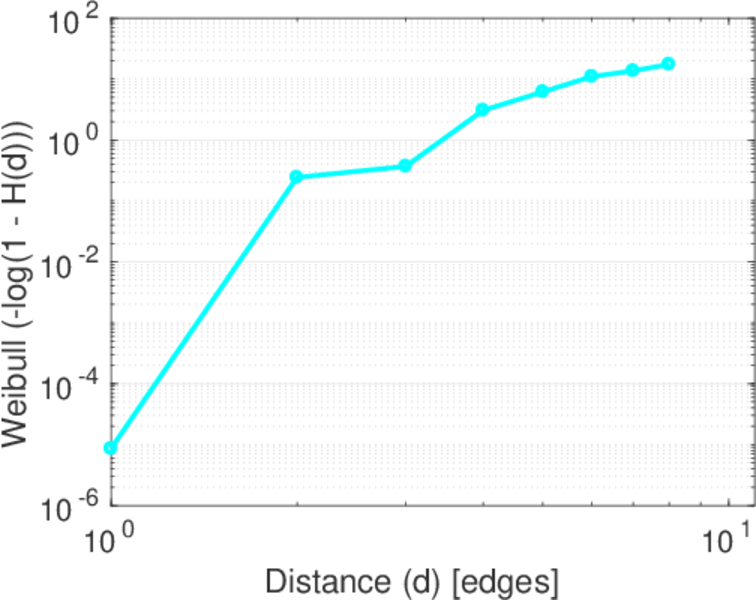
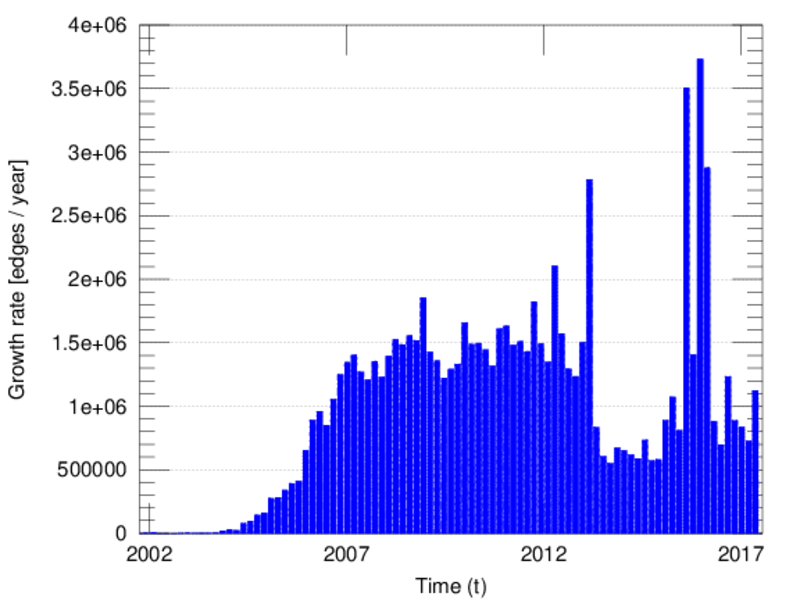
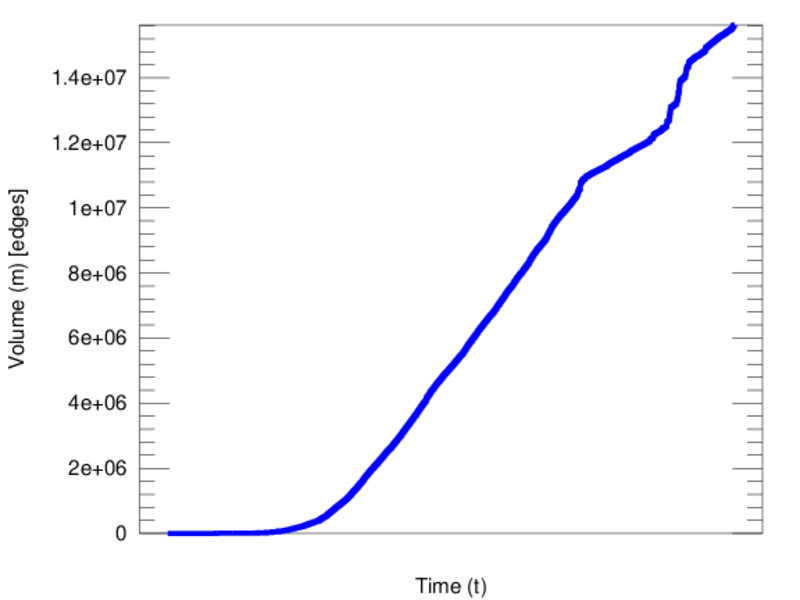
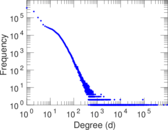
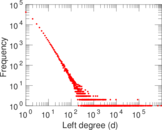
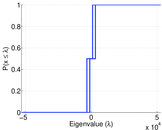
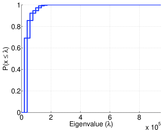
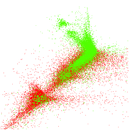
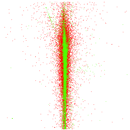
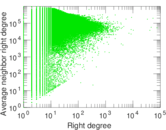
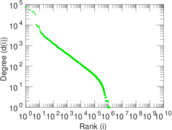
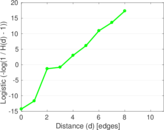
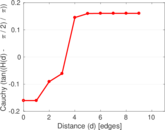
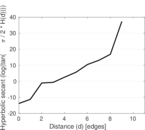
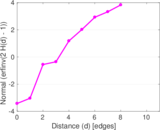
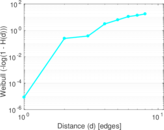
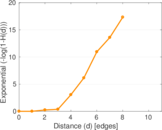
Plots


Downloads
References
|
[1]
|
Jérôme Kunegis.
KONECT – The Koblenz Network Collection.
In Proc. Int. Conf. on World Wide Web Companion, pages
1343–1350, 2013.
[ http ]
|
|
[2]
|
Wikimedia Foundation.
Wikimedia downloads.
http://dumps.wikimedia.org/, January 2010.
|
 KONECT ‣ Networks ‣
Buy Me a Coffee
KONECT ‣ Networks ‣
Buy Me a Coffee