Wiktionary edits (pl)
This is the bipartite edit network of the Polish Wiktionary. It contains users
and pages from the Polish Wiktionary, connected by edit events. Each edge
represents an edit. The dataset includes the timestamp of each edit.
Metadata
Statistics
| Size | n = | 615,519
|
| Left size | n1 = | 3,824
|
| Right size | n2 = | 611,695
|
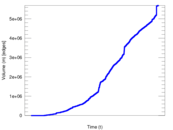
| Volume | m = | 5,696,069
|
| Unique edge count | m̿ = | 3,082,548
|
| Wedge count | s = | 316,078,421,056
|
| Claw count | z = | 40,177,218,711,700,384
|
| Cross count | x = | 4.319 04 × 1021
|
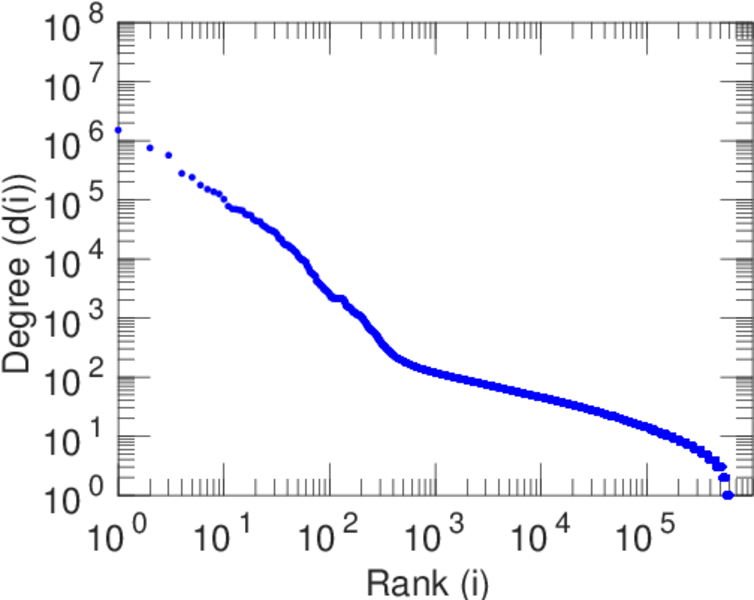
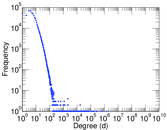
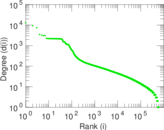
| Maximum degree | dmax = | 1,509,126
|
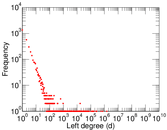
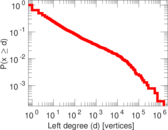
| Maximum left degree | d1max = | 1,509,126
|
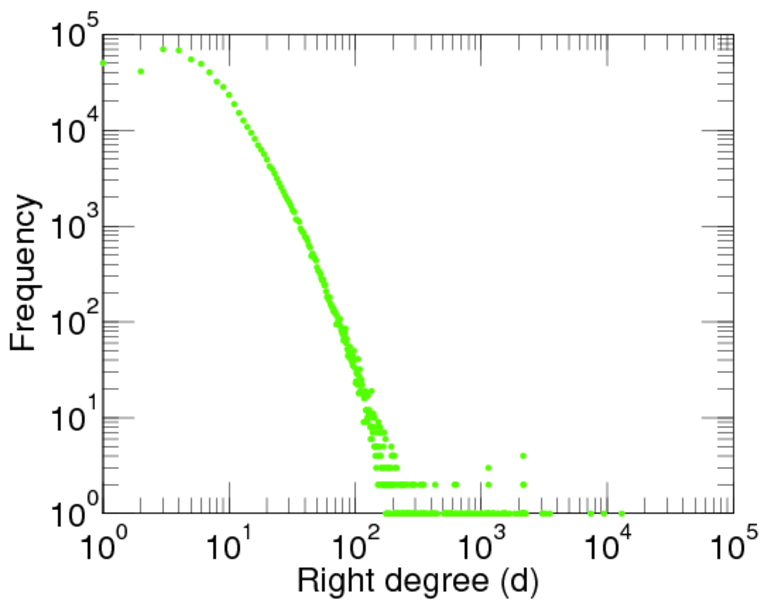
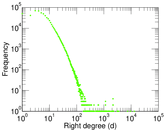
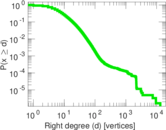
| Maximum right degree | d2max = | 13,058
|
| Average degree | d = | 18.508 2
|
| Average left degree | d1 = | 1,489.56
|
| Average right degree | d2 = | 9.311 94
|
| Fill | p = | 0.001 317 82
|
| Average edge multiplicity | m̃ = | 1.847 84
|
| Size of LCC | N = | 611,504
|
| Diameter | δ = | 11
|
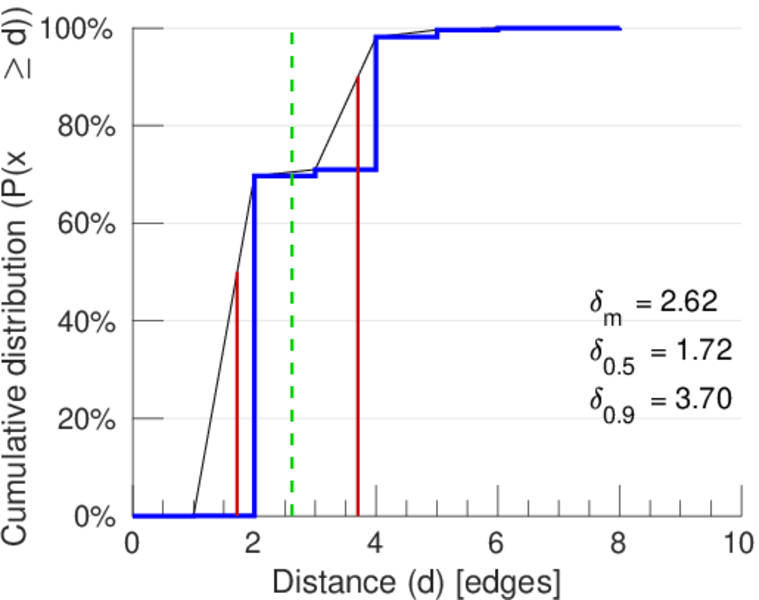
| 50-Percentile effective diameter | δ0.5 = | 1.717 91
|
| 90-Percentile effective diameter | δ0.9 = | 3.700 76
|
| Median distance | δM = | 2
|
| Mean distance | δm = | 2.616 40
|
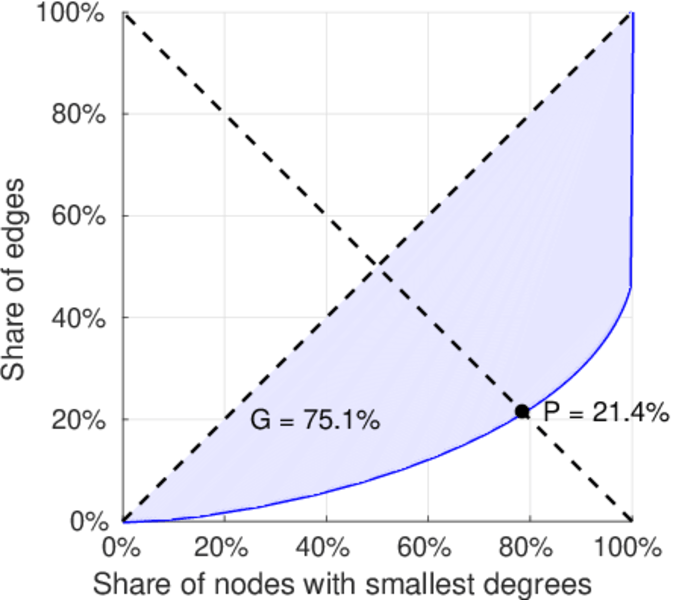
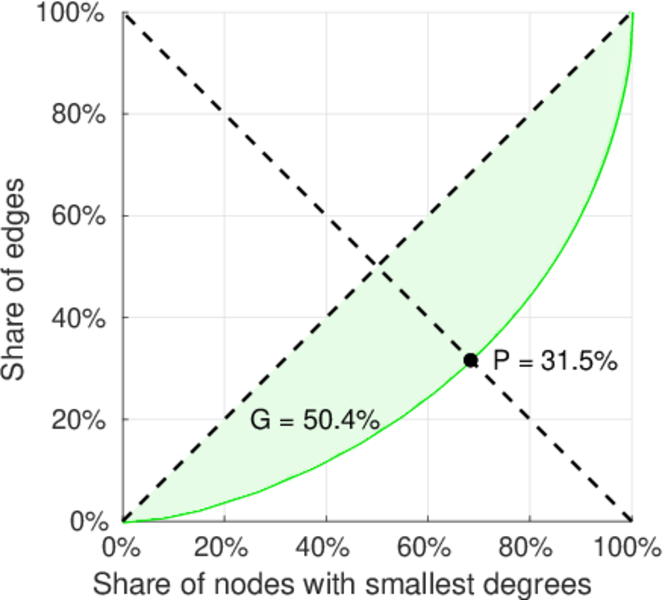
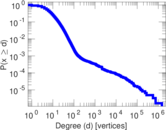
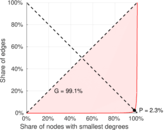
| Gini coefficient | G = | 0.751 855
|
| Balanced inequality ratio | P = | 0.213 730
|
| Left balanced inequality ratio | P1 = | 0.022 542 0
|
| Right balanced inequality ratio | P2 = | 0.314 914
|
| Relative edge distribution entropy | Her = | 0.676 104
|
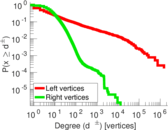
| Power law exponent | γ = | 1.732 38
|
| Tail power law exponent | γt = | 3.711 00
|
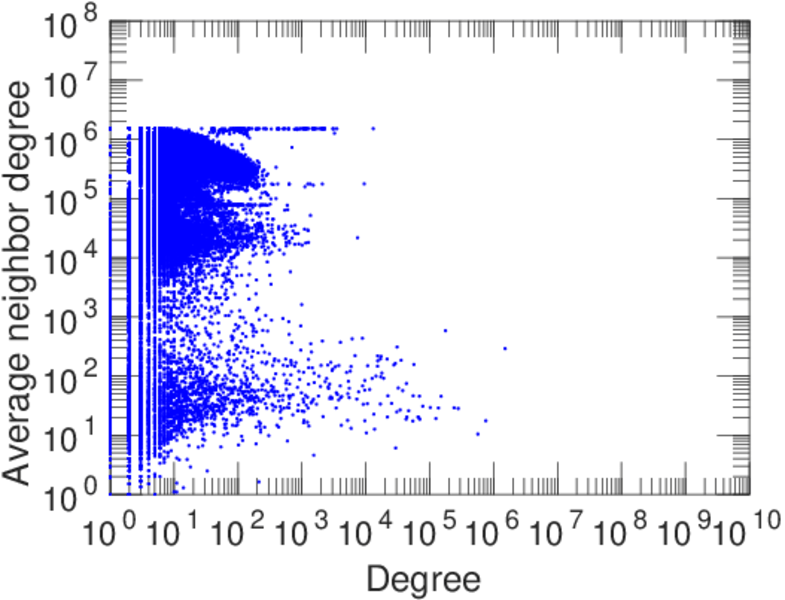
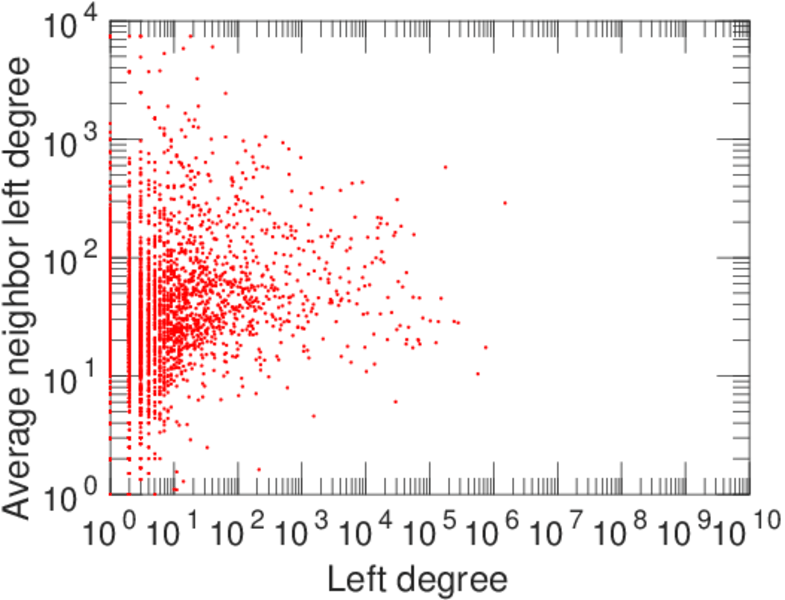
| Degree assortativity | ρ = | −0.273 845
|
| Degree assortativity p-value | pρ = | 0.000 00
|
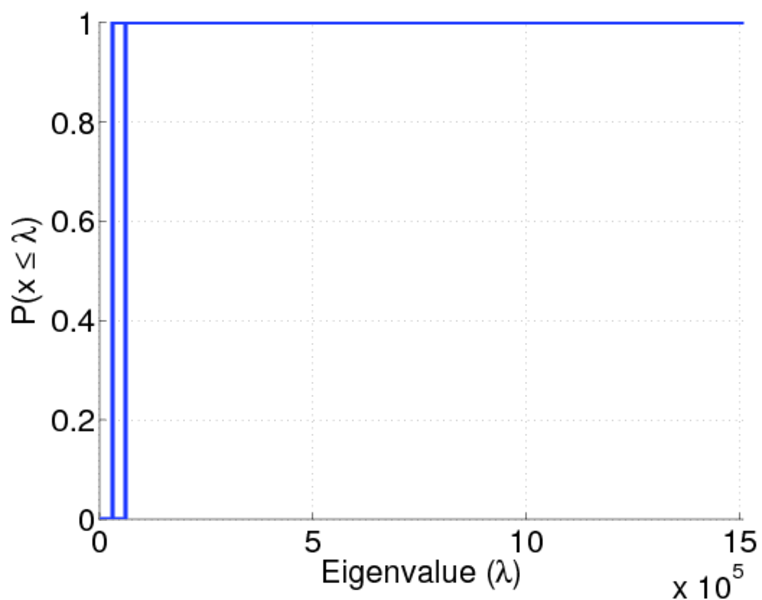
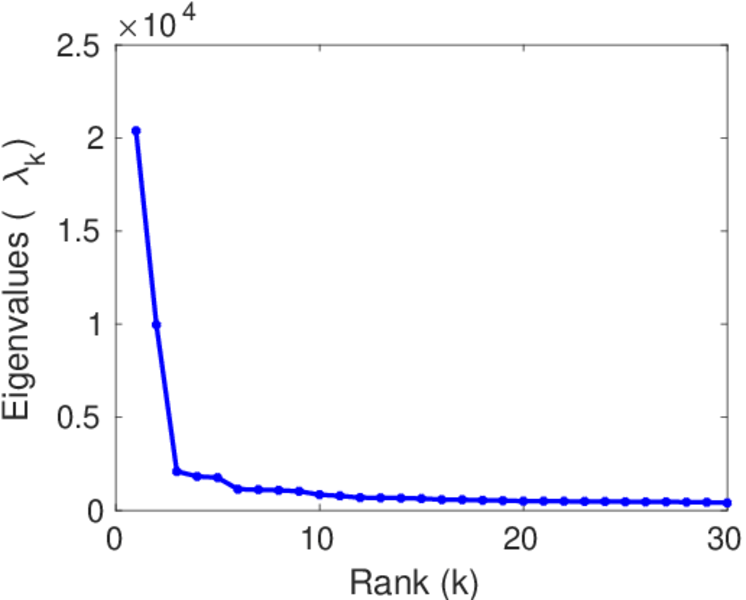
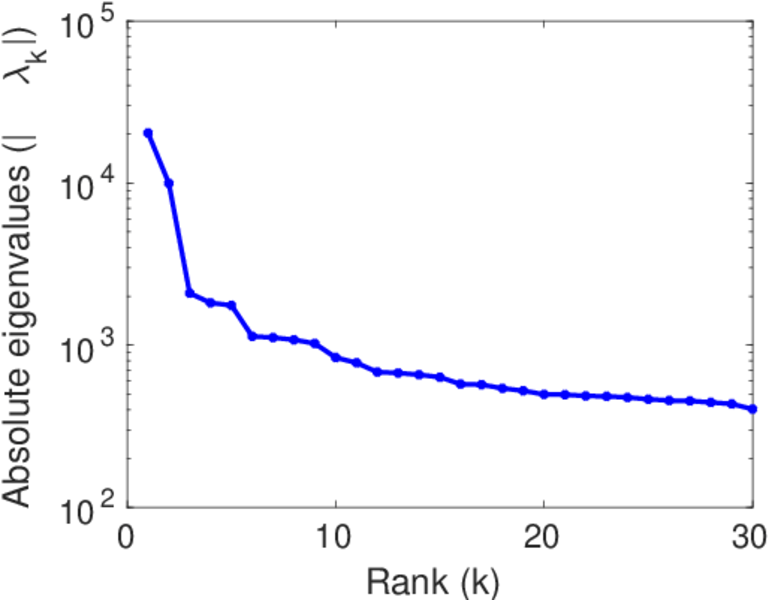
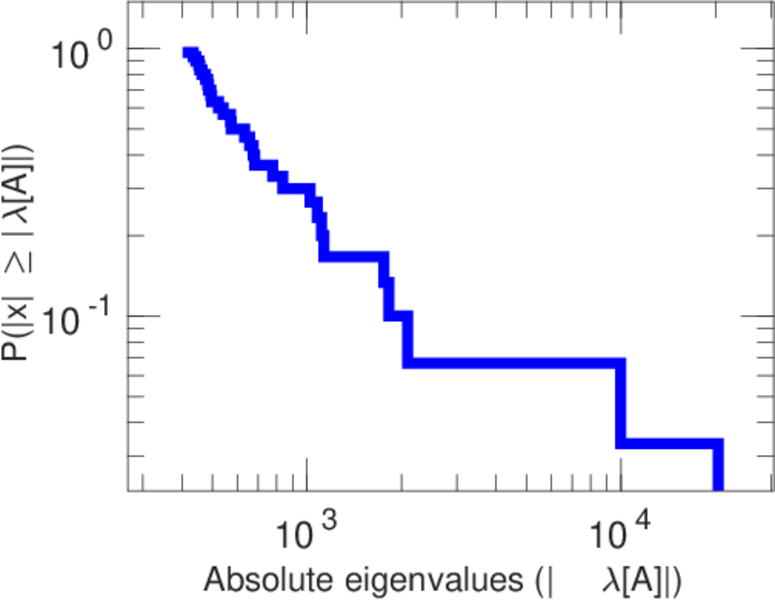
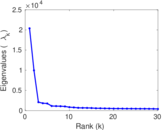
| Spectral norm | α = | 20,383.6
|
| Spectral separation | |λ1[A] / λ2[A]| = | 2.046 40
|
| Controllability | C = | 604,906
|
| Relative controllability | Cr = | 0.988 379
|
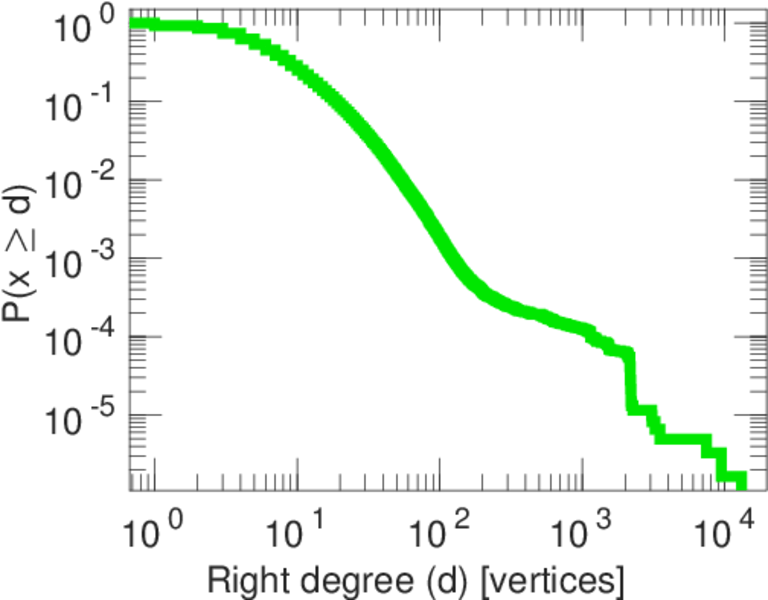
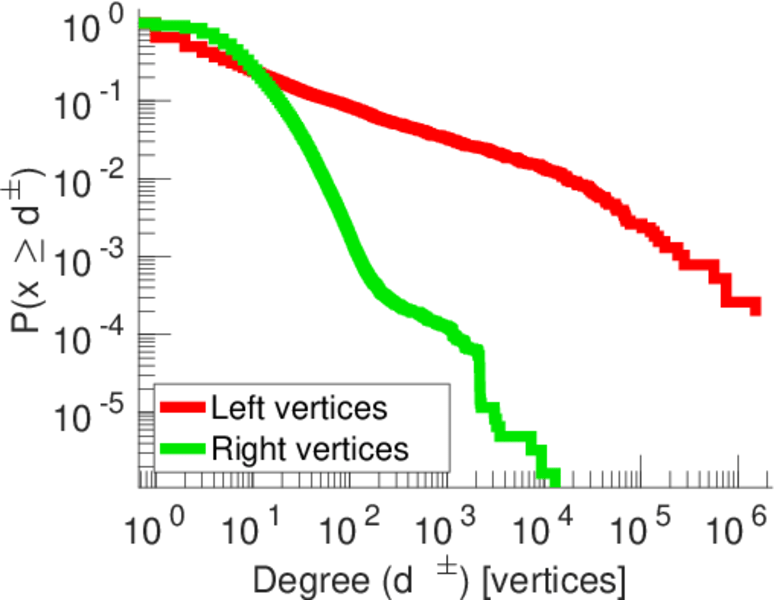
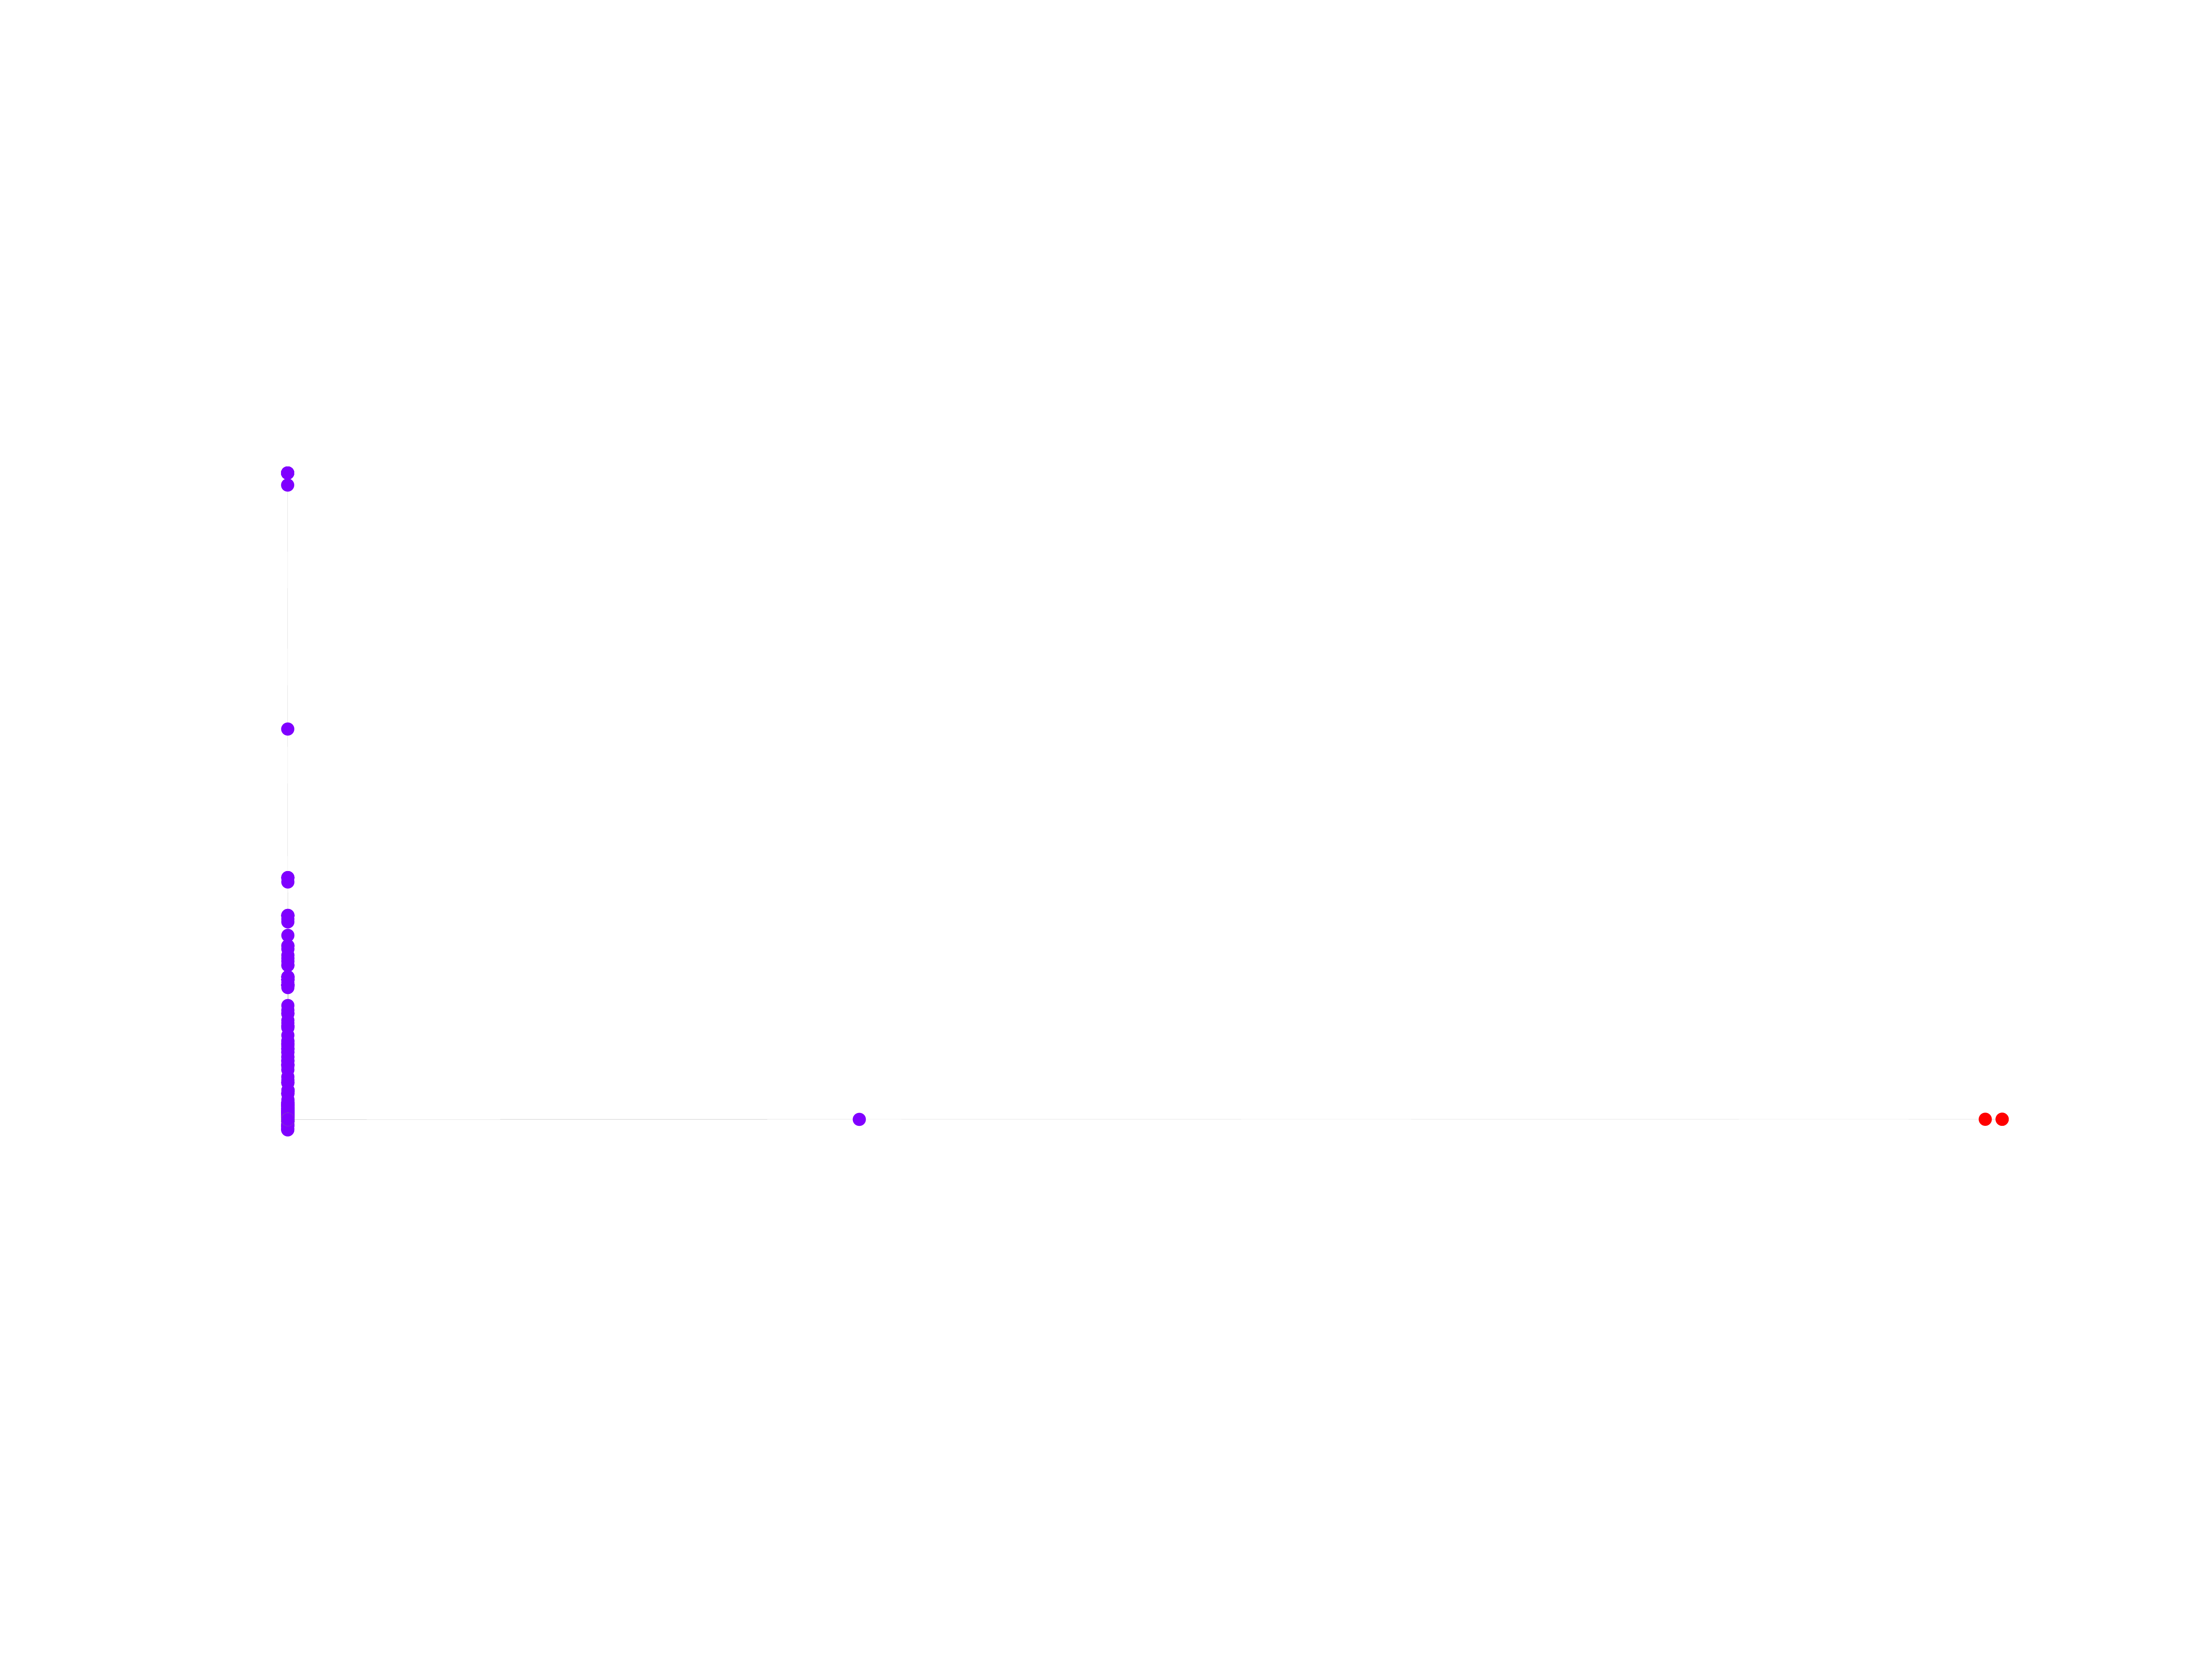
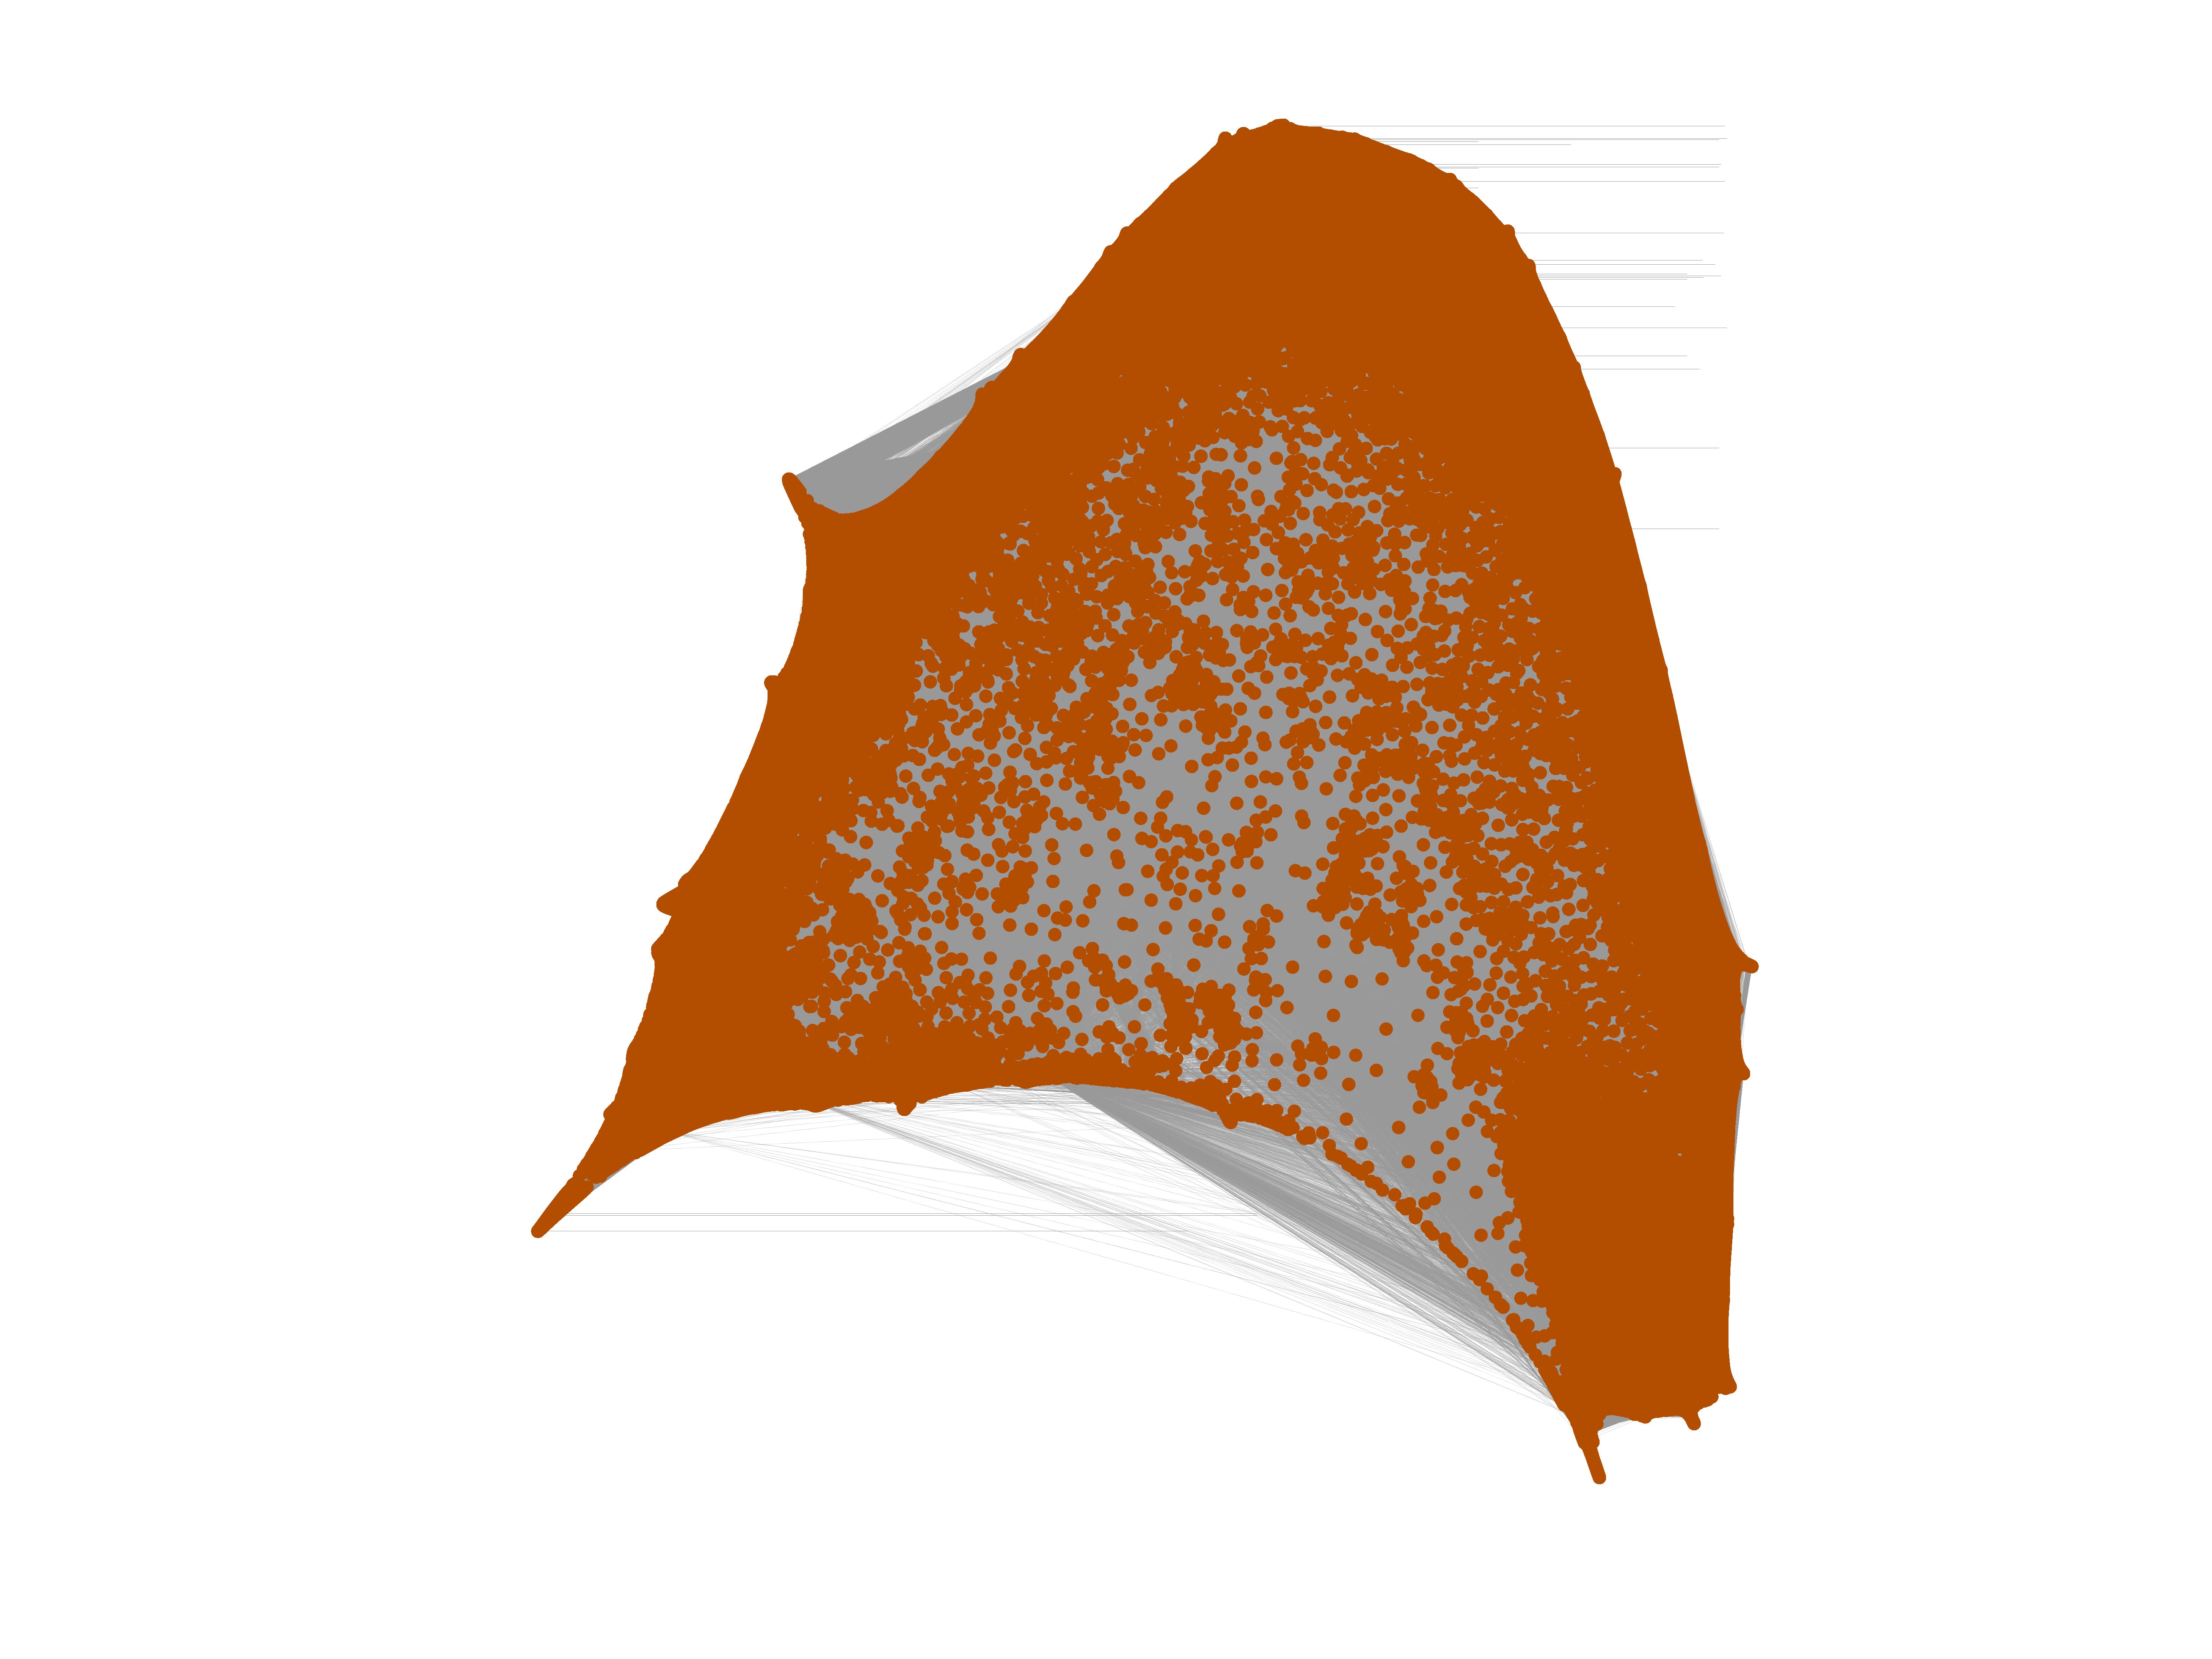
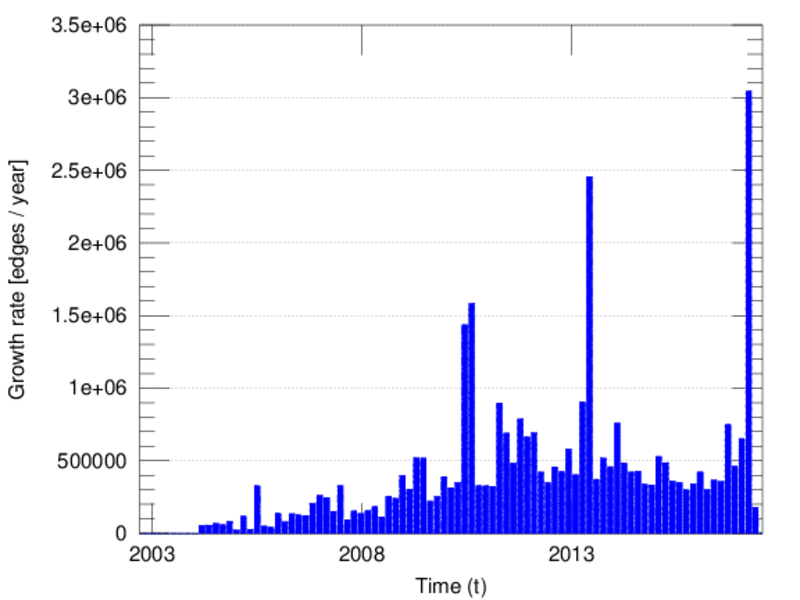
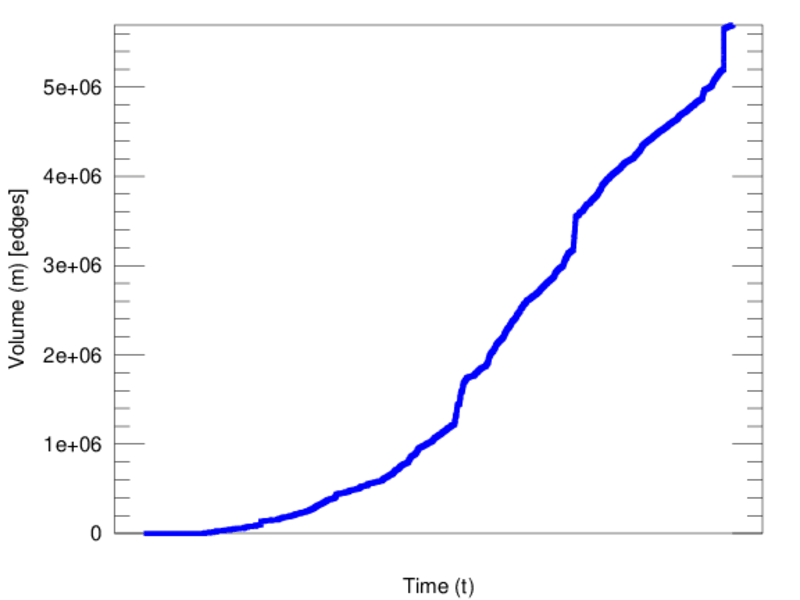
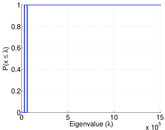
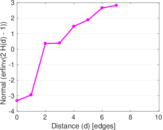
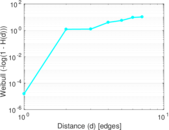
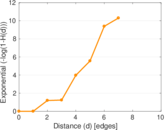
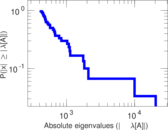
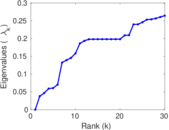
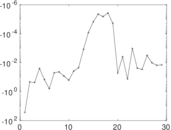
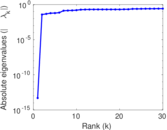
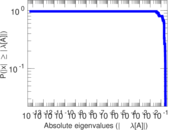
Plots


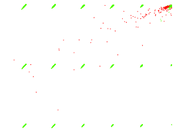


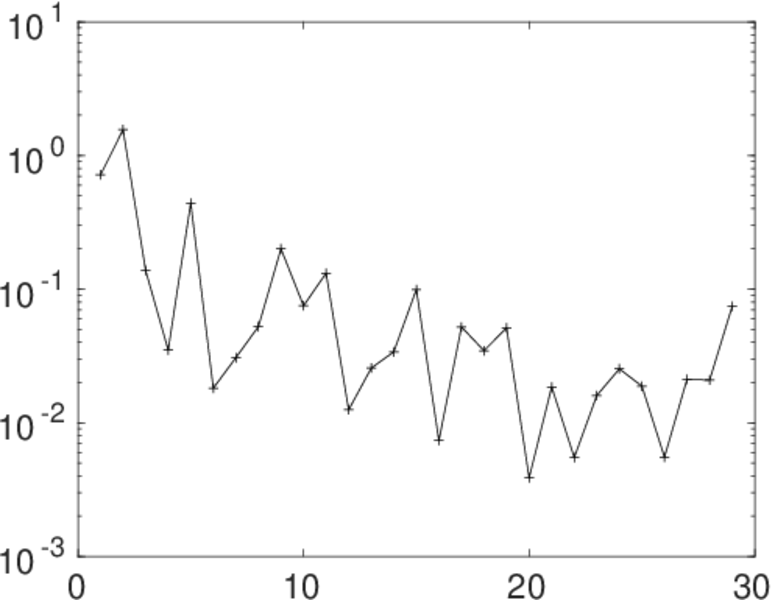
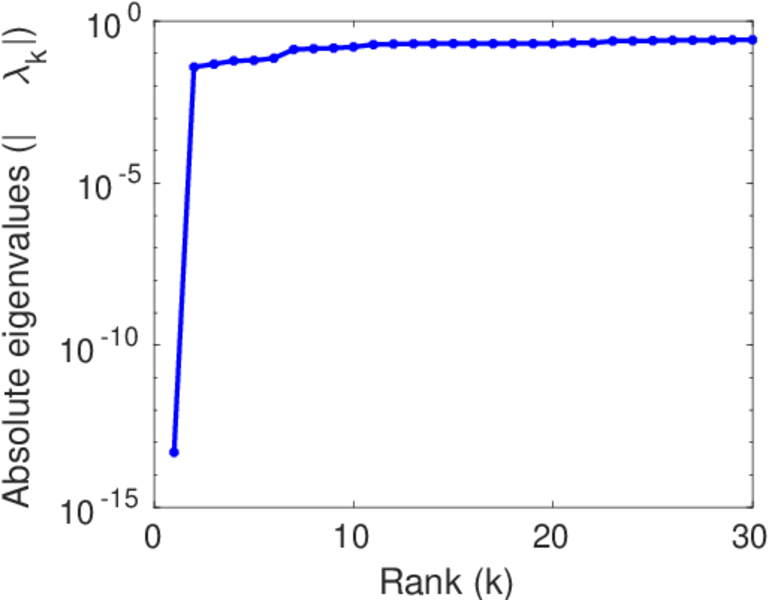
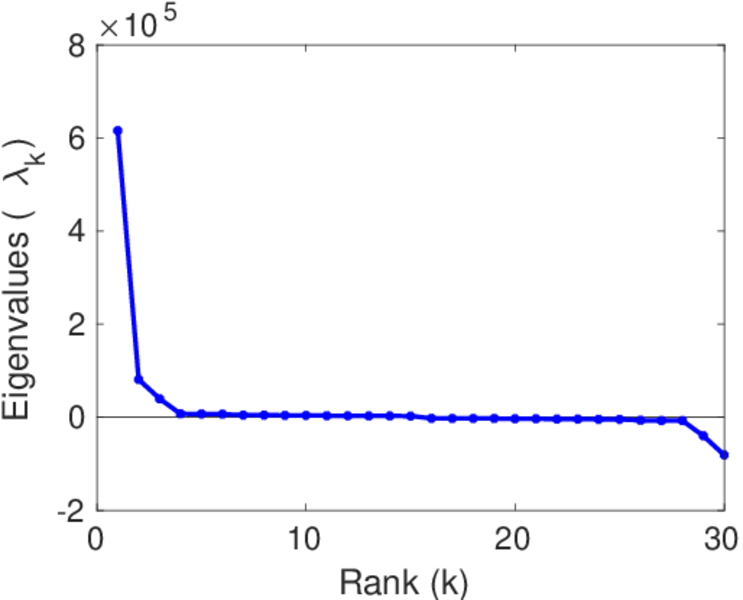
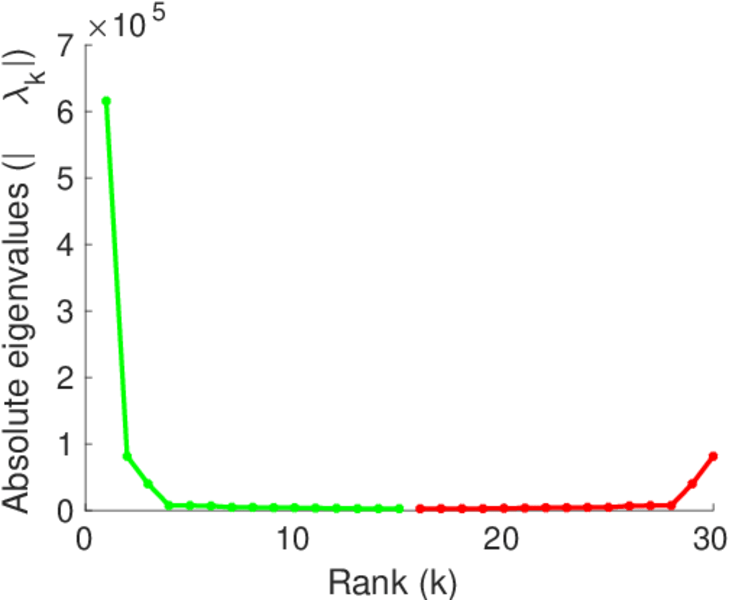
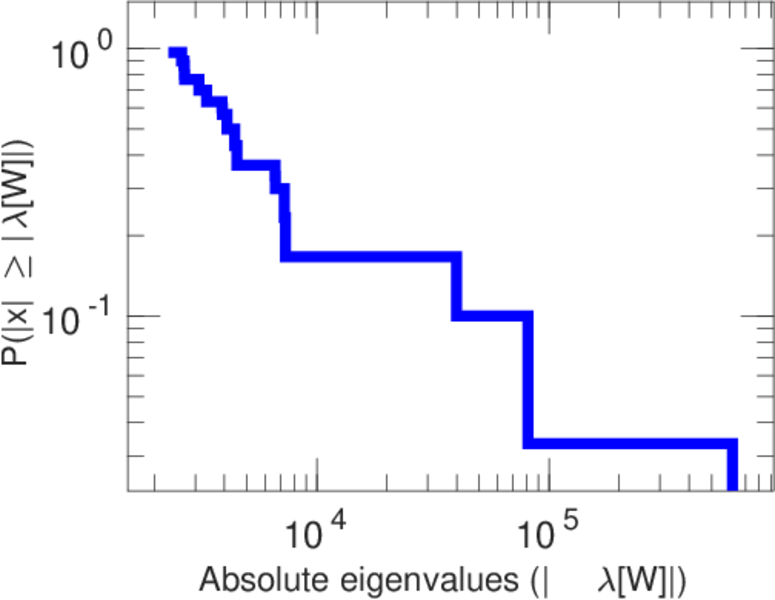
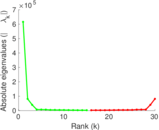
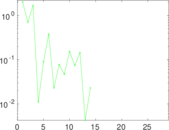
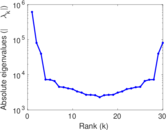
Matrix decompositions plots


Downloads
References
|
[1]
|
Jérôme Kunegis.
KONECT – The Koblenz Network Collection.
In Proc. Int. Conf. on World Wide Web Companion, pages
1343–1350, 2013.
[ http ]
|
|
[2]
|
Wikimedia Foundation.
Wikimedia downloads.
http://dumps.wikimedia.org/, January 2010.
|
 KONECT ‣ Networks ‣
Buy Me a Coffee
KONECT ‣ Networks ‣
Buy Me a Coffee