Wiktionary edits (ru)
This is the bipartite edit network of the Russian Wiktionary. It contains users
and pages from the Russian Wiktionary, connected by edit events. Each edge
represents an edit. The dataset includes the timestamp of each edit.
Metadata
Statistics
| Size | n = | 1,274,165
|
| Left size | n1 = | 7,816
|
| Right size | n2 = | 1,266,349
|
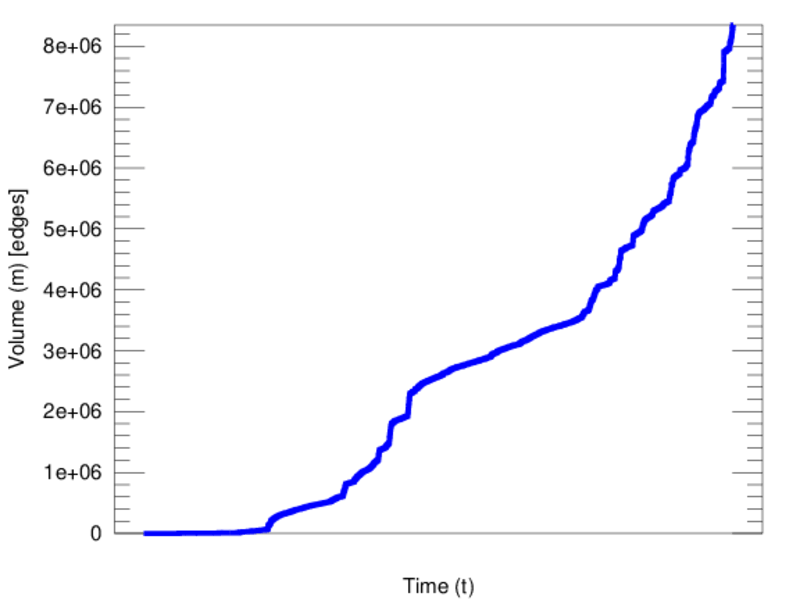
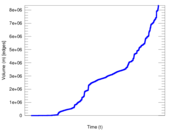
| Volume | m = | 8,349,235
|
| Unique edge count | m̿ = | 5,141,251
|
| Wedge count | s = | 728,798,250,699
|
| Claw count | z = | 110,862,892,396,361,168
|
| Cross count | x = | 1.482 55 × 1022
|
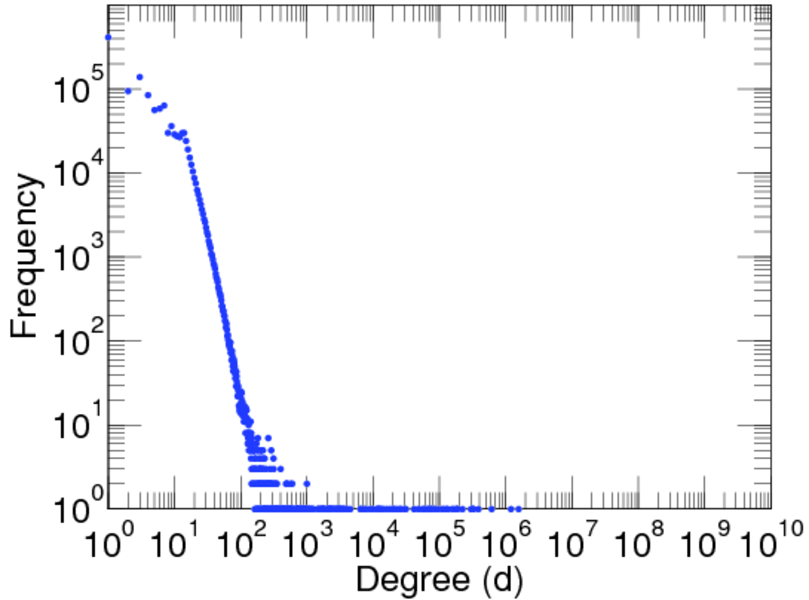
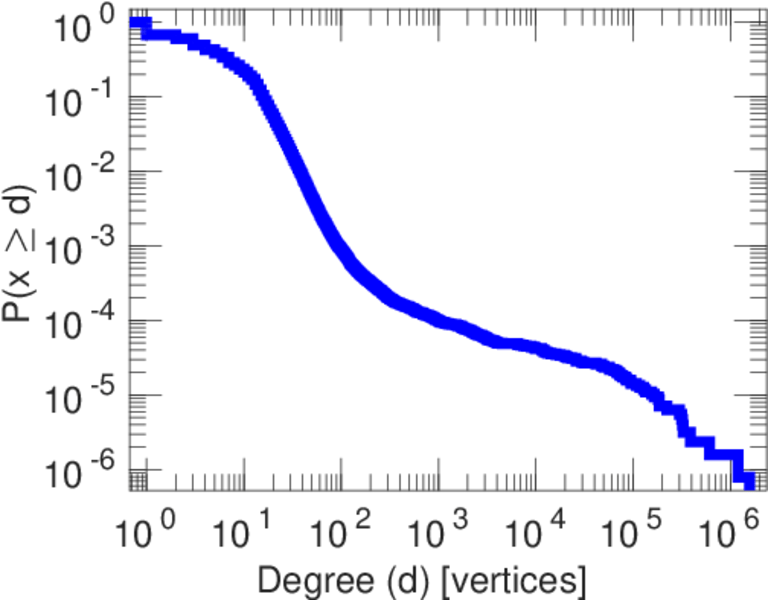
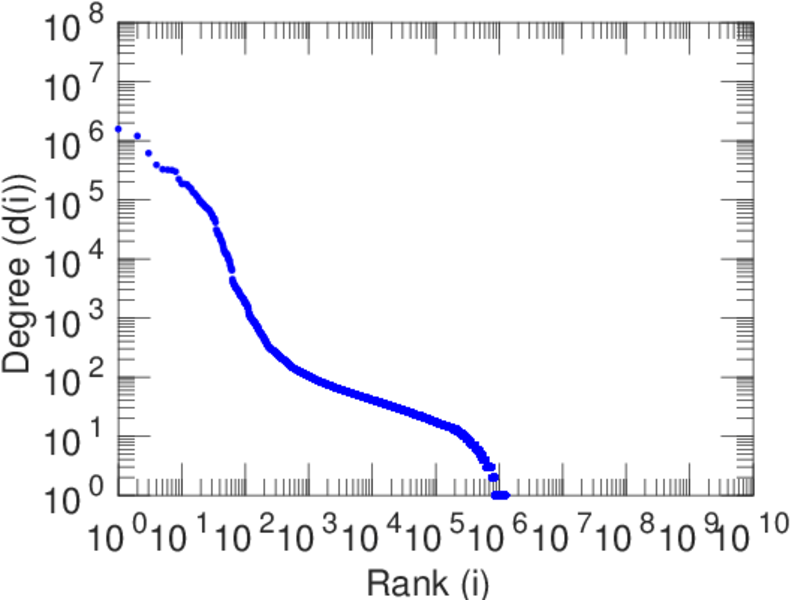
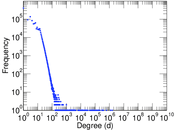
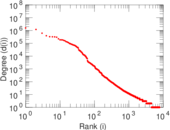
| Maximum degree | dmax = | 1,569,395
|
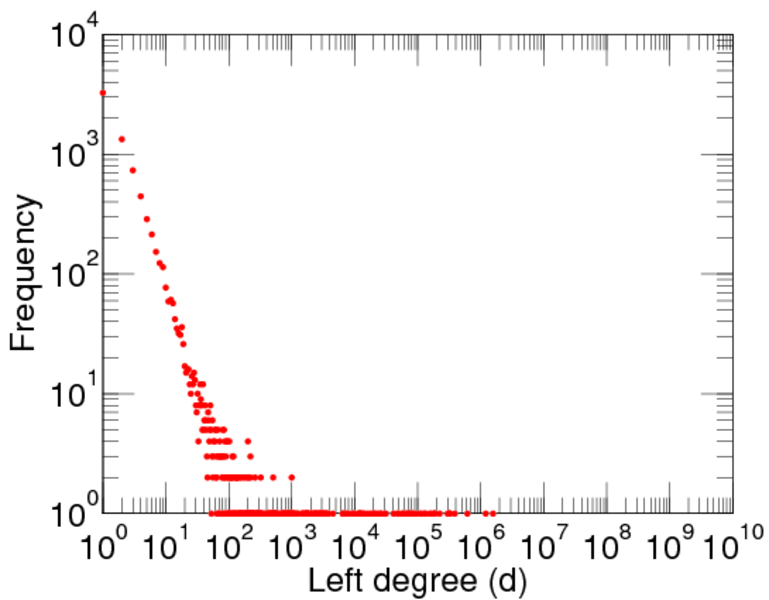
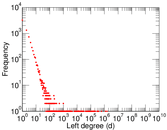
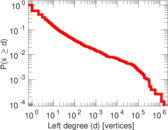
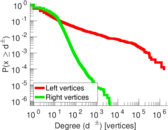
| Maximum left degree | d1max = | 1,569,395
|
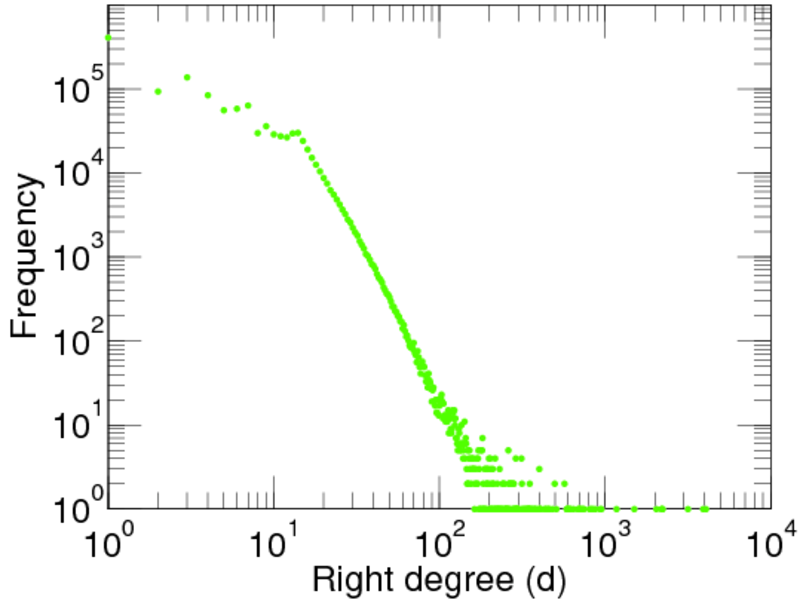
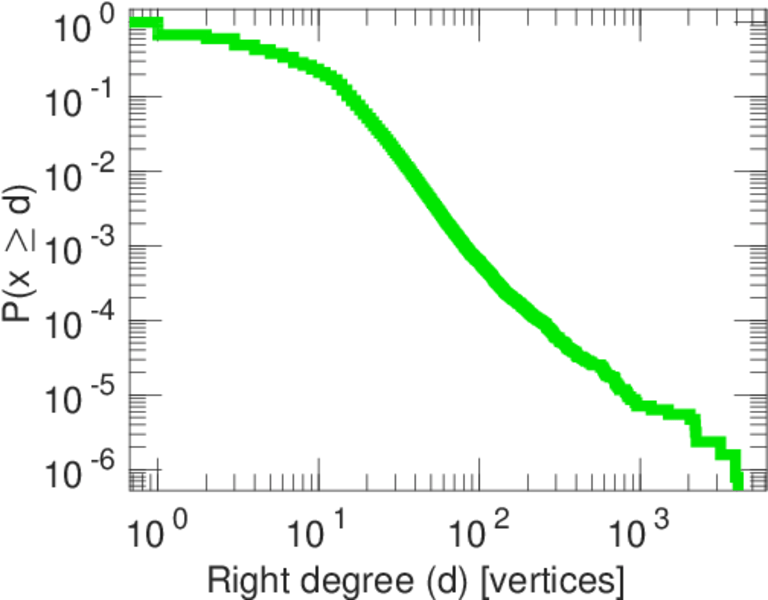
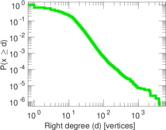
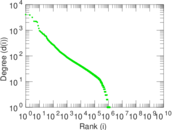
| Maximum right degree | d2max = | 4,073
|
| Average degree | d = | 13.105 4
|
| Average left degree | d1 = | 1,068.22
|
| Average right degree | d2 = | 6.593 15
|
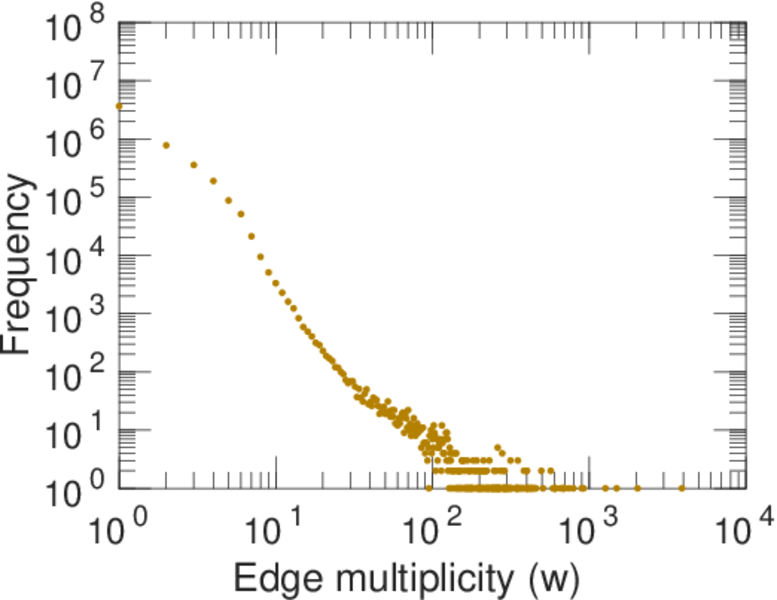
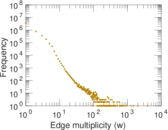
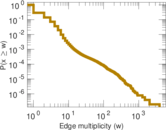
| Average edge multiplicity | m̃ = | 1.623 97
|
| Size of LCC | N = | 1,272,099
|
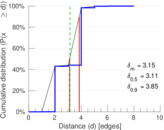
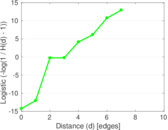
| Diameter | δ = | 11
|
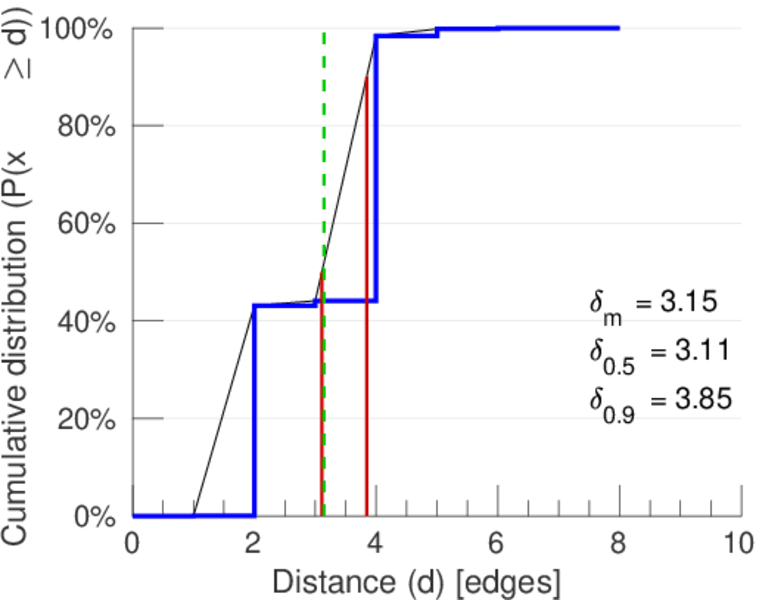
| 50-Percentile effective diameter | δ0.5 = | 3.108 90
|
| 90-Percentile effective diameter | δ0.9 = | 3.845 20
|
| Median distance | δM = | 4
|
| Mean distance | δm = | 3.146 08
|
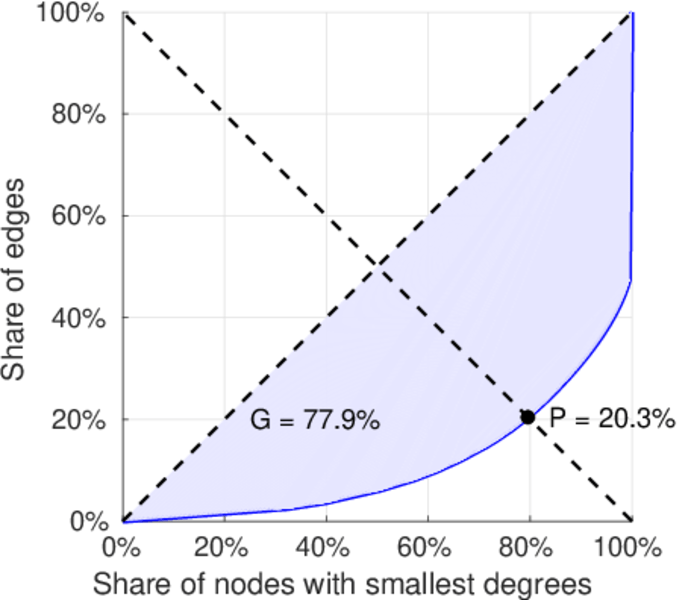
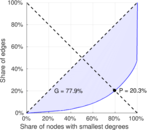
| Balanced inequality ratio | P = | 0.202 732
|
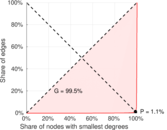
| Left balanced inequality ratio | P1 = | 0.011 441 9
|
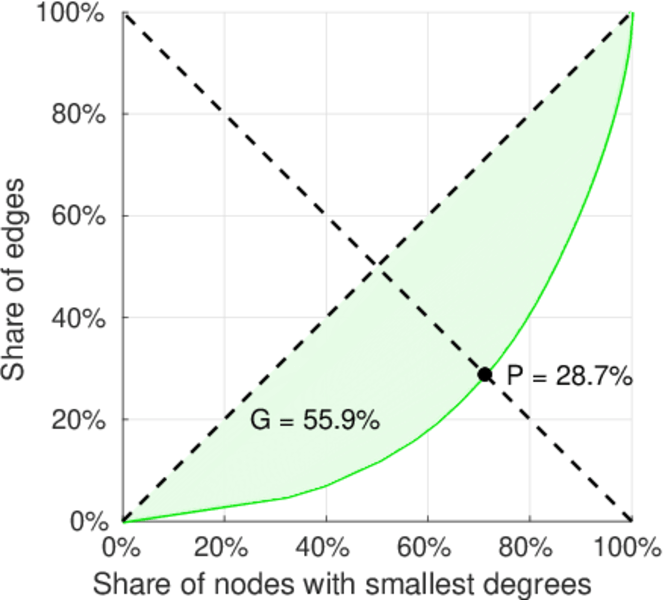
| Right balanced inequality ratio | P2 = | 0.286 804
|
| Relative edge distribution entropy | Her = | 0.658 711
|
| Tail power law exponent | γt = | 5.301 00
|
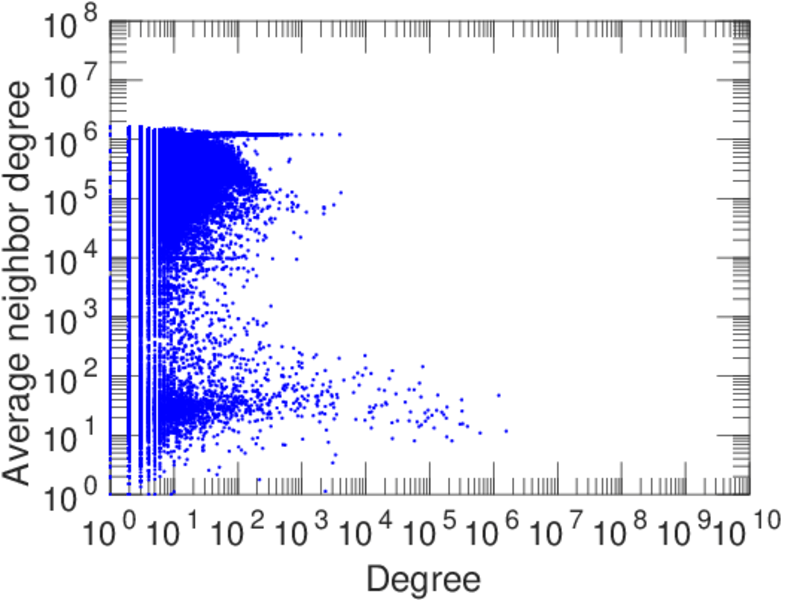
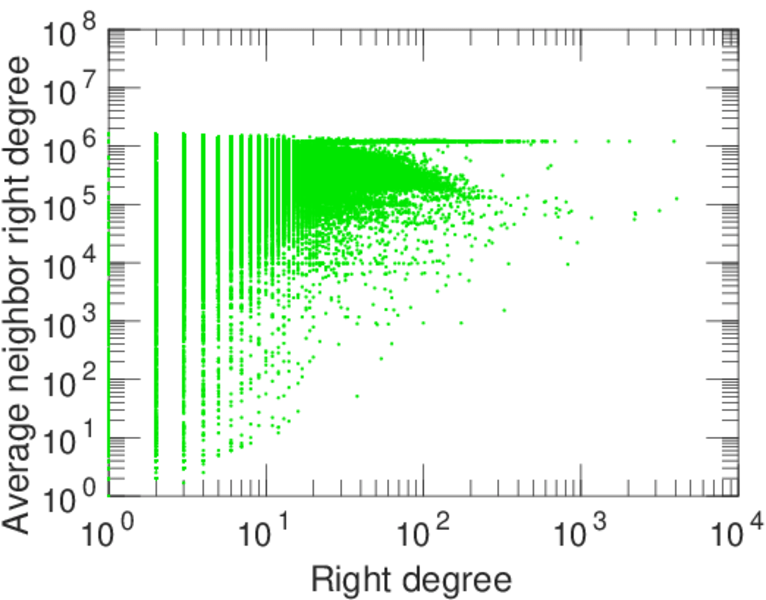
| Degree assortativity | ρ = | −0.230 923
|
| Degree assortativity p-value | pρ = | 0.000 00
|
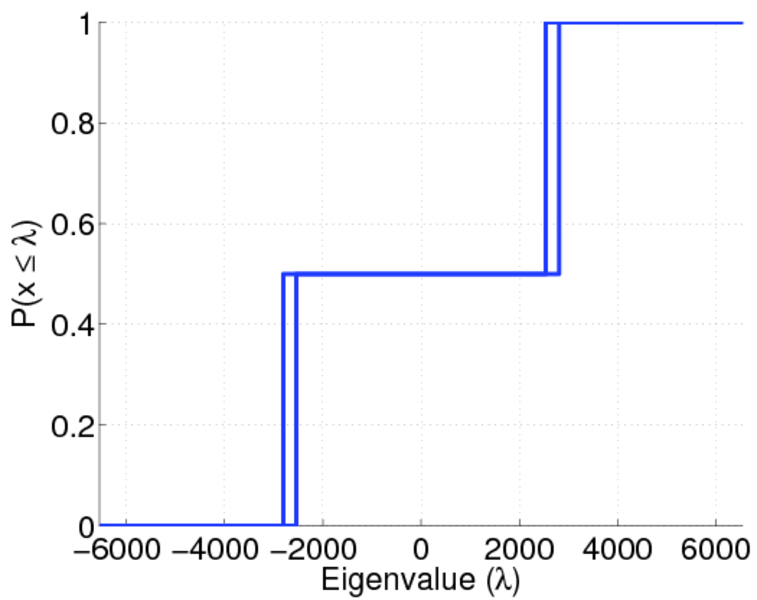
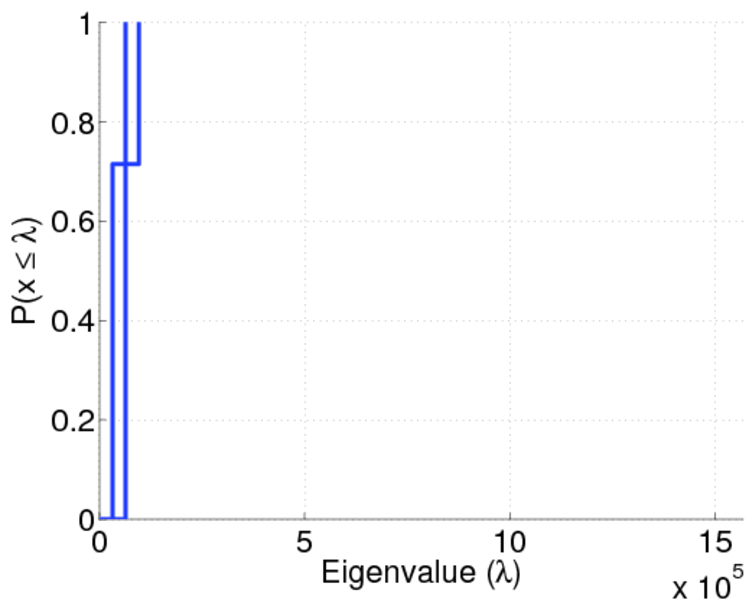
| Spectral norm | α = | 6,549.56
|
| Spectral separation | |λ1[A] / λ2[A]| = | 2.634 62
|
| Controllability | C = | 1,258,335
|
| Relative controllability | Cr = | 0.988 319
|
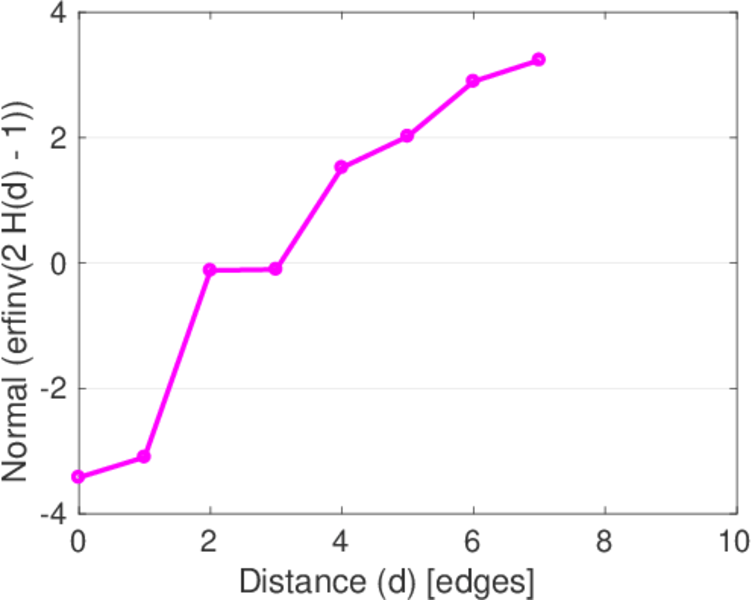
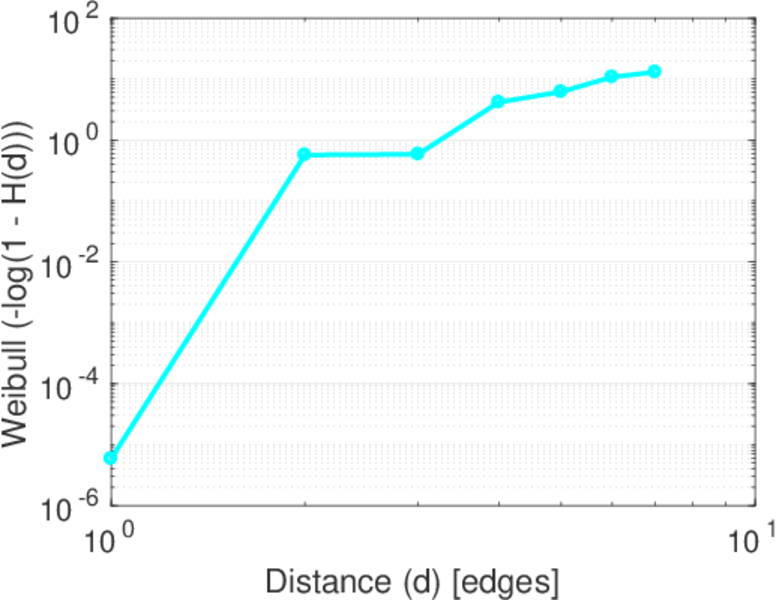
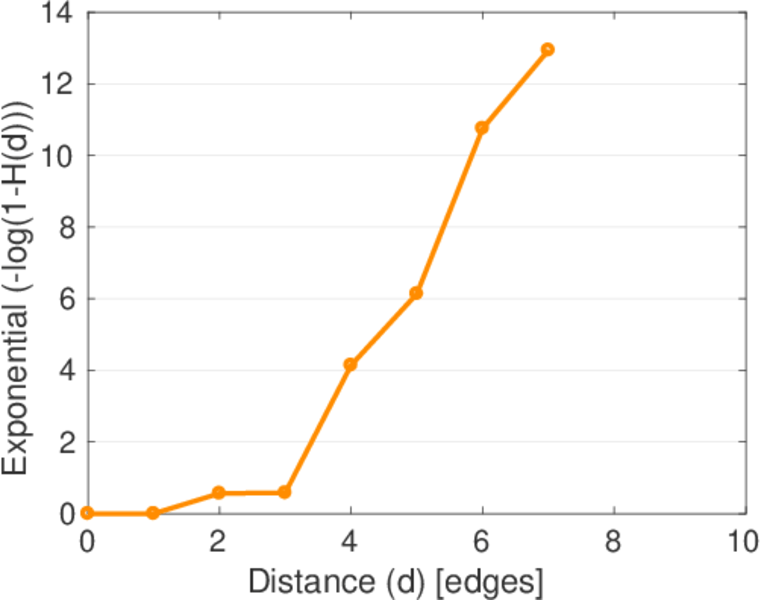
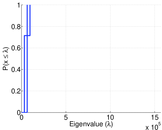
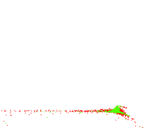
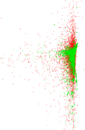
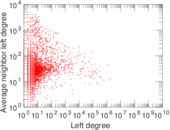
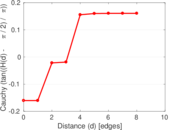
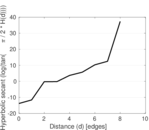
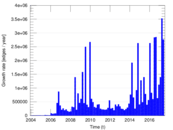
Plots


Downloads
References
|
[1]
|
Jérôme Kunegis.
KONECT – The Koblenz Network Collection.
In Proc. Int. Conf. on World Wide Web Companion, pages
1343–1350, 2013.
[ http ]
|
|
[2]
|
Wikimedia Foundation.
Wikimedia downloads.
http://dumps.wikimedia.org/, January 2010.
|
 KONECT ‣ Networks ‣
Buy Me a Coffee
KONECT ‣ Networks ‣
Buy Me a Coffee