Wikipedia edits (simple)
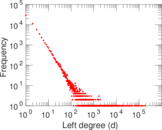
This is the bipartite edit network of the Simple English Wikipedia. It contains
users and pages from the Simple English Wikipedia, connected by edit events.
Each edge represents an edit. The dataset includes the timestamp of each edit.
Metadata
Statistics
| Size | n = | 494,139
|
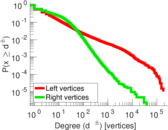
| Left size | n1 = | 66,022
|
| Right size | n2 = | 428,117
|
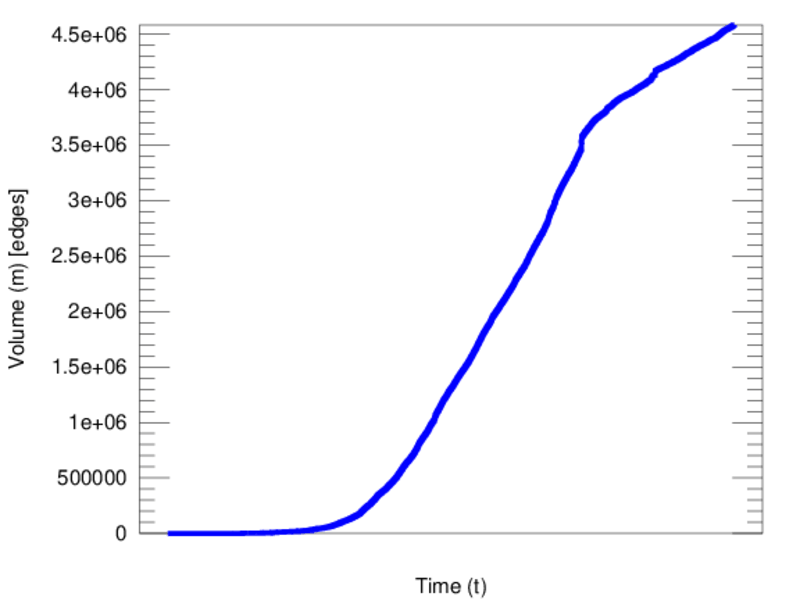
| Volume | m = | 4,581,775
|
| Unique edge count | m̿ = | 2,450,013
|
| Wedge count | s = | 28,594,062,814
|
| Claw count | z = | 578,548,002,824,395
|
| Square count | q = | 52,454,079,615
|
| 4-Tour count | T4 = | 534,016,537,742
|
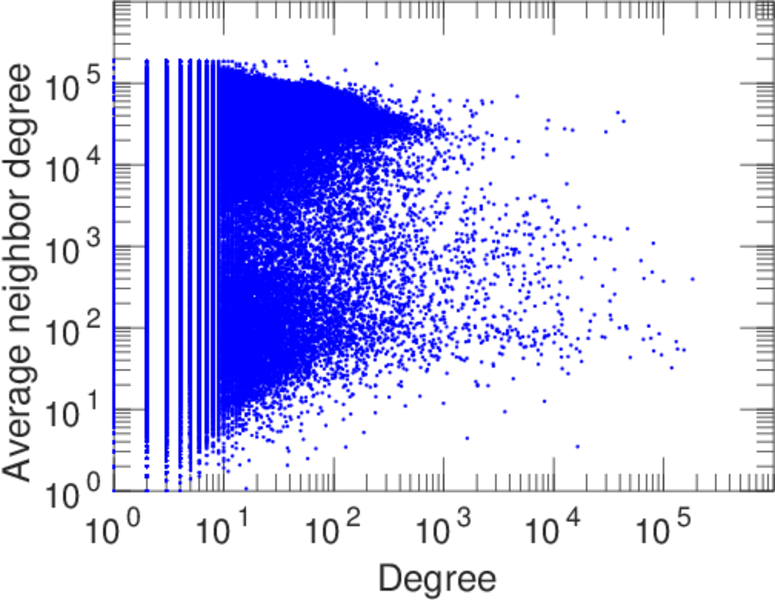
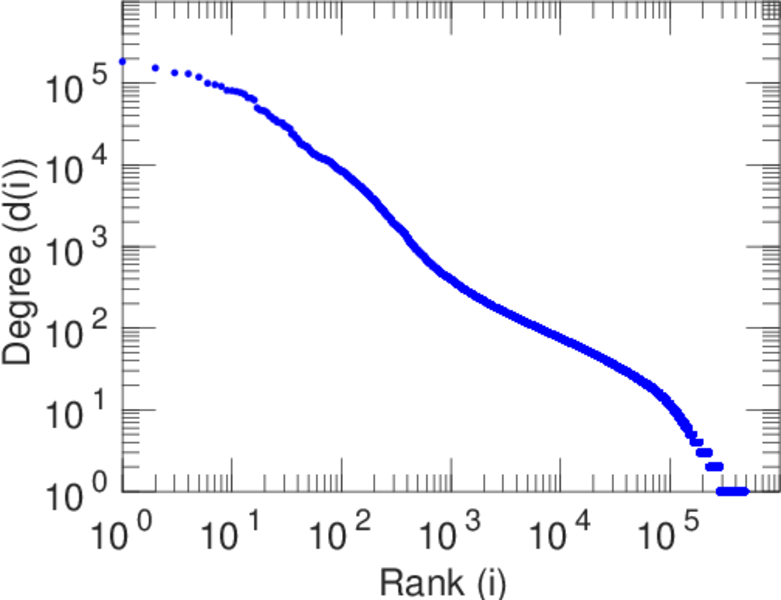
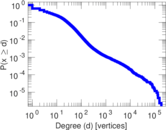
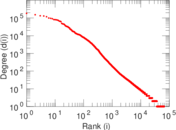
| Maximum degree | dmax = | 184,076
|
| Maximum left degree | d1max = | 184,076
|
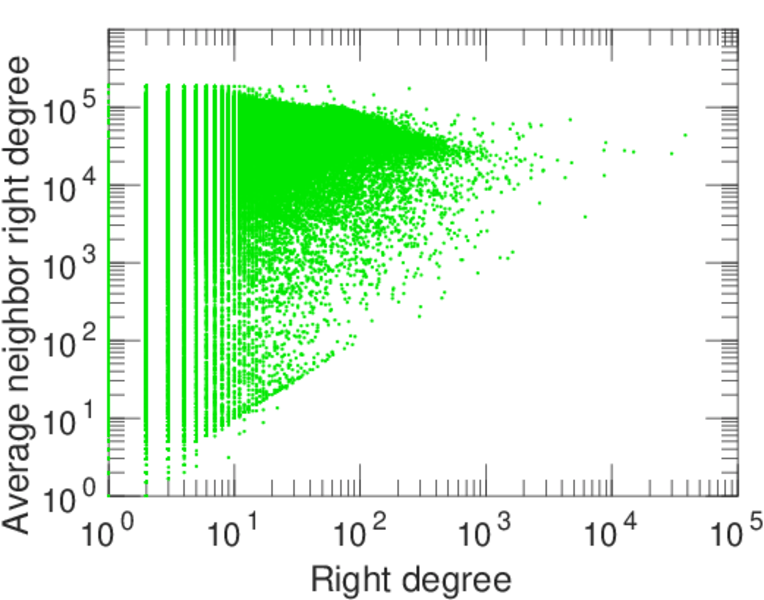
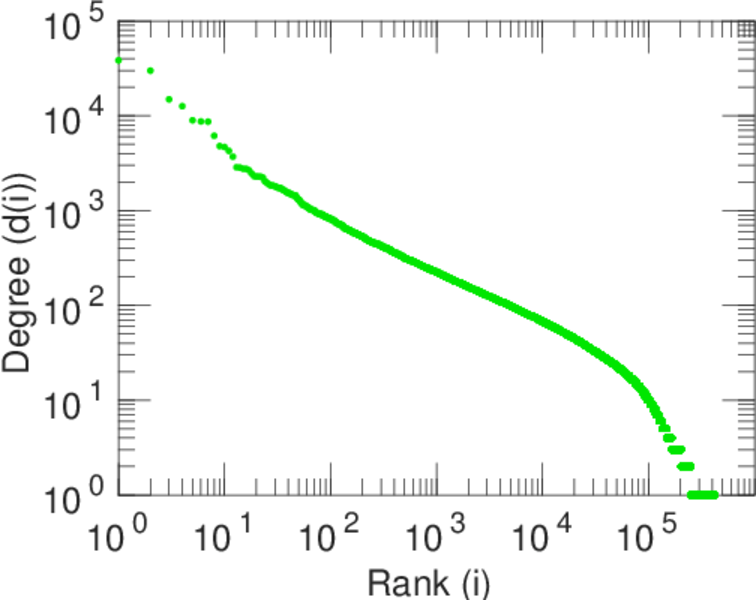
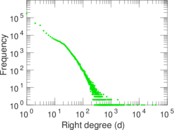
| Maximum right degree | d2max = | 38,437
|
| Average degree | d = | 18.544 5
|
| Average left degree | d1 = | 69.397 7
|
| Average right degree | d2 = | 10.702 2
|
| Average edge multiplicity | m̃ = | 1.870 10
|
| Size of LCC | N = | 477,983
|
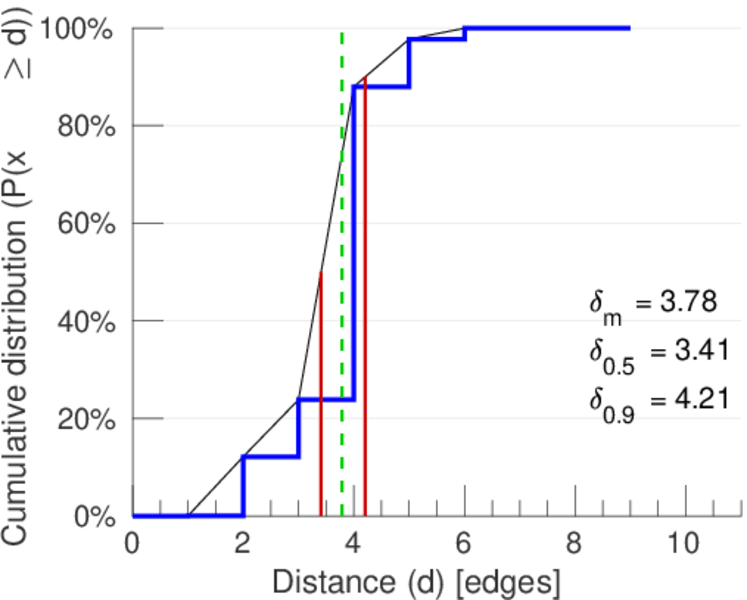
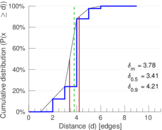
| Diameter | δ = | 12
|
| 50-Percentile effective diameter | δ0.5 = | 3.408 02
|
| 90-Percentile effective diameter | δ0.9 = | 4.207 85
|
| Median distance | δM = | 4
|
| Mean distance | δm = | 3.783 81
|
| Gini coefficient | G = | 0.857 065
|
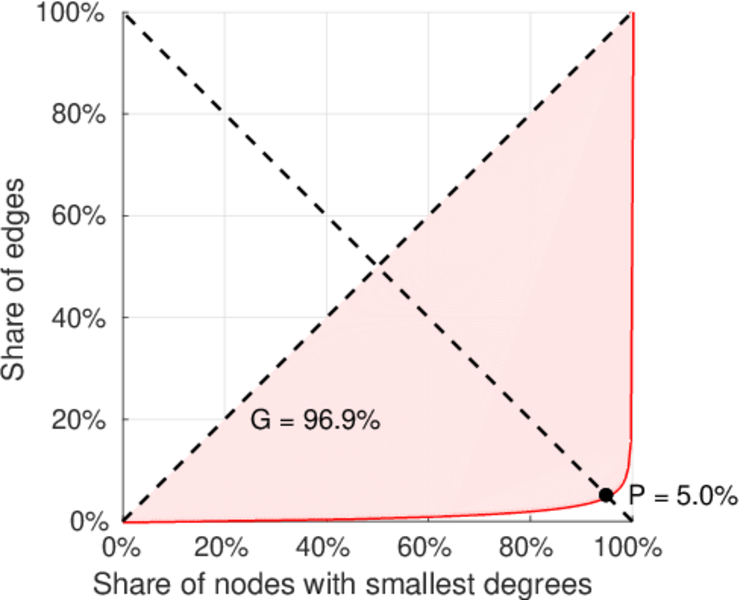
| Balanced inequality ratio | P = | 0.150 719
|
| Left balanced inequality ratio | P1 = | 0.049 995 9
|
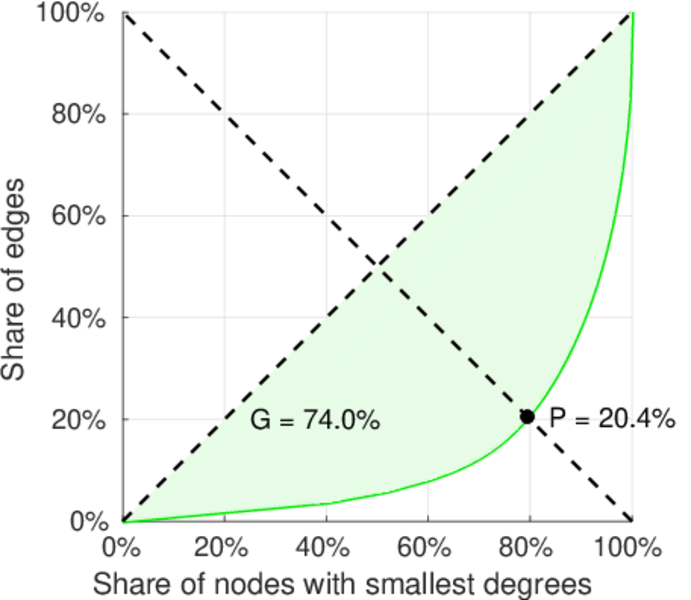
| Right balanced inequality ratio | P2 = | 0.203 760
|
| Relative edge distribution entropy | Her = | 0.744 531
|
| Power law exponent | γ = | 2.131 20
|
| Tail power law exponent | γt = | 2.681 00
|
| Degree assortativity | ρ = | −0.135 902
|
| Degree assortativity p-value | pρ = | 0.000 00
|
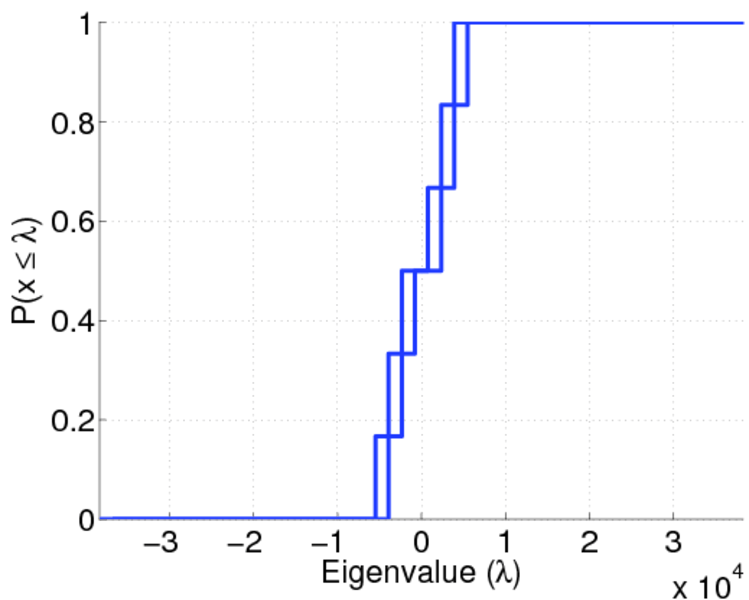
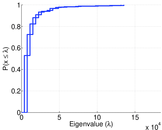
| Spectral norm | α = | 38,383.3
|
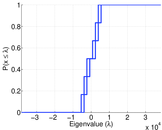
| Spectral separation | |λ1[A] / λ2[A]| = | 4.398 84
|
| Controllability | C = | 406,478
|
| Relative controllability | Cr = | 0.831 463
|
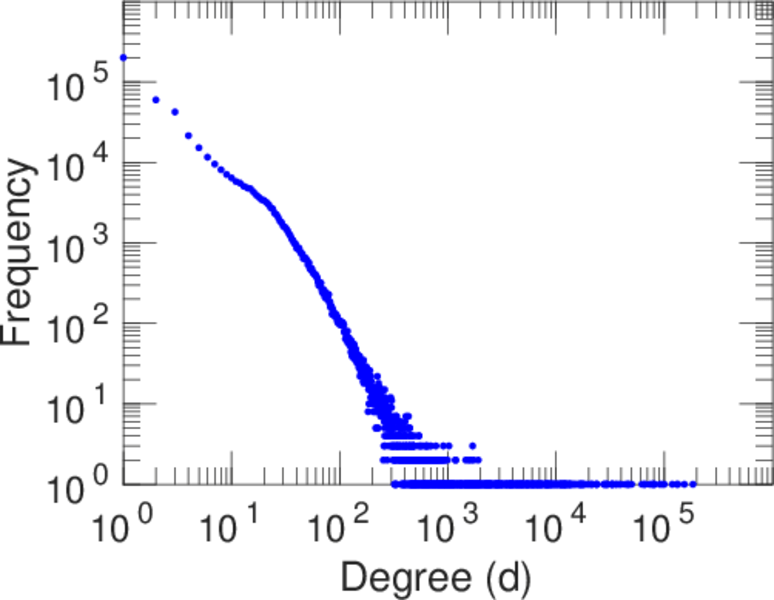
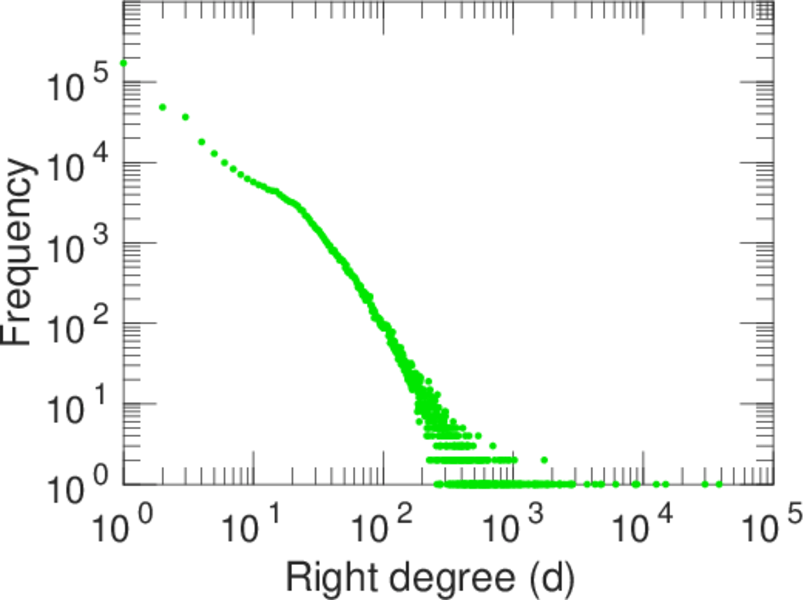
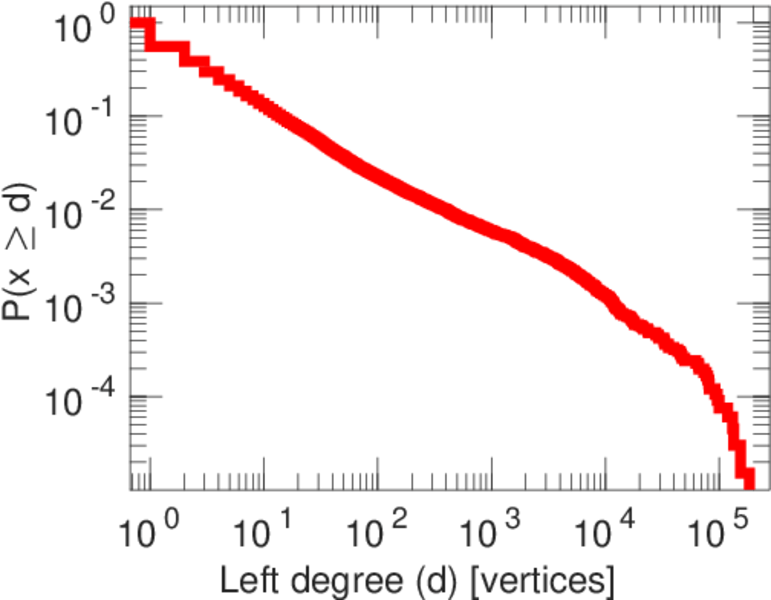
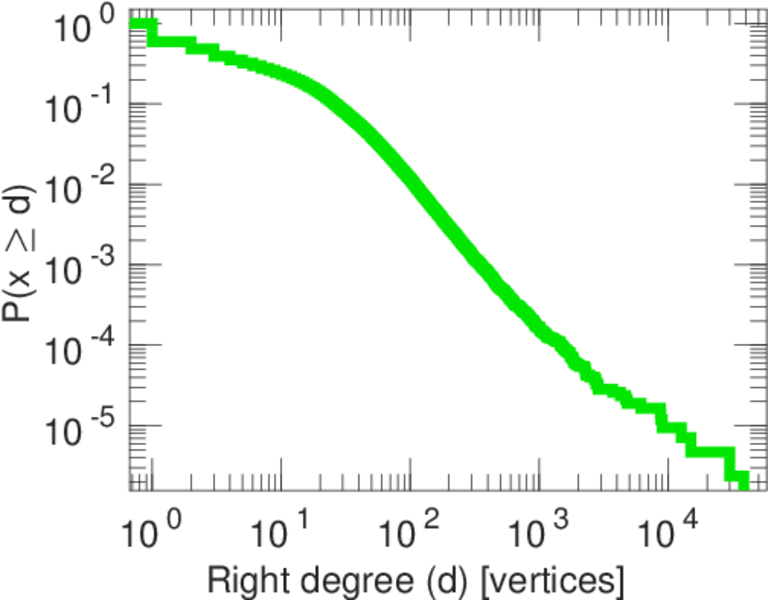
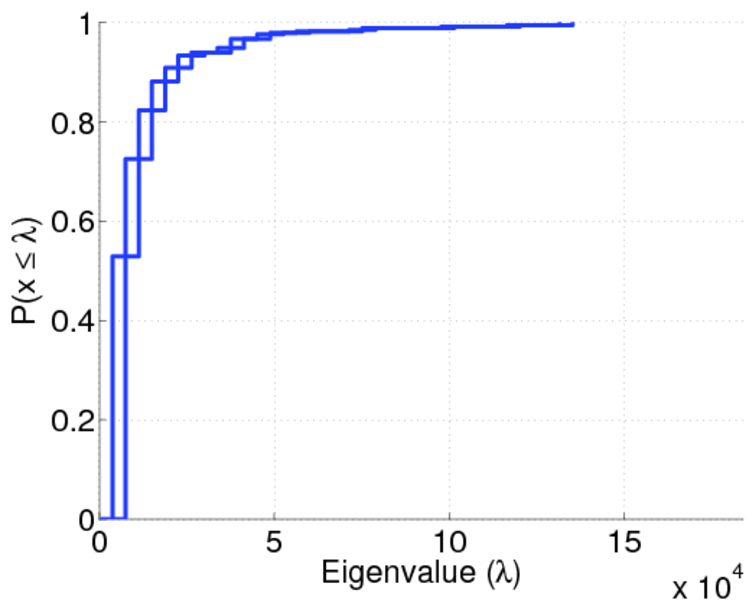
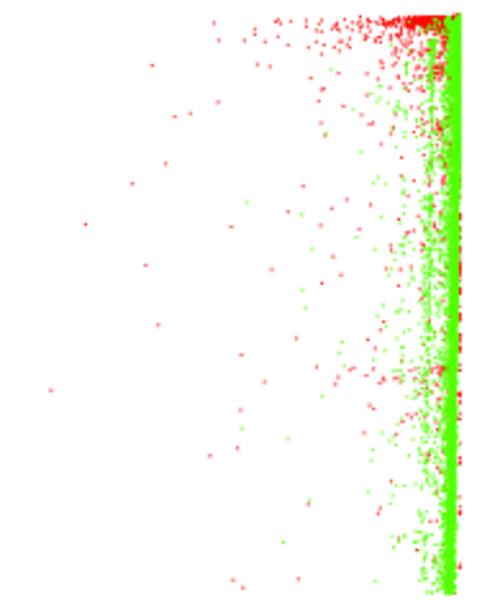
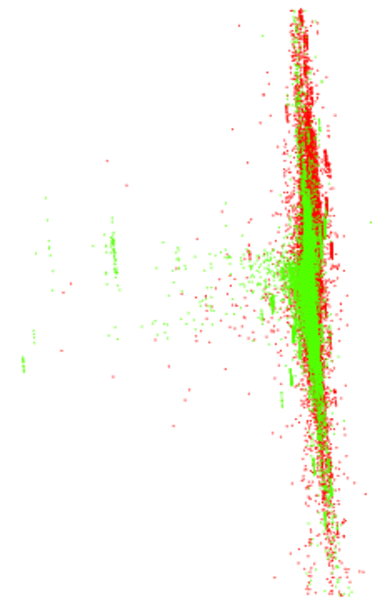
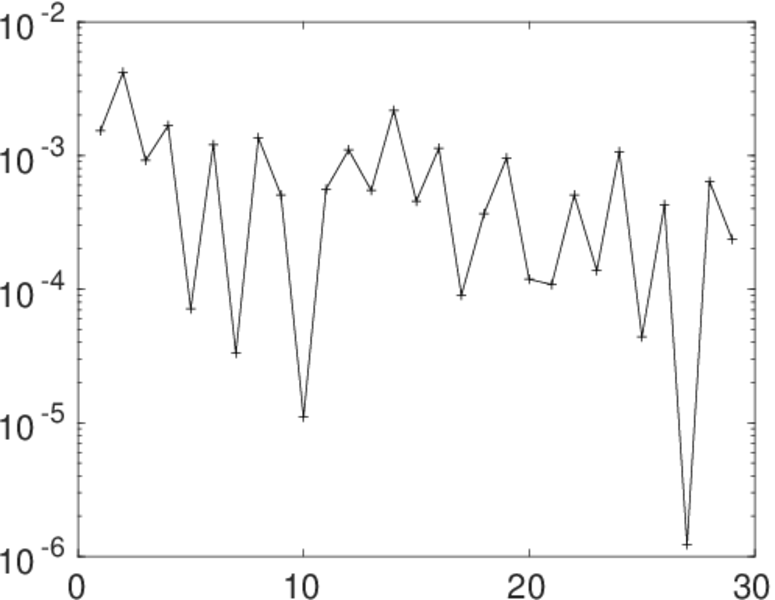
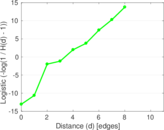
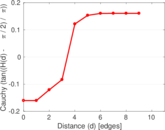
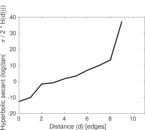
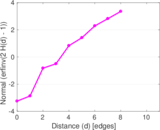
Plots


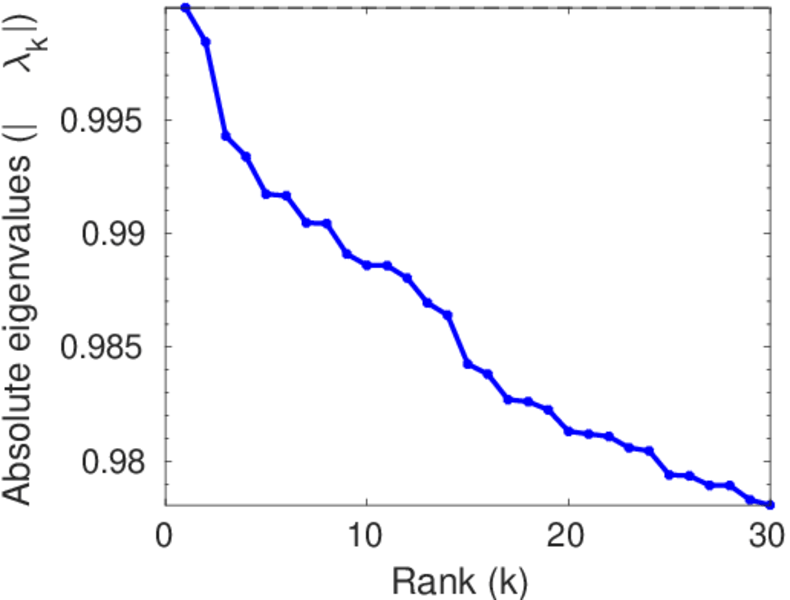
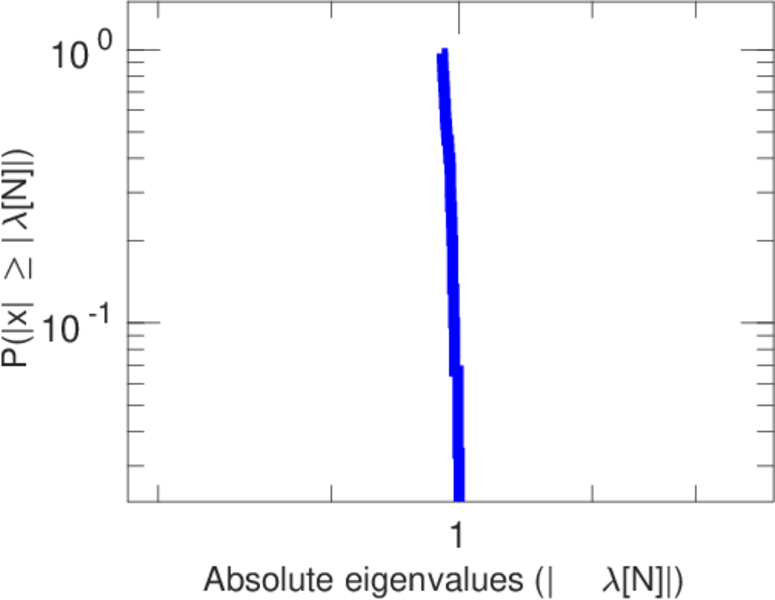
Matrix decompositions plots


Downloads
References
|
[1]
|
Jérôme Kunegis.
KONECT – The Koblenz Network Collection.
In Proc. Int. Conf. on World Wide Web Companion, pages
1343–1350, 2013.
[ http ]
|
|
[2]
|
Wikimedia Foundation.
Wikimedia downloads.
http://dumps.wikimedia.org/, January 2010.
|
 KONECT ‣ Networks ‣
Buy Me a Coffee
KONECT ‣ Networks ‣
Buy Me a Coffee