Wikipedia edits (sr)
This is the bipartite edit network of the Serbian Wikipedia. It contains users
and pages from the Serbian Wikipedia, connected by edit events. Each edge
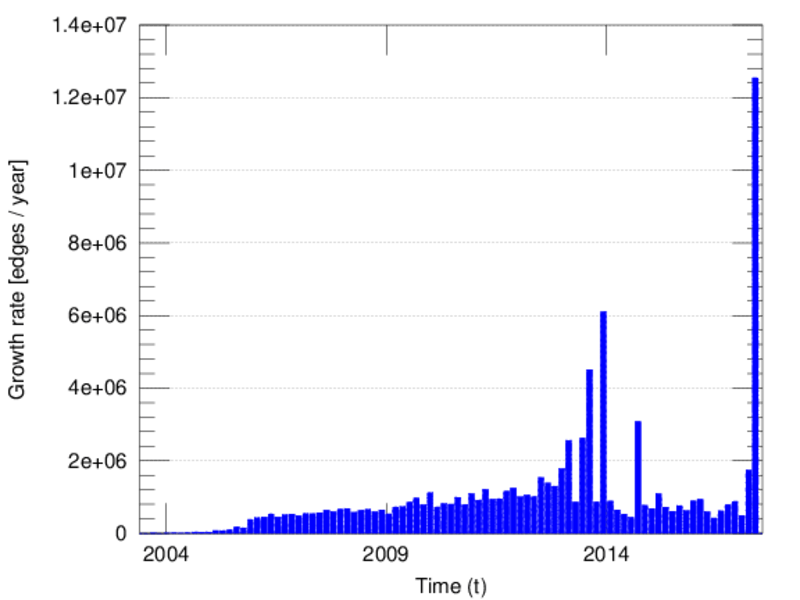
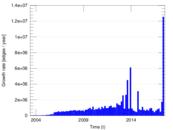
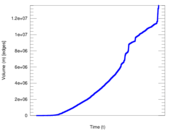
represents an edit. The dataset includes the timestamp of each edit.
Metadata
Statistics
| Size | n = | 1,416,821
|
| Left size | n1 = | 35,701
|
| Right size | n2 = | 1,381,120
|
| Volume | m = | 13,611,993
|
| Unique edge count | m̿ = | 4,847,705
|
| Wedge count | s = | 259,807,278,652
|
| Claw count | z = | 19,129,697,905,371,260
|
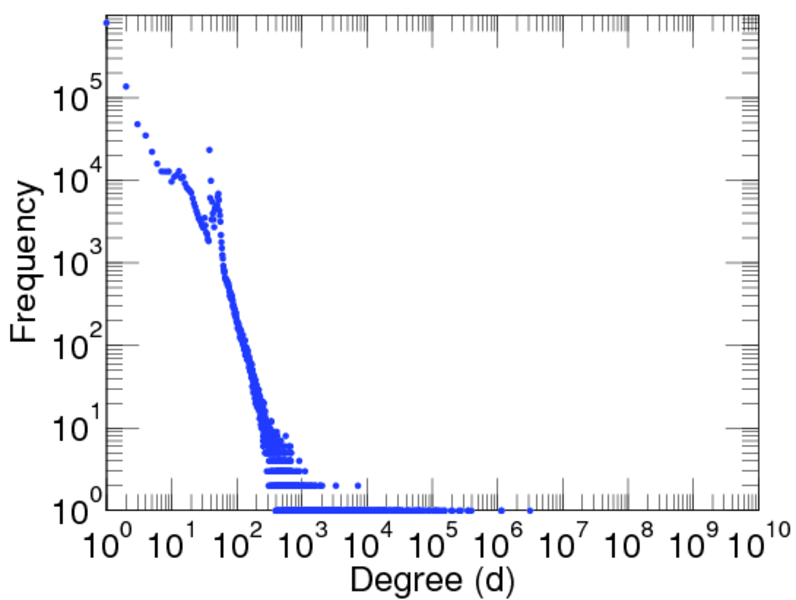
| Maximum degree | dmax = | 3,156,467
|
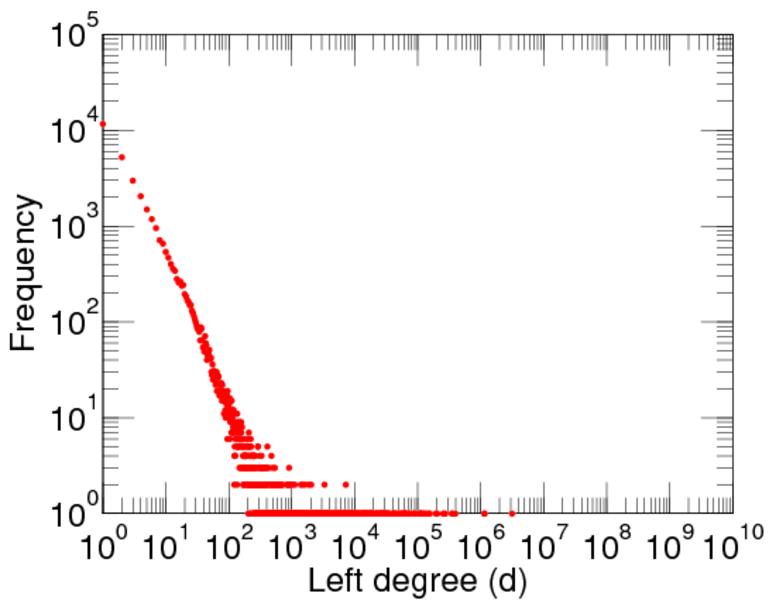
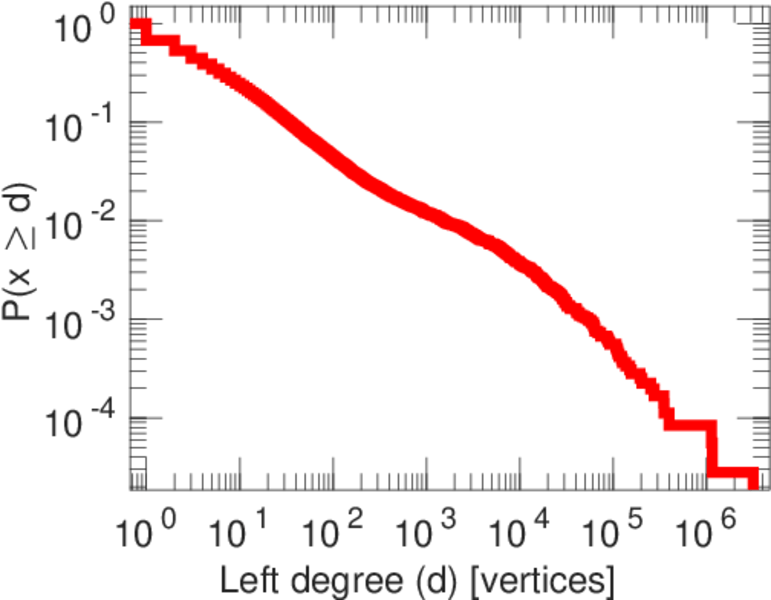
| Maximum left degree | d1max = | 3,156,467
|
| Maximum right degree | d2max = | 20,326
|
| Average degree | d = | 19.214 8
|
| Average left degree | d1 = | 381.278
|
| Average right degree | d2 = | 9.855 76
|
| Fill | p = | 9.831 60 × 10−5
|
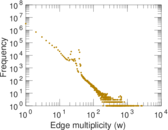
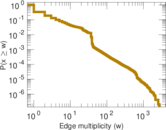
| Average edge multiplicity | m̃ = | 2.807 93
|
| Size of LCC | N = | 1,409,707
|
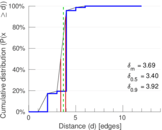
| Diameter | δ = | 13
|
| 50-Percentile effective diameter | δ0.5 = | 3.400 48
|
| 90-Percentile effective diameter | δ0.9 = | 3.924 94
|
| Median distance | δM = | 4
|
| Mean distance | δm = | 3.688 73
|
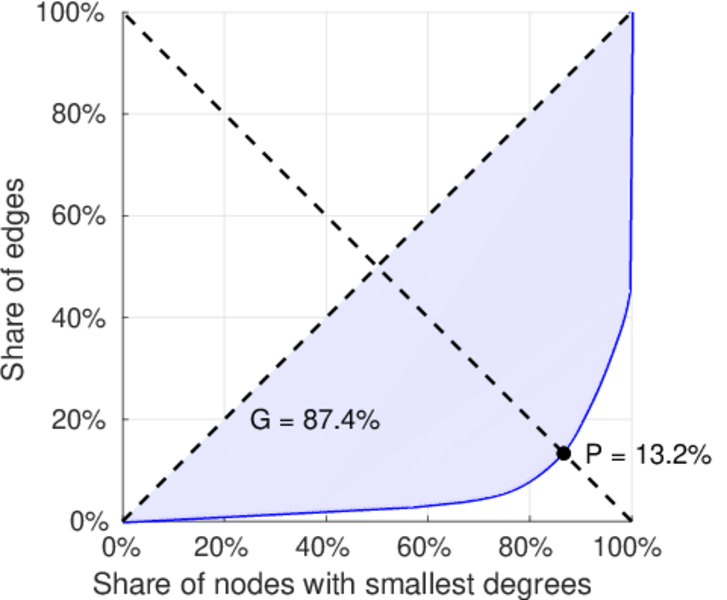
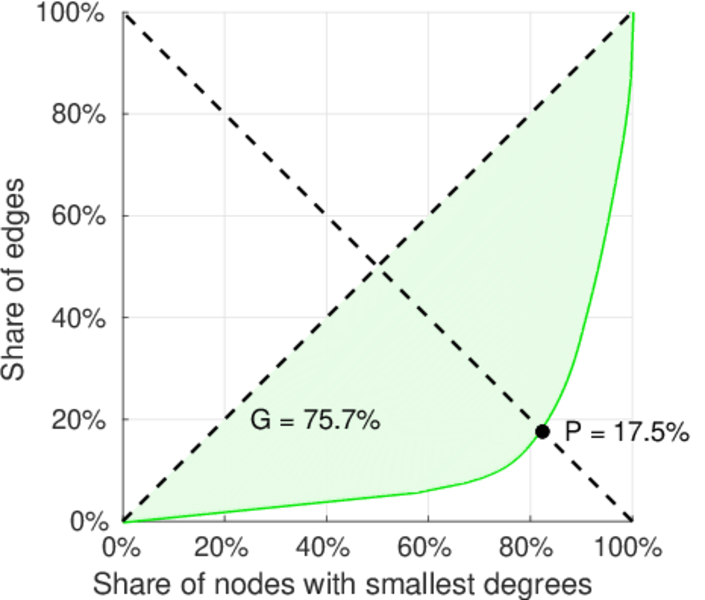
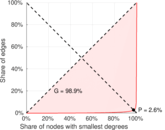
| Gini coefficient | G = | 0.876 618
|
| Balanced inequality ratio | P = | 0.129 309
|
| Left balanced inequality ratio | P1 = | 0.025 518 4
|
| Right balanced inequality ratio | P2 = | 0.174 557
|
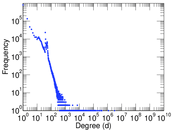
| Power law exponent | γ = | 2.652 04
|
| Tail power law exponent | γt = | 3.401 00
|
| Tail power law exponent with p | γ3 = | 3.401 00
|
| p-value | p = | 0.000 00
|
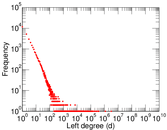
| Left tail power law exponent with p | γ3,1 = | 1.811 00
|
| Left p-value | p1 = | 0.000 00
|
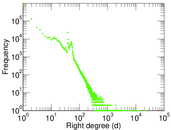
| Right tail power law exponent with p | γ3,2 = | 3.981 00
|
| Right p-value | p2 = | 0.000 00
|
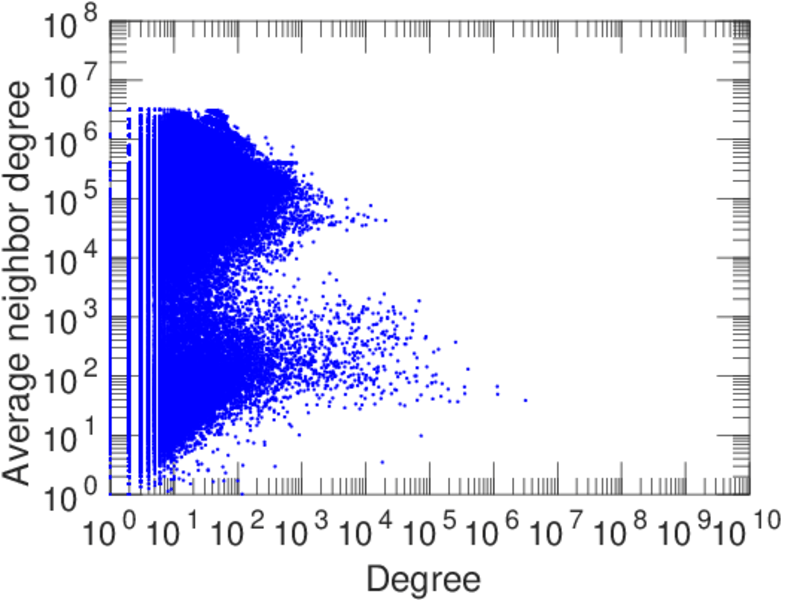
| Degree assortativity | ρ = | −0.164 165
|
| Degree assortativity p-value | pρ = | 0.000 00
|
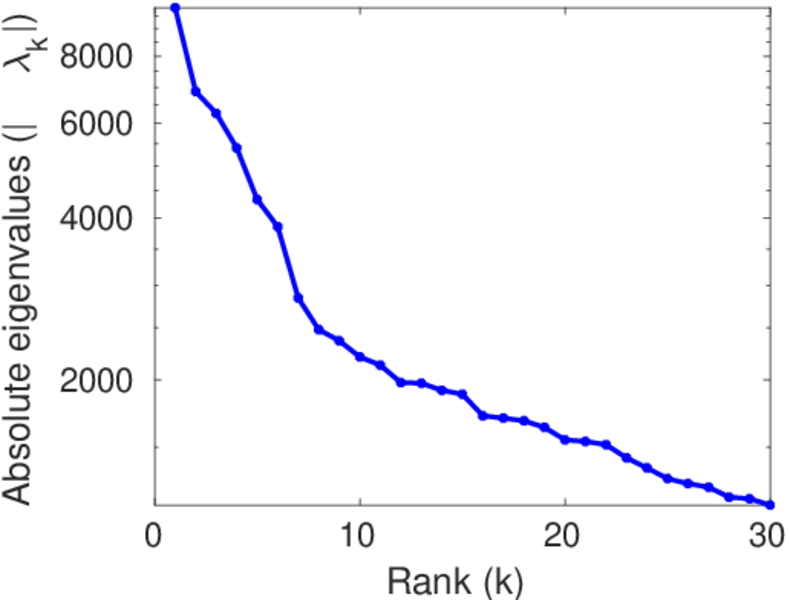
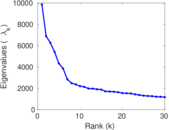
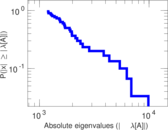
| Spectral norm | α = | 9,854.49
|
| Spectral separation | |λ1[A] / λ2[A]| = | 1.432 09
|
| Controllability | C = | 1,351,594
|
| Relative controllability | Cr = | 0.956 294
|
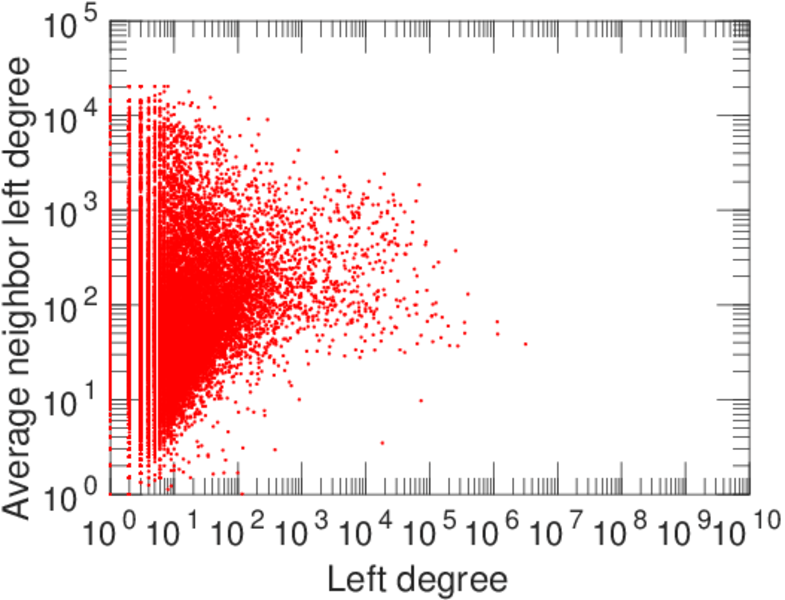
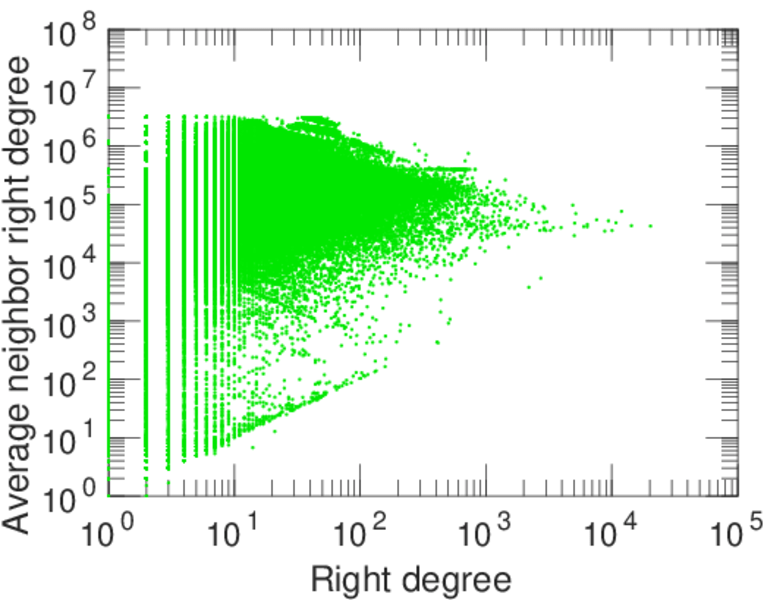
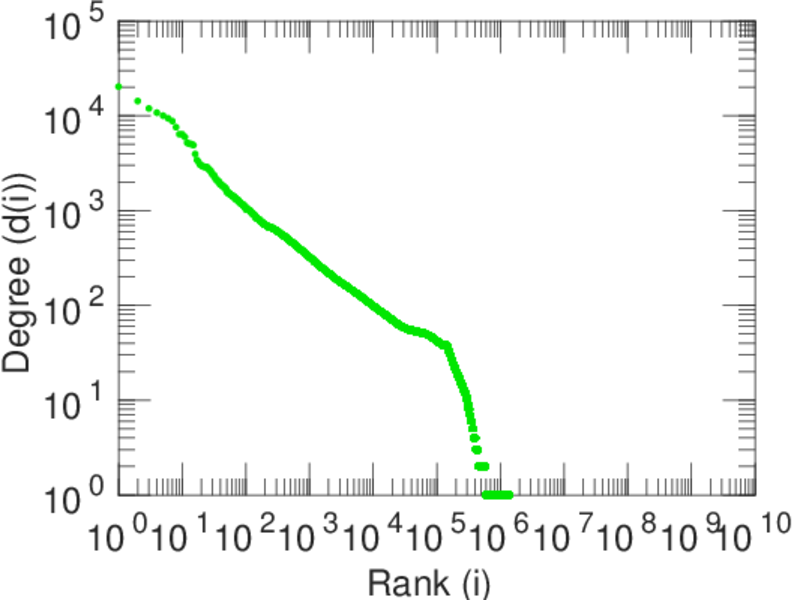
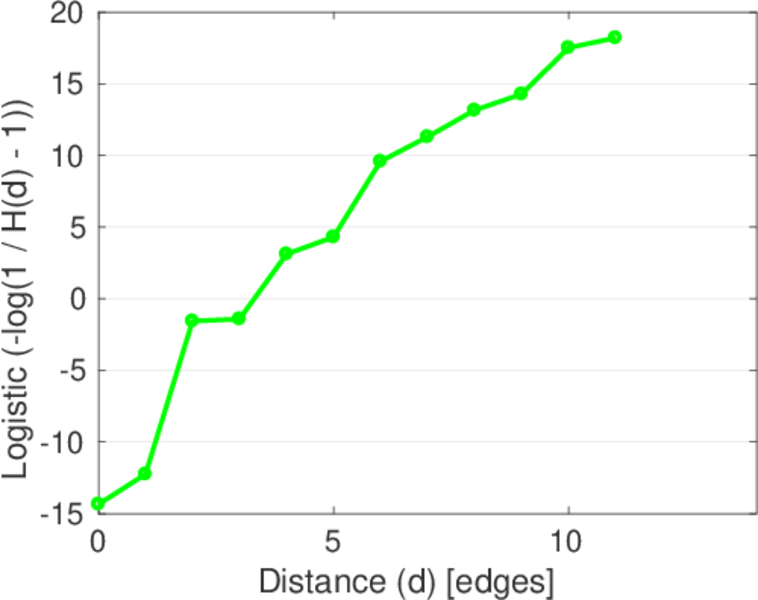
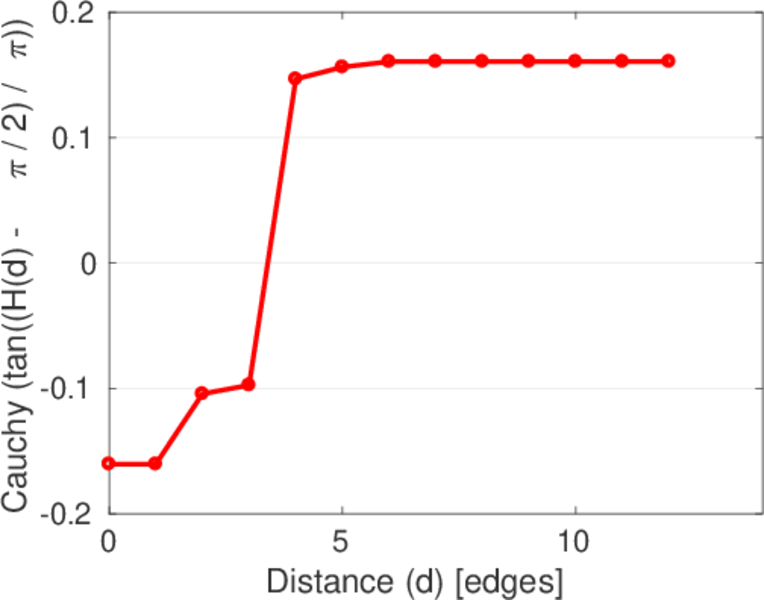
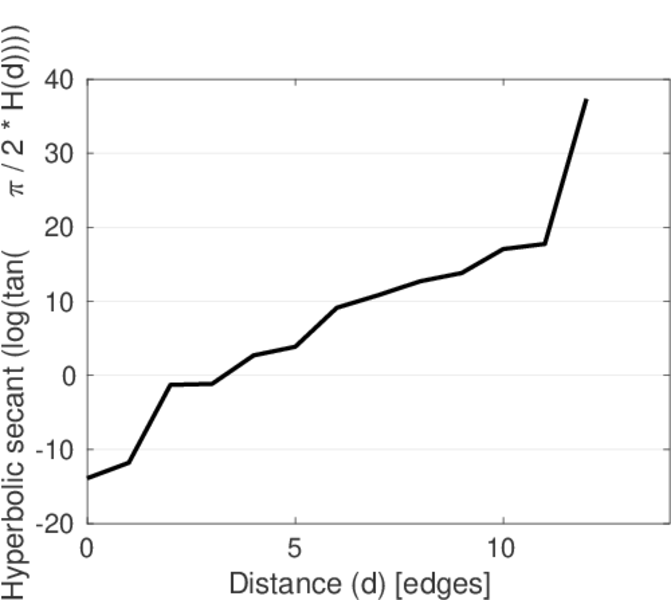
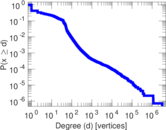
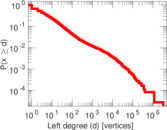
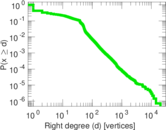
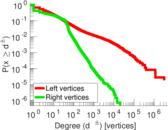
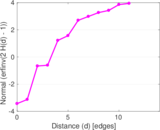
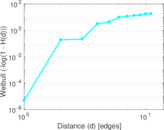
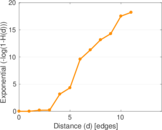
Plots


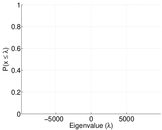
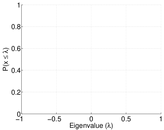

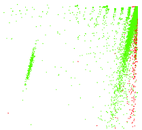


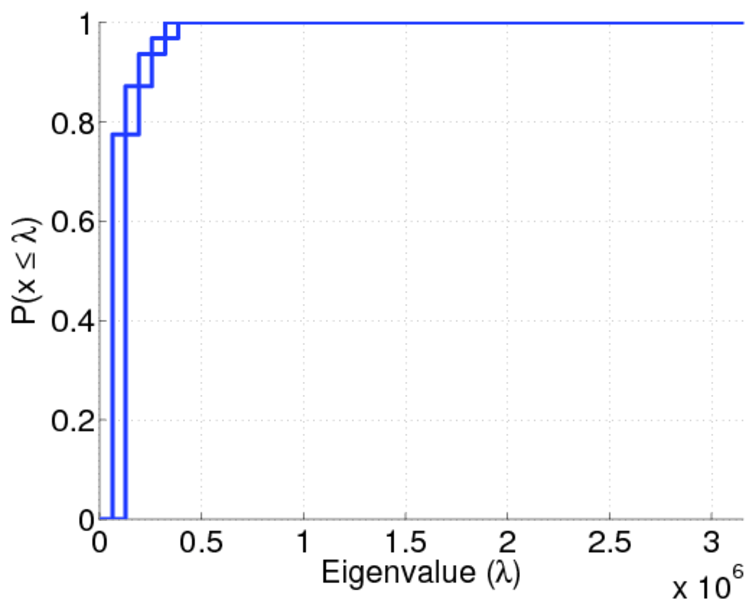
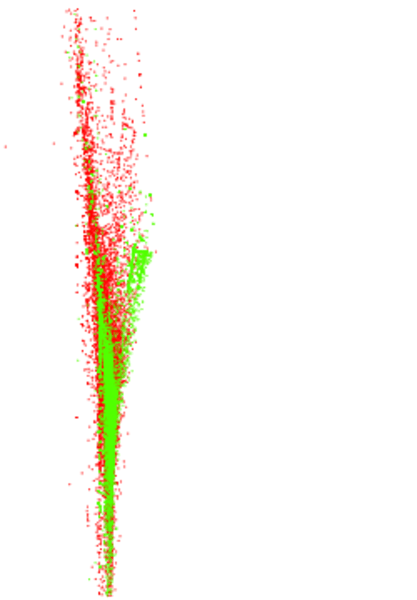
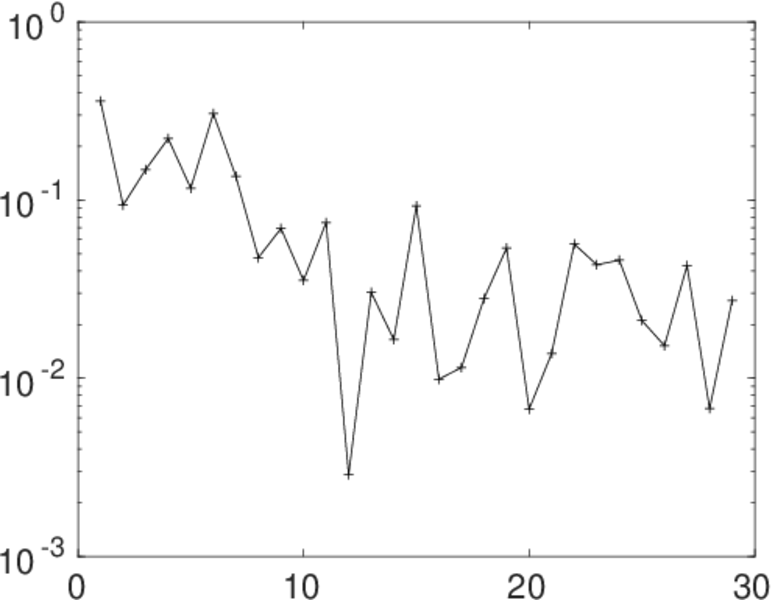
Matrix decompositions plots


Downloads
References
|
[1]
|
Jérôme Kunegis.
KONECT – The Koblenz Network Collection.
In Proc. Int. Conf. on World Wide Web Companion, pages
1343–1350, 2013.
[ http ]
|
|
[2]
|
Wikimedia Foundation.
Wikimedia downloads.
http://dumps.wikimedia.org/, January 2010.
|
 KONECT ‣ Networks ‣
Buy Me a Coffee
KONECT ‣ Networks ‣
Buy Me a Coffee