Wikinews edits (sr)
This is the bipartite edit network of the Serbian Wikinews. It contains users
and pages from the Serbian Wikinews, connected by edit events. Each edge
represents an edit. The dataset includes the timestamp of each edit.
Metadata
Statistics
| Size | n = | 124,174
|
| Left size | n1 = | 522
|
| Right size | n2 = | 123,652
|
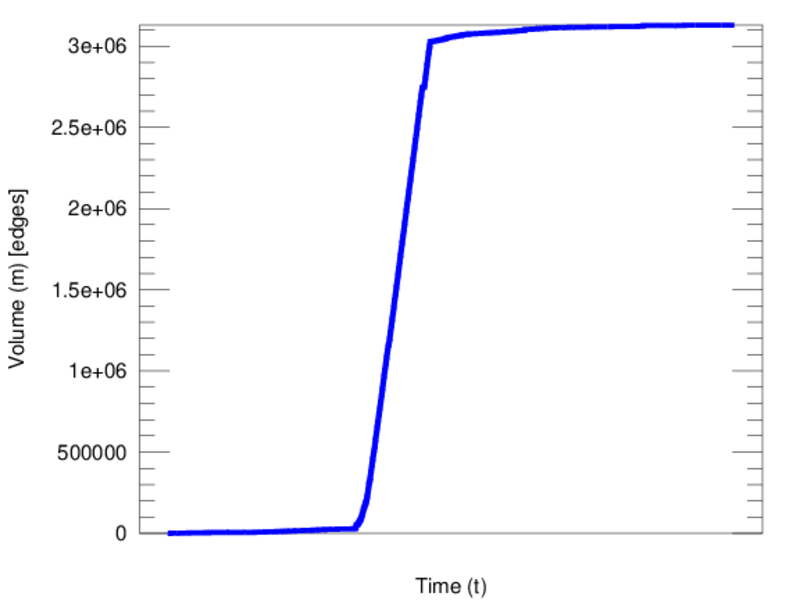
| Volume | m = | 3,129,705
|
| Unique edge count | m̿ = | 220,579
|
| Wedge count | s = | 3,340,788,687
|
| Claw count | z = | 45,855,375,963,262
|
| Cross count | x = | 500,226,064,942,920,256
|
| Square count | q = | 885,280,255
|
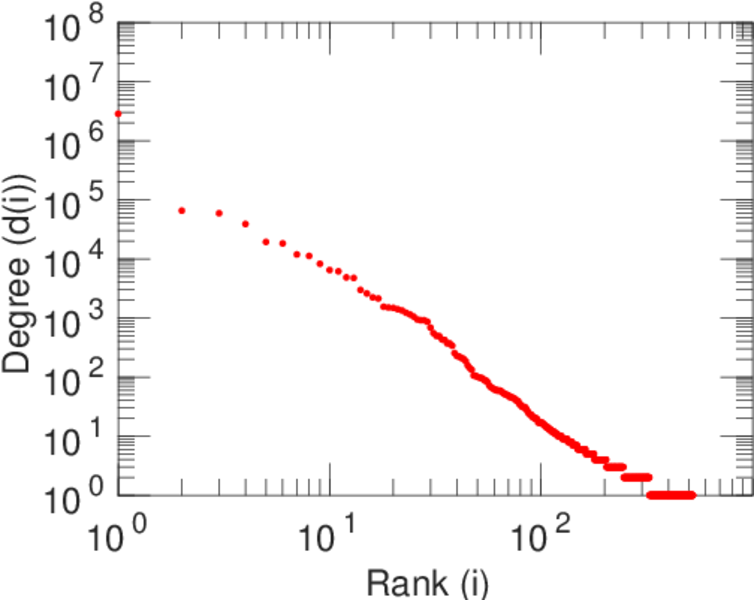
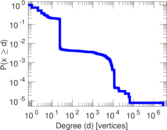
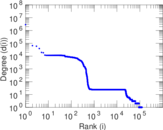
| Maximum degree | dmax = | 2,841,725
|
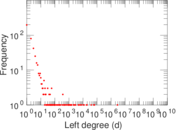
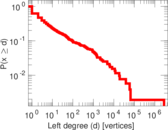
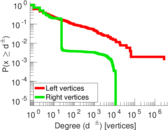
| Maximum left degree | d1max = | 2,841,725
|
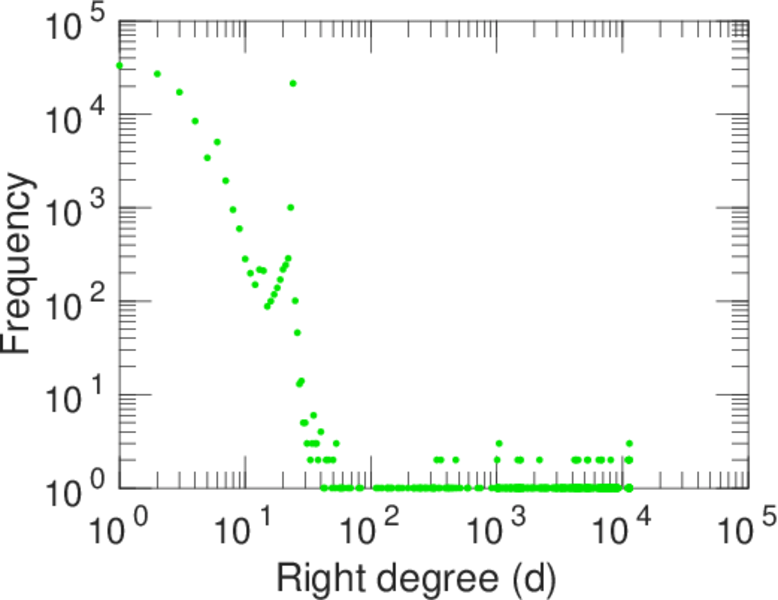
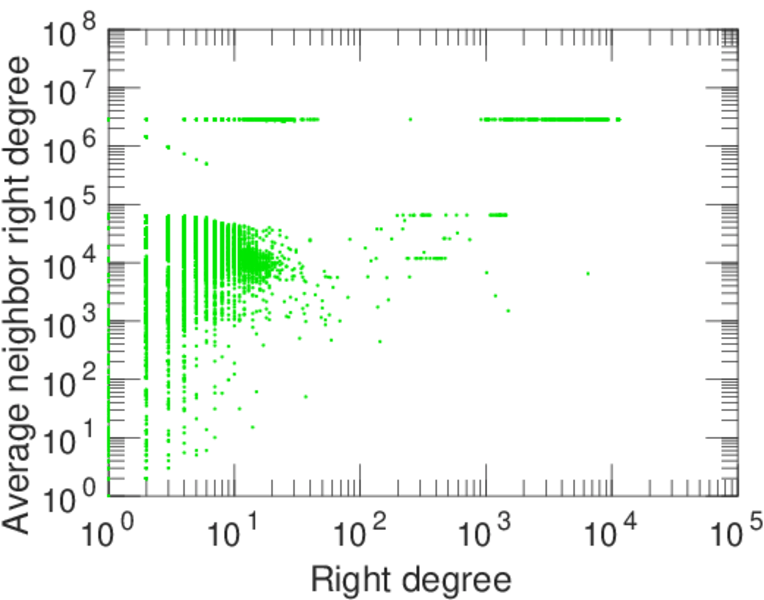
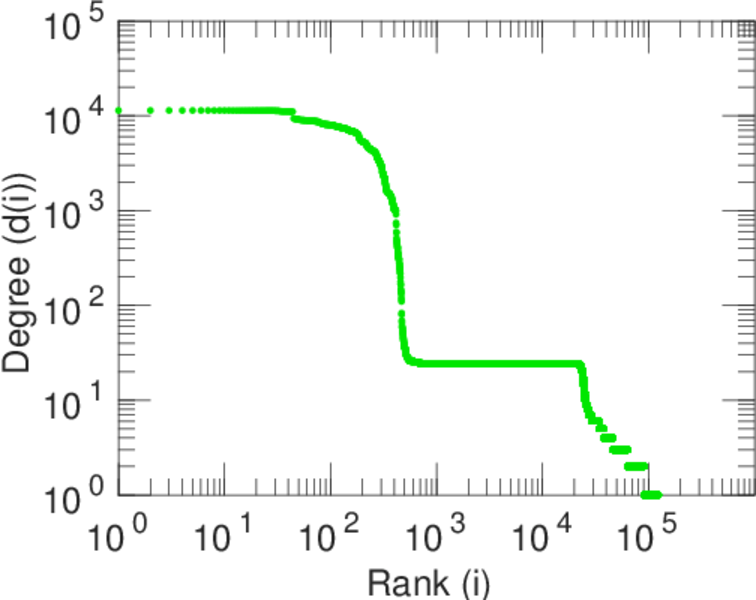
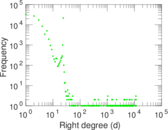
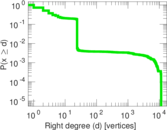
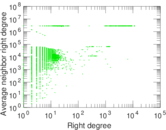
| Maximum right degree | d2max = | 11,387
|
| Average degree | d = | 50.408 4
|
| Average left degree | d1 = | 5,995.60
|
| Average right degree | d2 = | 25.310 6
|
| Fill | p = | 0.003 417 37
|
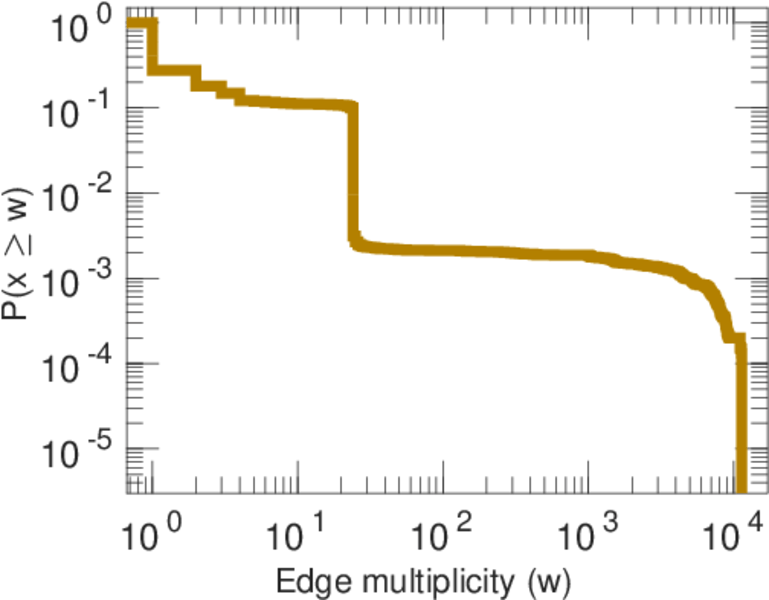
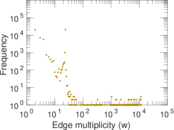
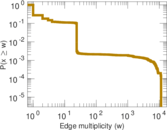
| Average edge multiplicity | m̃ = | 14.188 6
|
| Size of LCC | N = | 123,822
|
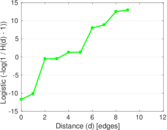
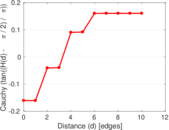
| Diameter | δ = | 11
|
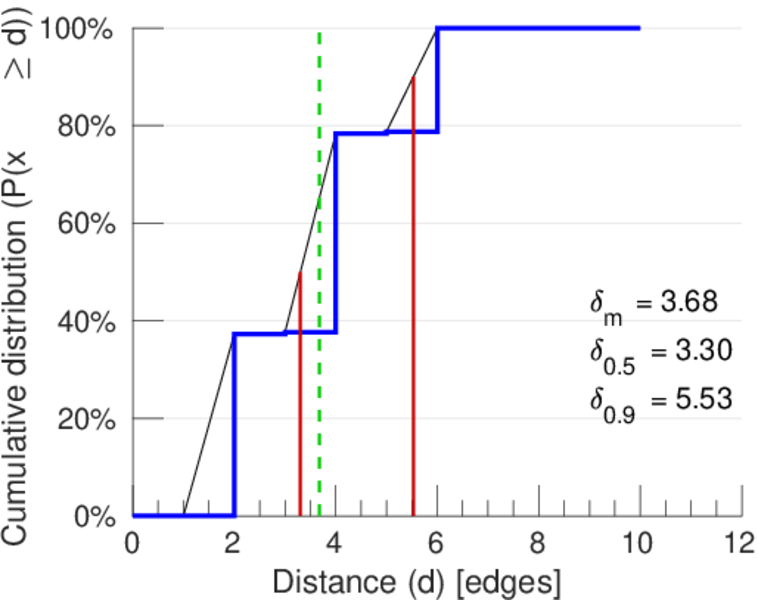
| 50-Percentile effective diameter | δ0.5 = | 3.303 71
|
| 90-Percentile effective diameter | δ0.9 = | 5.529 82
|
| Median distance | δM = | 4
|
| Mean distance | δm = | 3.680 38
|
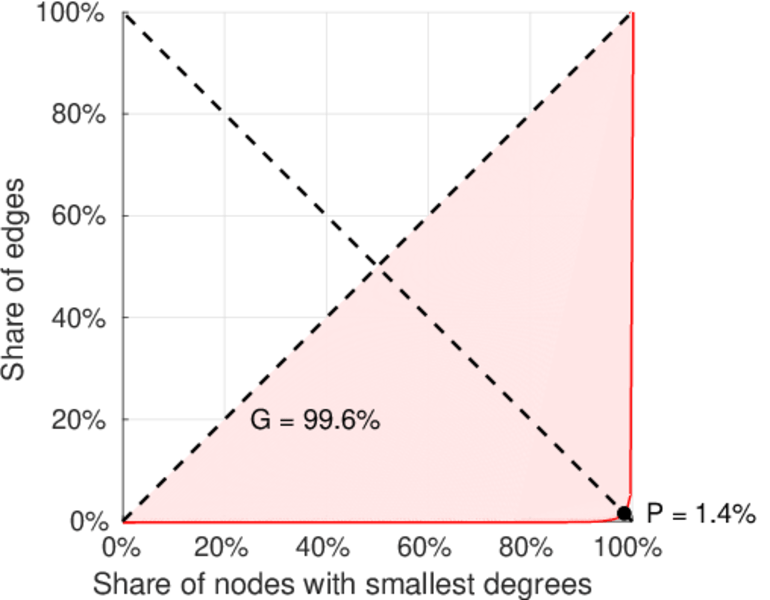
| Balanced inequality ratio | P = | 0.089 645 3
|
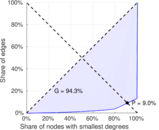
| Left balanced inequality ratio | P1 = | 0.013 909 0
|
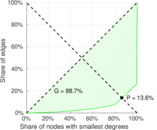
| Right balanced inequality ratio | P2 = | 0.135 734
|
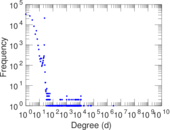
| Power law exponent | γ = | 3.226 99
|
| Tail power law exponent | γt = | 5.251 00
|
| Degree assortativity | ρ = | −0.268 160
|
| Degree assortativity p-value | pρ = | 0.000 00
|
| Spectral norm | α = | 129,420
|
| Algebraic connectivity | a = | 0.016 712 0
|
| Controllability | C = | 123,155
|
| Relative controllability | Cr = | 0.992 073
|
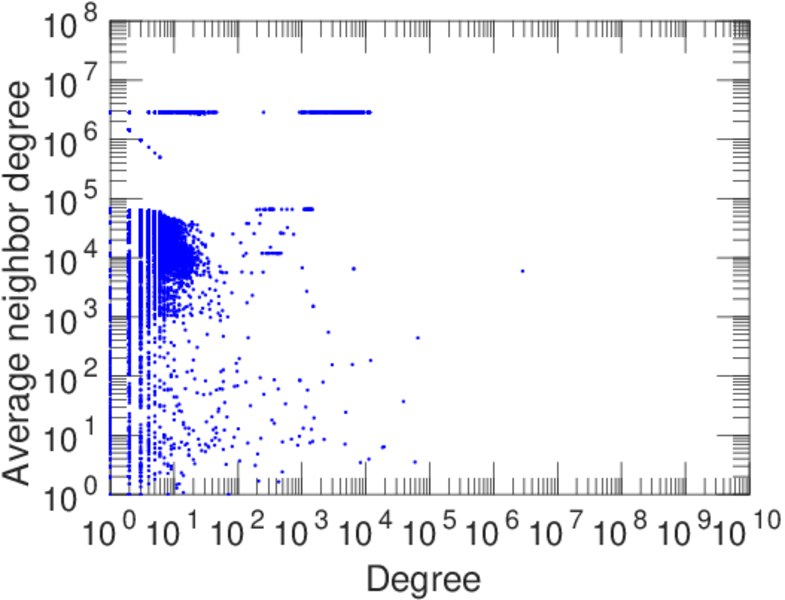
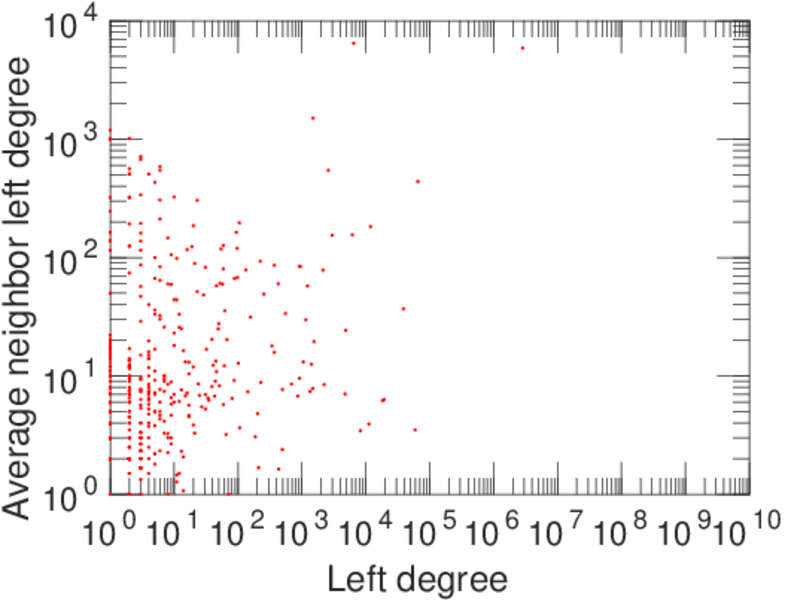
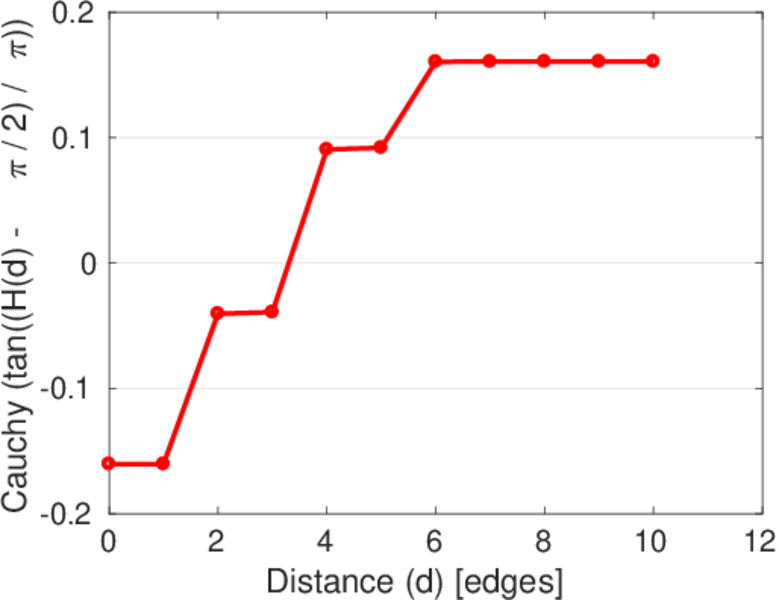
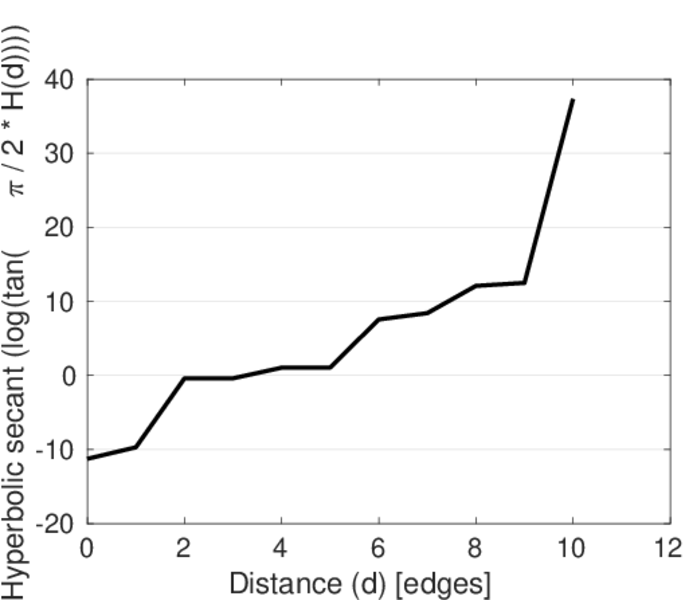
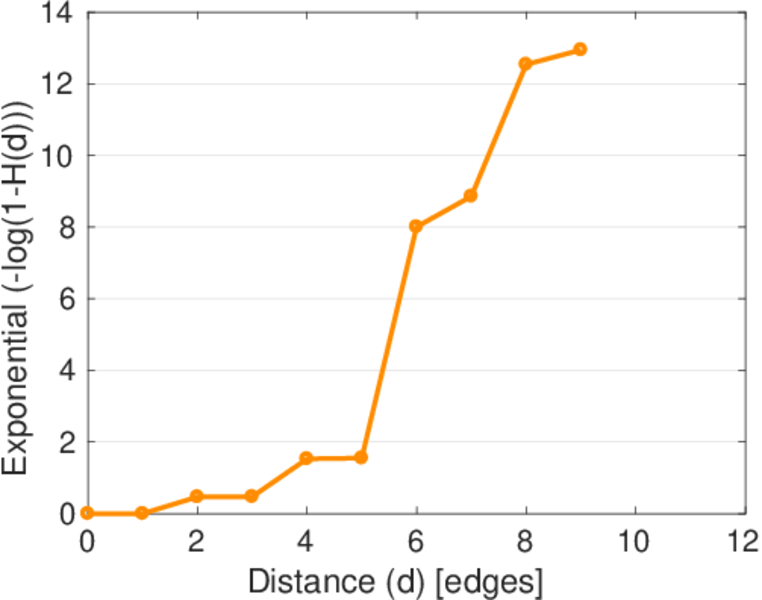
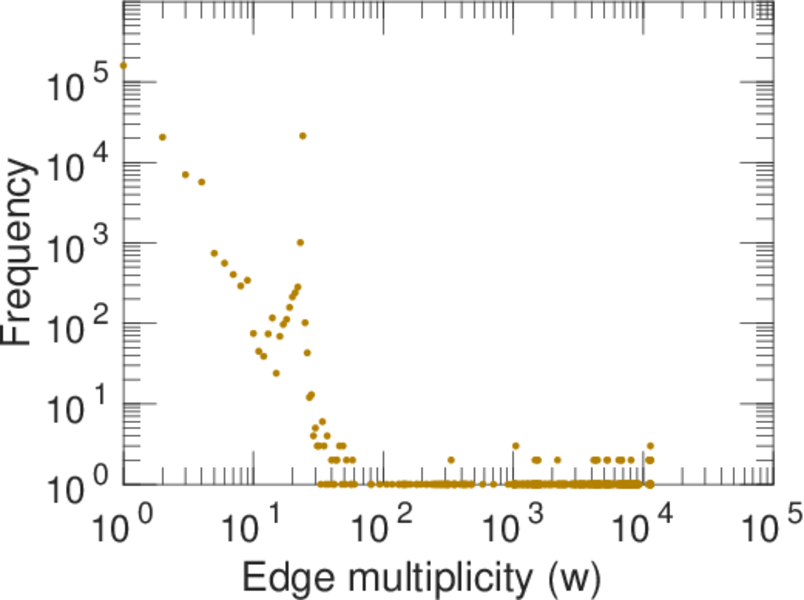
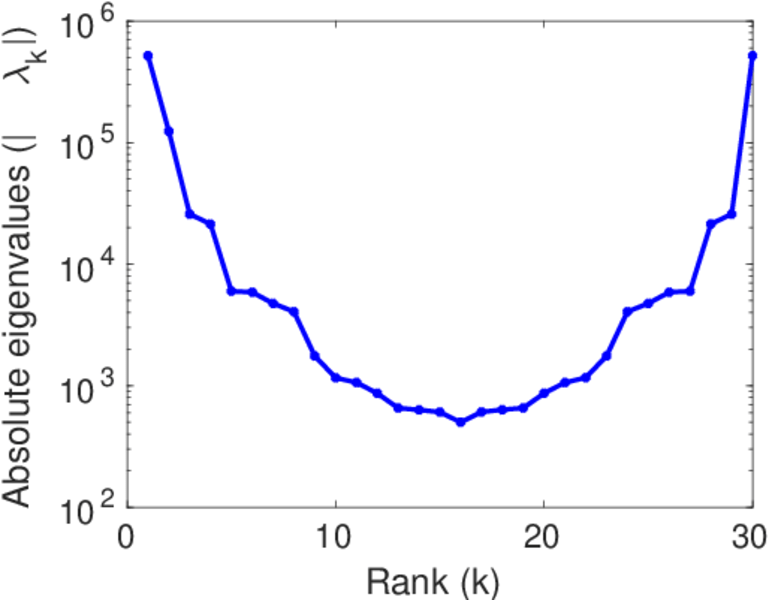
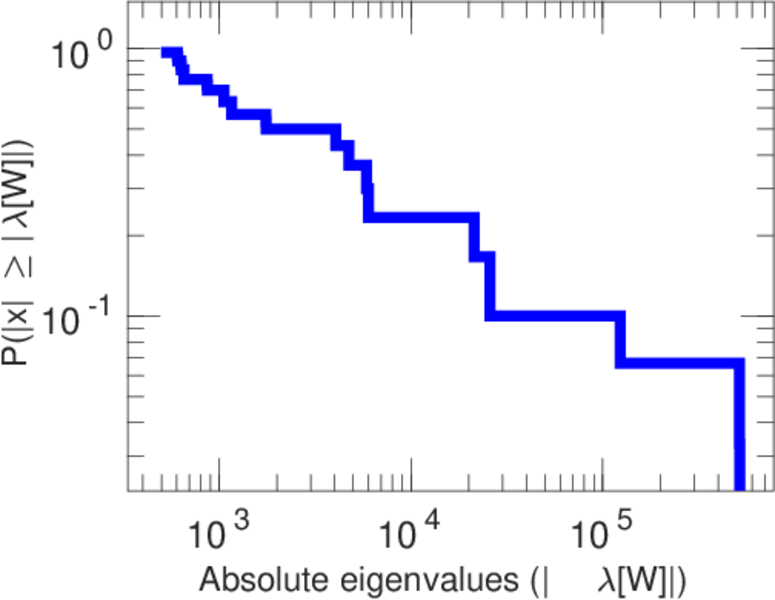
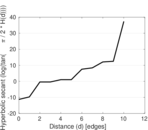
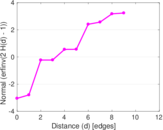
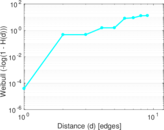
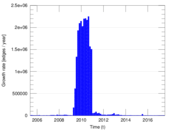
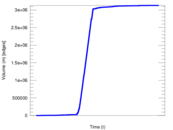
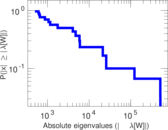
Plots


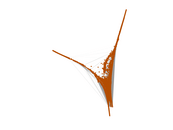
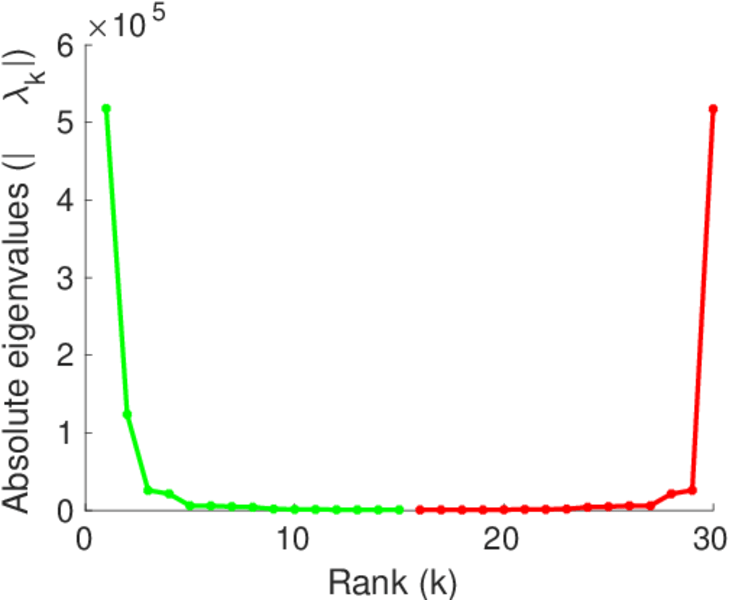
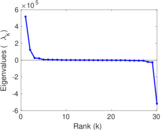
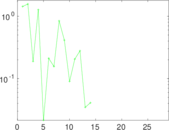
Matrix decompositions plots


Downloads
References
|
[1]
|
Jérôme Kunegis.
KONECT – The Koblenz Network Collection.
In Proc. Int. Conf. on World Wide Web Companion, pages
1343–1350, 2013.
[ http ]
|
|
[2]
|
Wikimedia Foundation.
Wikimedia downloads.
http://dumps.wikimedia.org/, January 2010.
|
 KONECT ‣ Networks ‣
Buy Me a Coffee
KONECT ‣ Networks ‣
Buy Me a Coffee