Wikipedia edits (th)
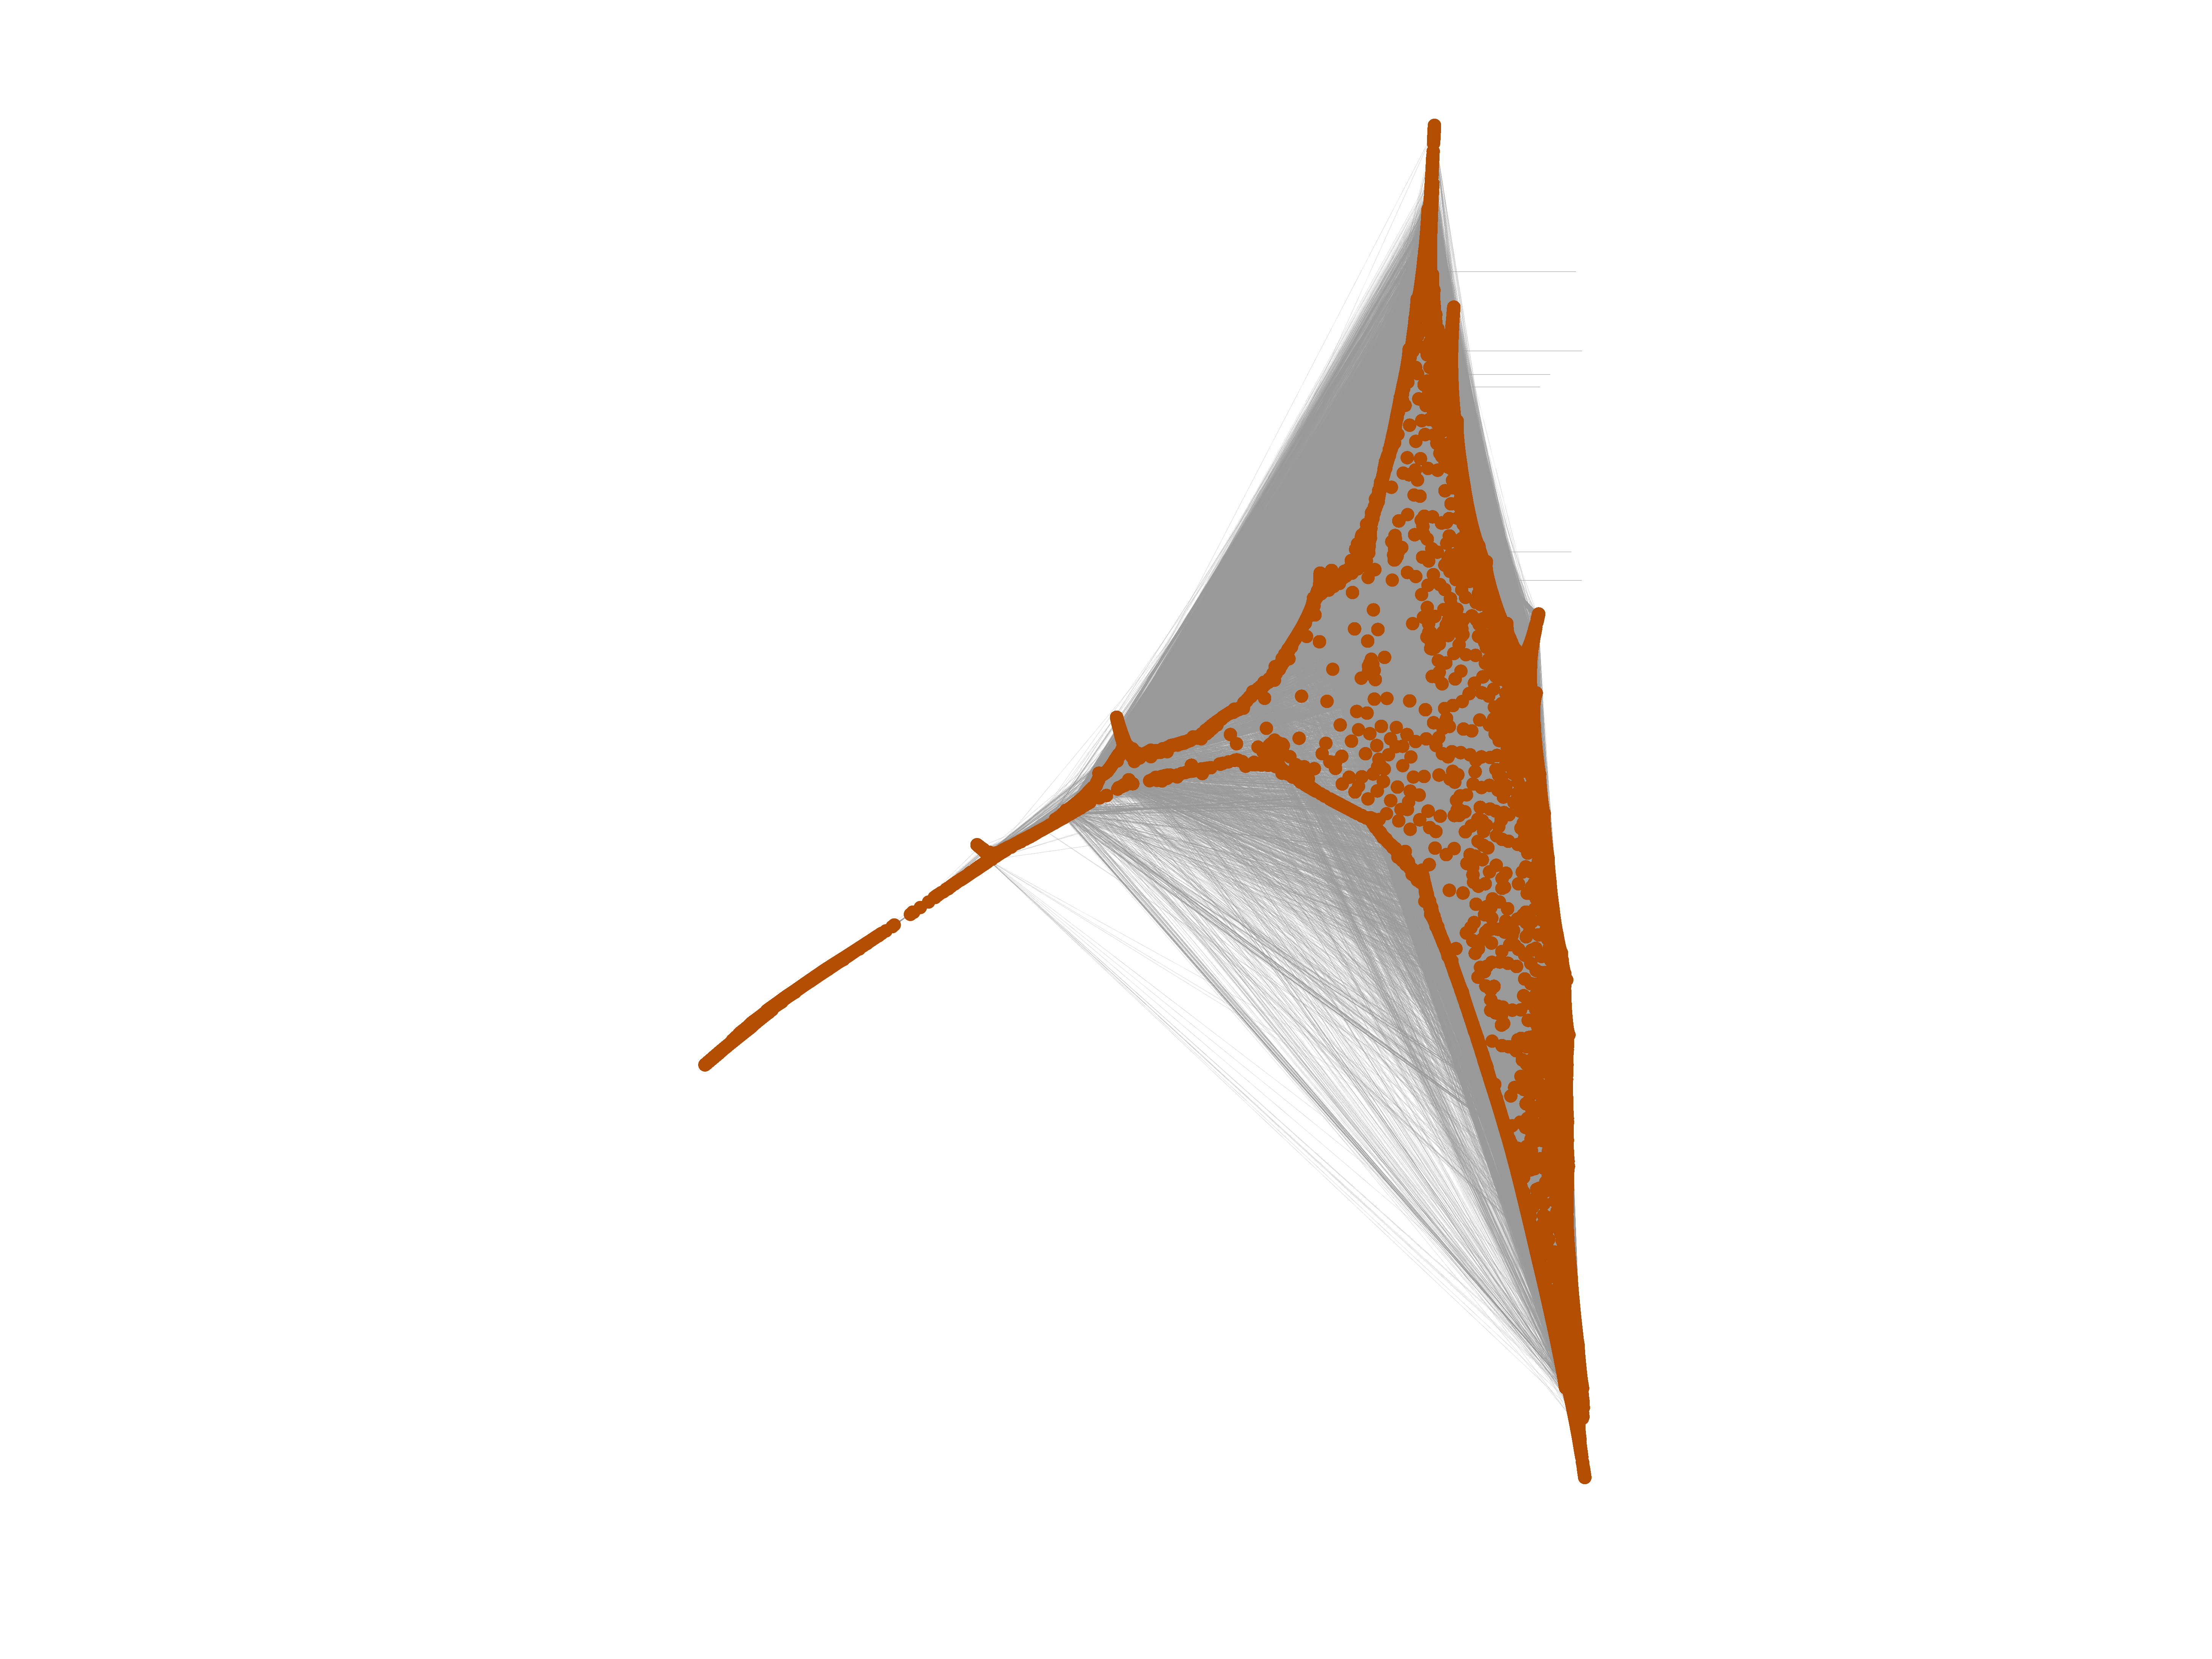
This is the bipartite edit network of the Thai Wikipedia. It contains users and
pages from the Thai Wikipedia, connected by edit events. Each edge represents
an edit. The dataset includes the timestamp of each edit.
Metadata
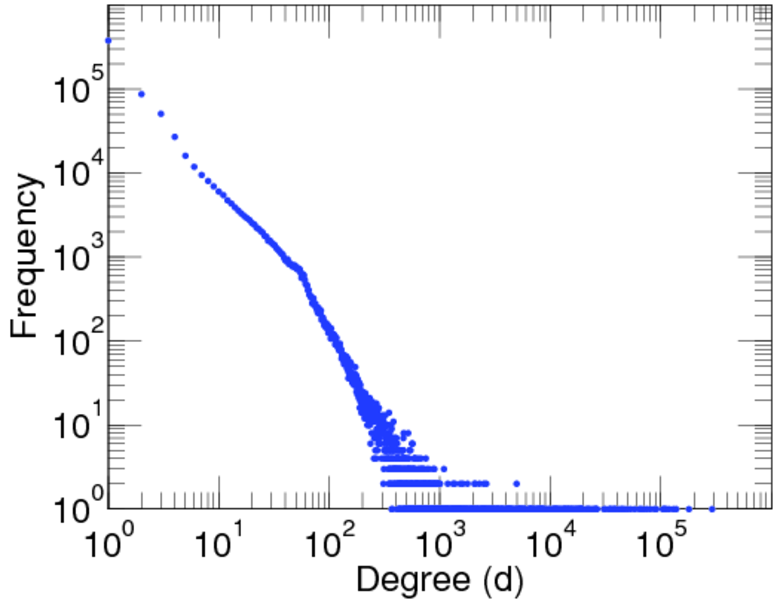
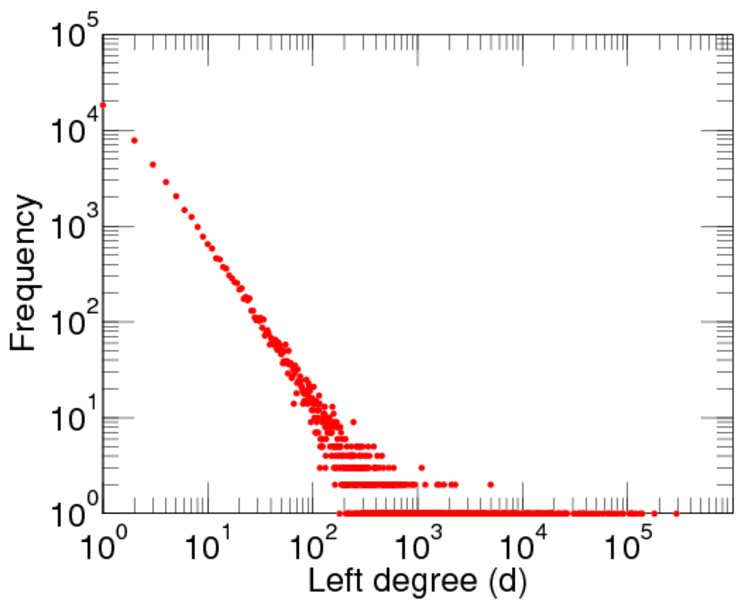
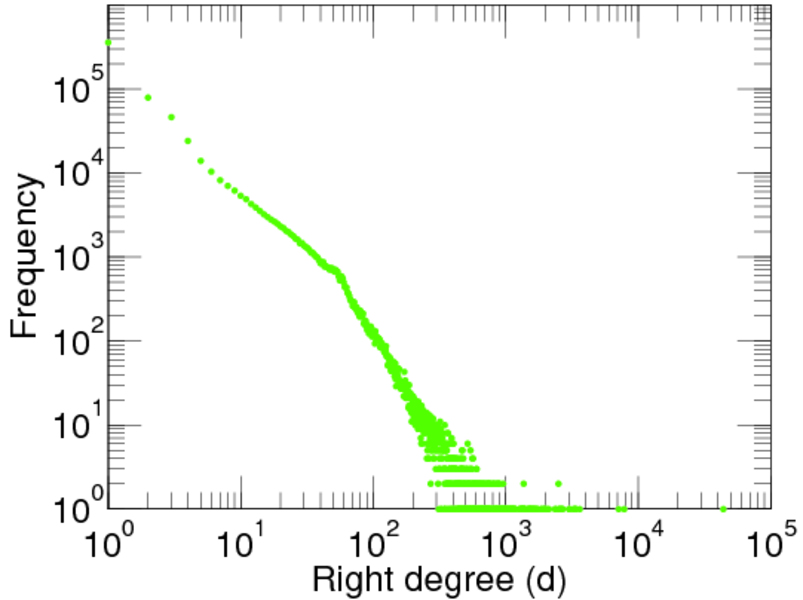
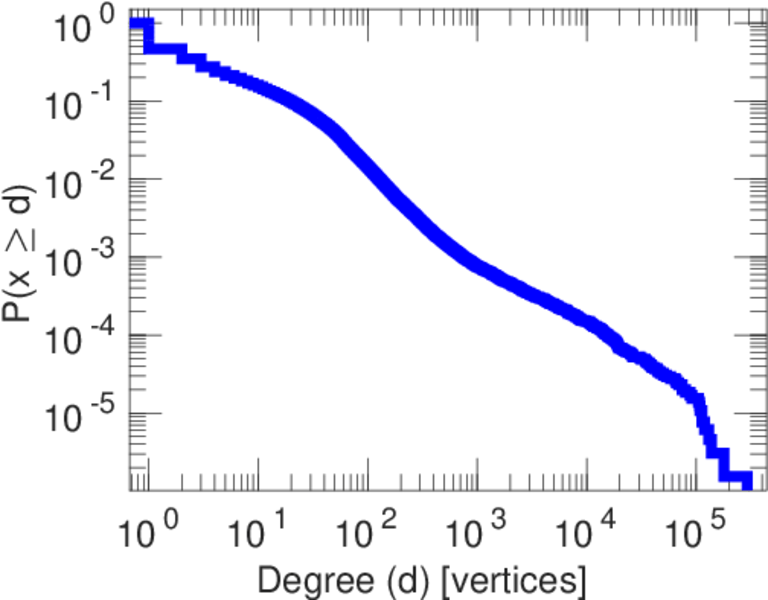
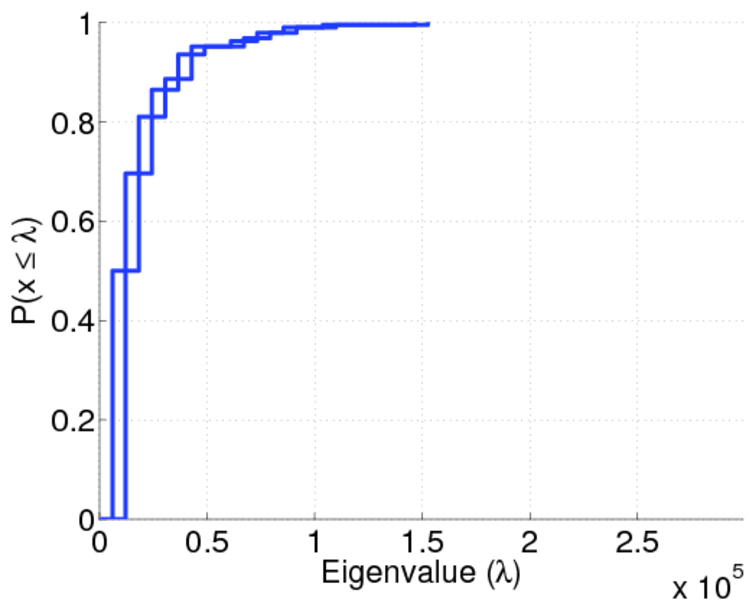
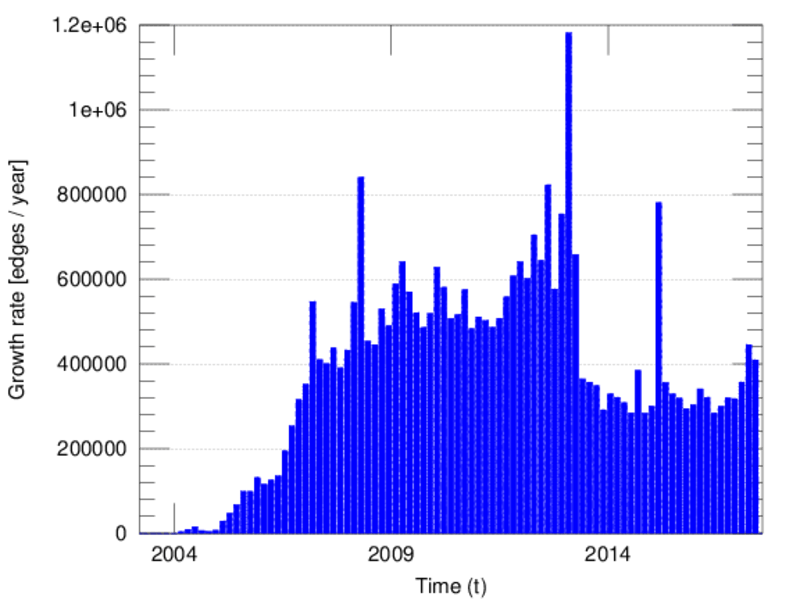
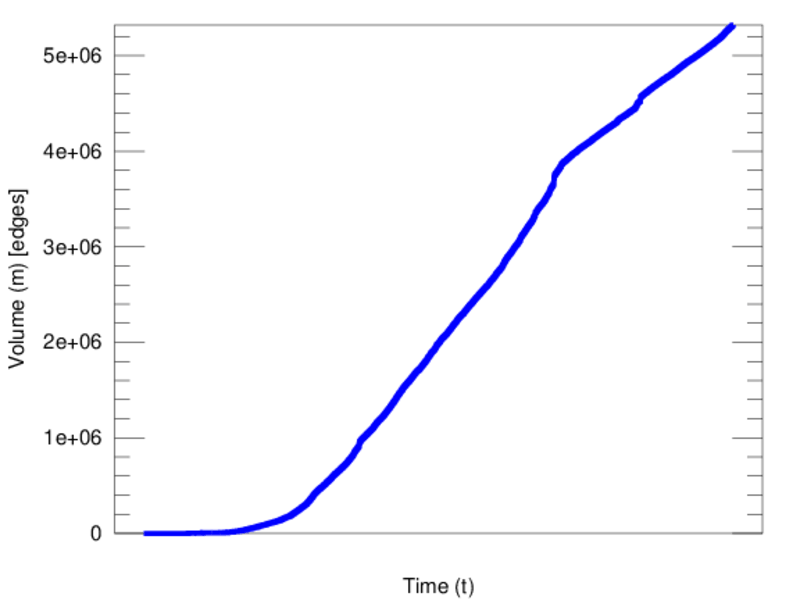
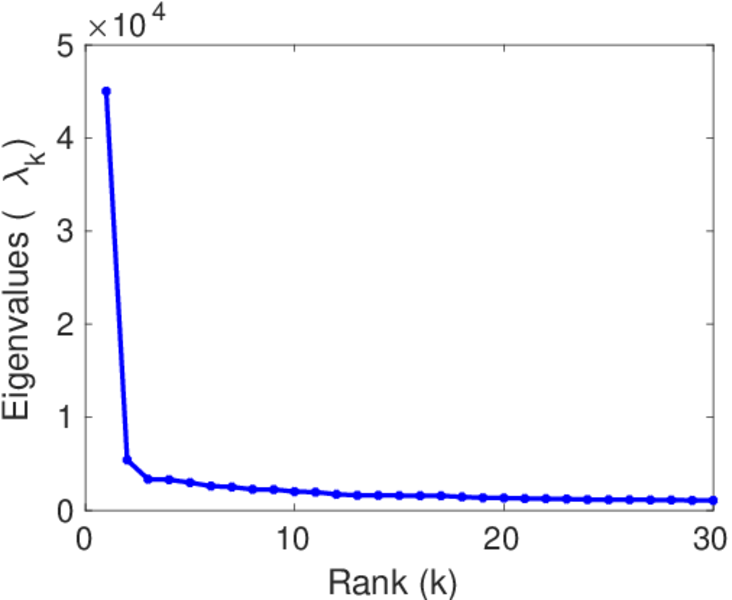
Statistics
| Size | n = | 712,316
|
| Left size | n1 = | 50,052
|
| Right size | n2 = | 662,264
|
| Volume | m = | 5,320,770
|
| Unique edge count | m̿ = | 2,311,227
|
| Wedge count | s = | 42,580,456,668
|
| Claw count | z = | 1,472,867,339,966,499
|
| Cross count | x = | 5.285 48 × 1019
|
| Square count | q = | 35,234,541,178
|
| 4-Tour count | T4 = | 452,202,818,118
|
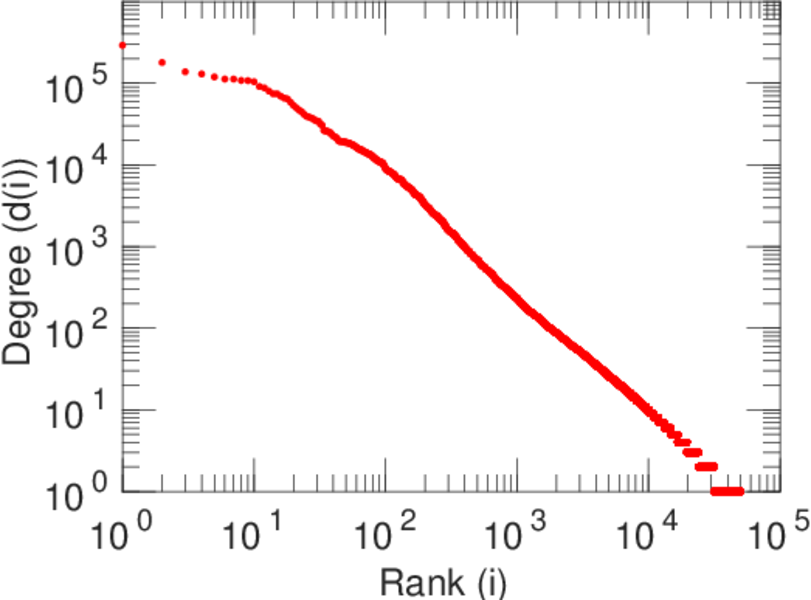
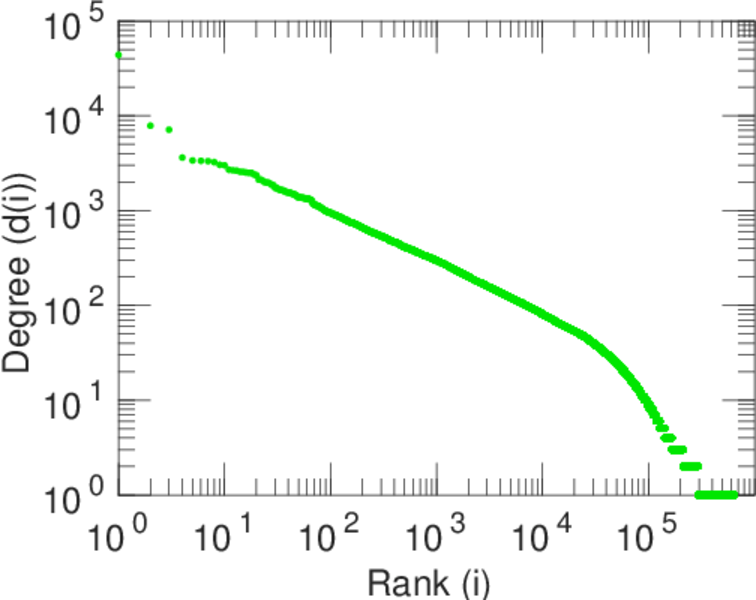
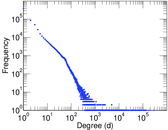
| Maximum degree | dmax = | 291,419
|
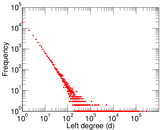
| Maximum left degree | d1max = | 291,419
|
| Maximum right degree | d2max = | 43,908
|
| Average degree | d = | 14.939 4
|
| Average left degree | d1 = | 106.305
|
| Average right degree | d2 = | 8.034 21
|
| Fill | p = | 6.972 52 × 10−5
|
| Average edge multiplicity | m̃ = | 2.302 14
|
| Size of LCC | N = | 686,748
|
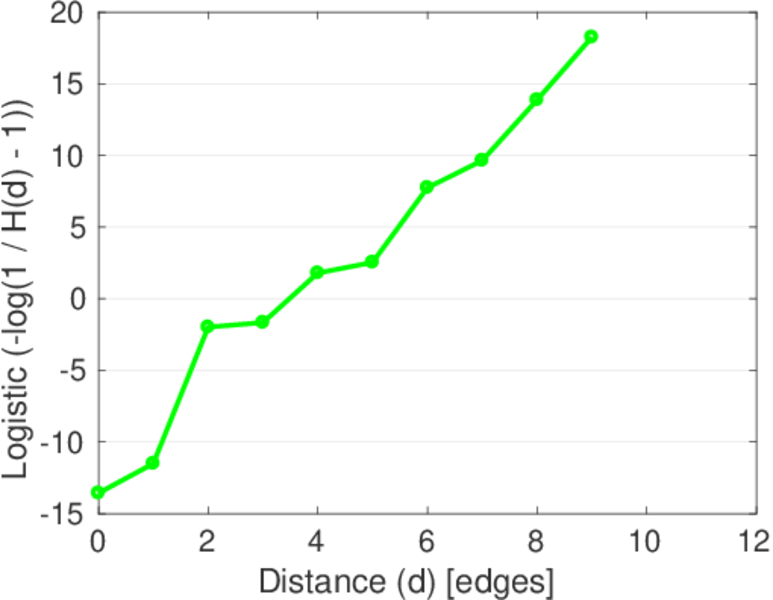
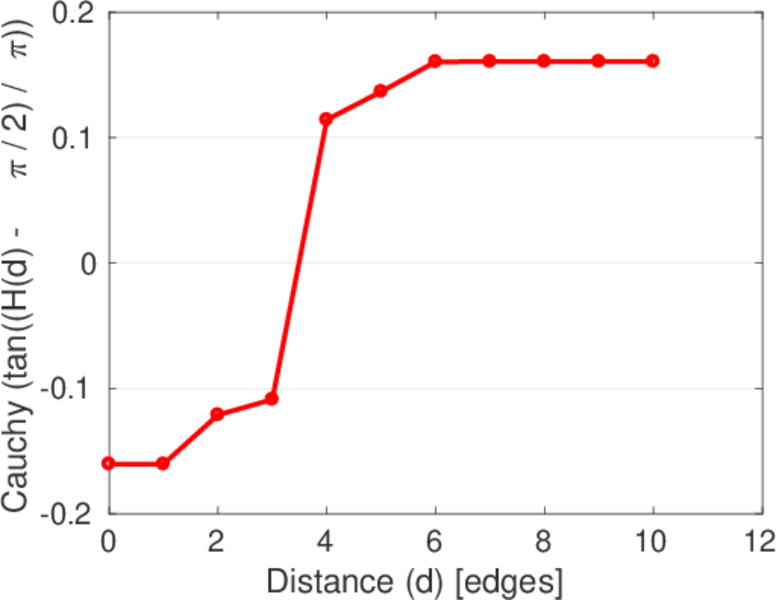
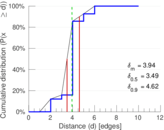
| Diameter | δ = | 13
|
| 50-Percentile effective diameter | δ0.5 = | 3.488 52
|
| 90-Percentile effective diameter | δ0.9 = | 4.618 83
|
| Median distance | δM = | 4
|
| Mean distance | δm = | 3.937 14
|
| Balanced inequality ratio | P = | 0.120 802
|
| Left balanced inequality ratio | P1 = | 0.050 592 3
|
| Right balanced inequality ratio | P2 = | 0.171 508
|
| Relative edge distribution entropy | Her = | 0.723 187
|
| Tail power law exponent | γt = | 1.971 00
|
| Degree assortativity | ρ = | −0.115 892
|
| Degree assortativity p-value | pρ = | 0.000 00
|
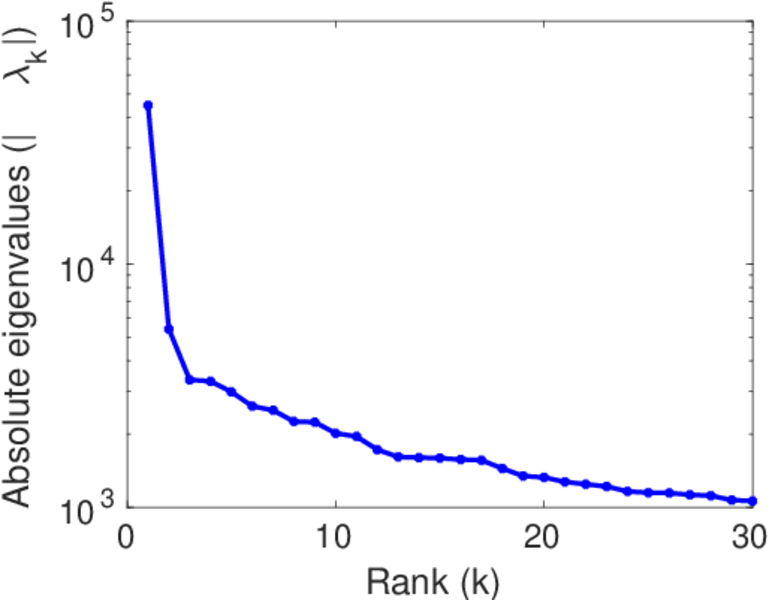
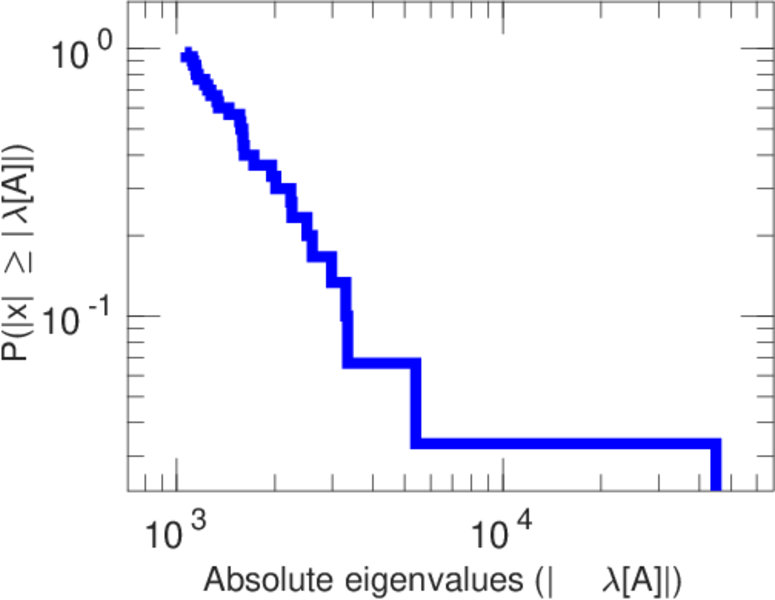
| Spectral norm | α = | 45,011.0
|
| Algebraic connectivity | a = | 0.037 998 4
|
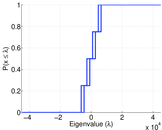
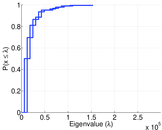
| Spectral separation | |λ1[A] / λ2[A]| = | 8.322 51
|
| Controllability | C = | 624,099
|
| Relative controllability | Cr = | 0.891 098
|
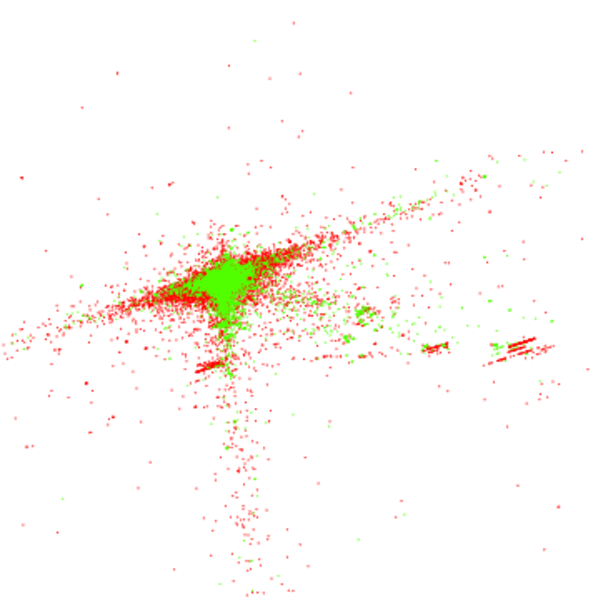
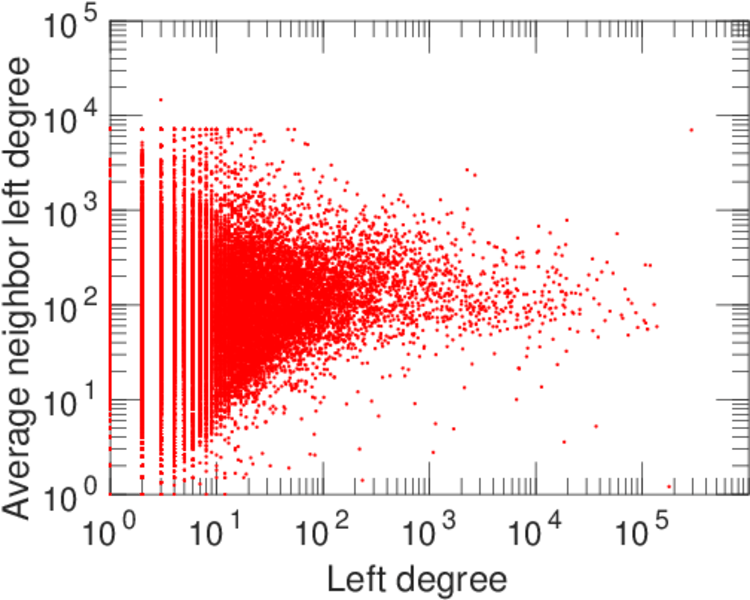
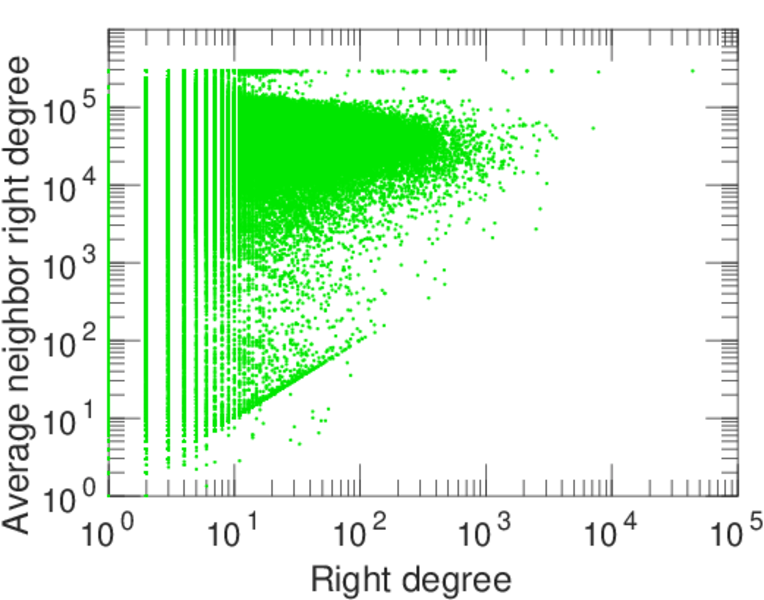
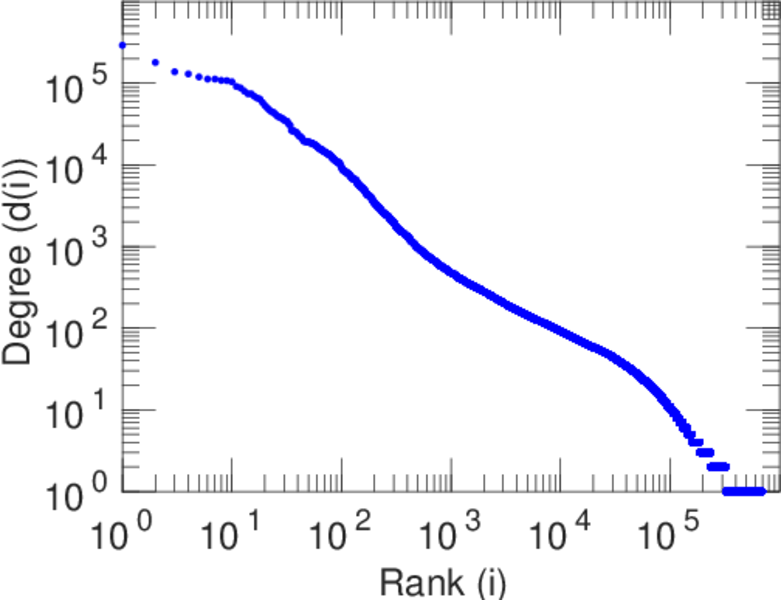
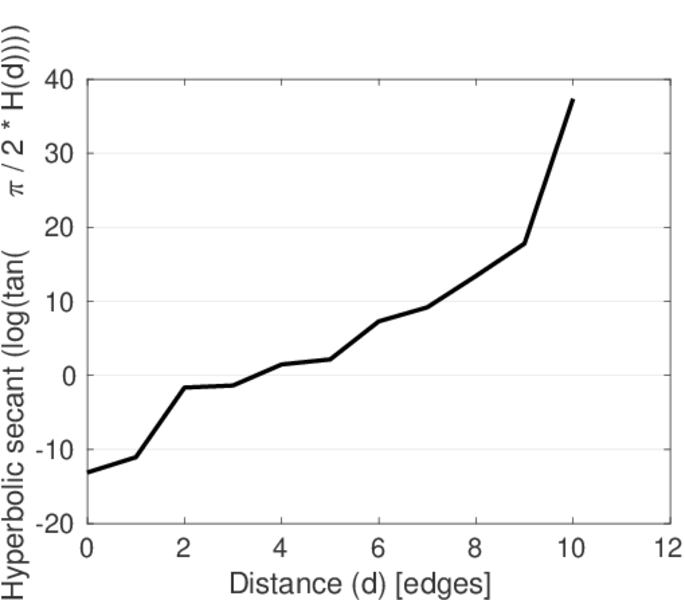
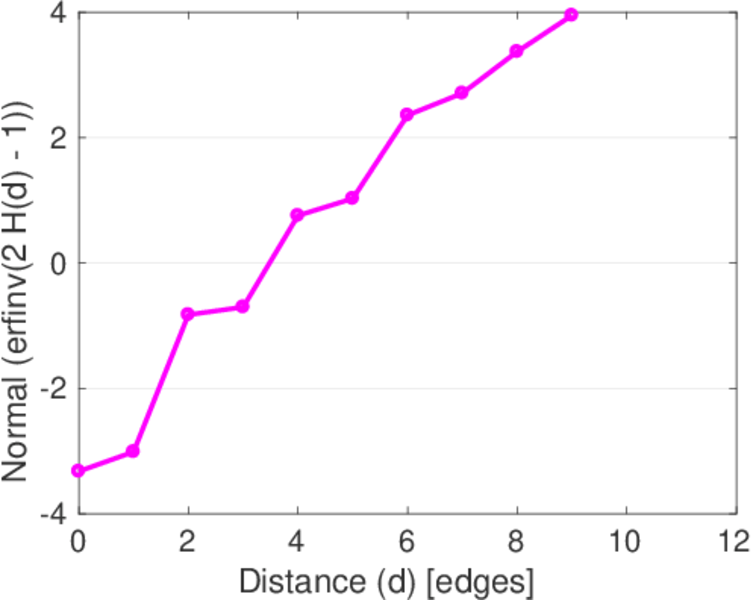
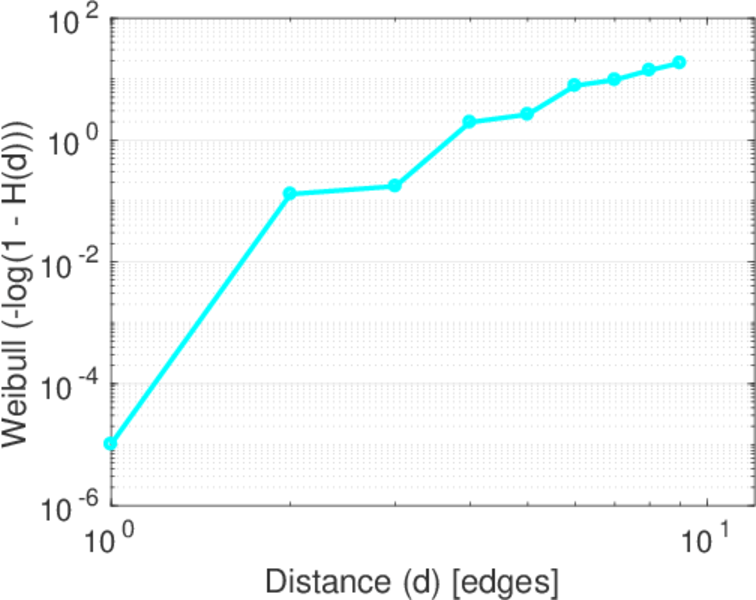
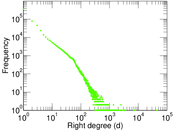
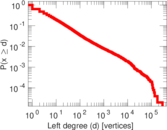
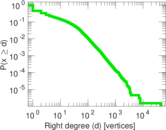
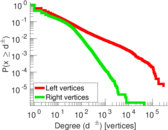
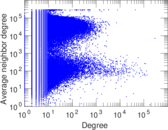
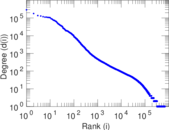
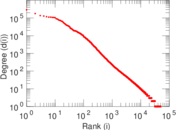
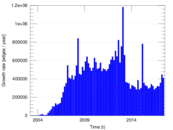
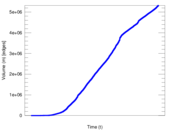
Plots


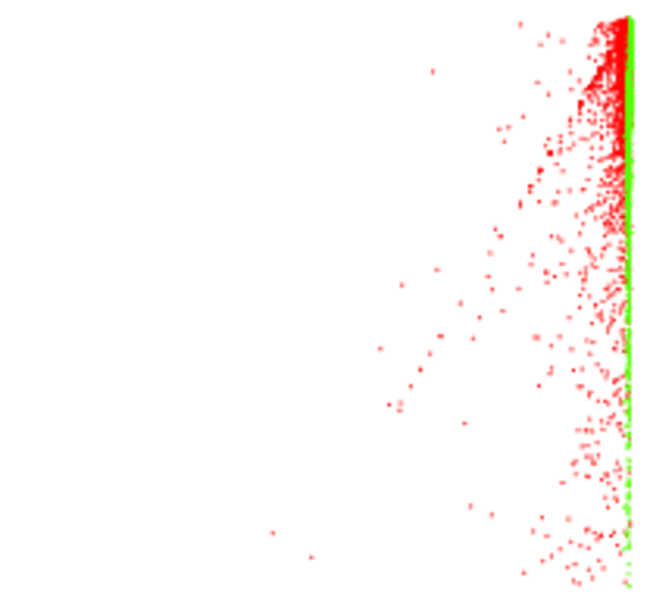
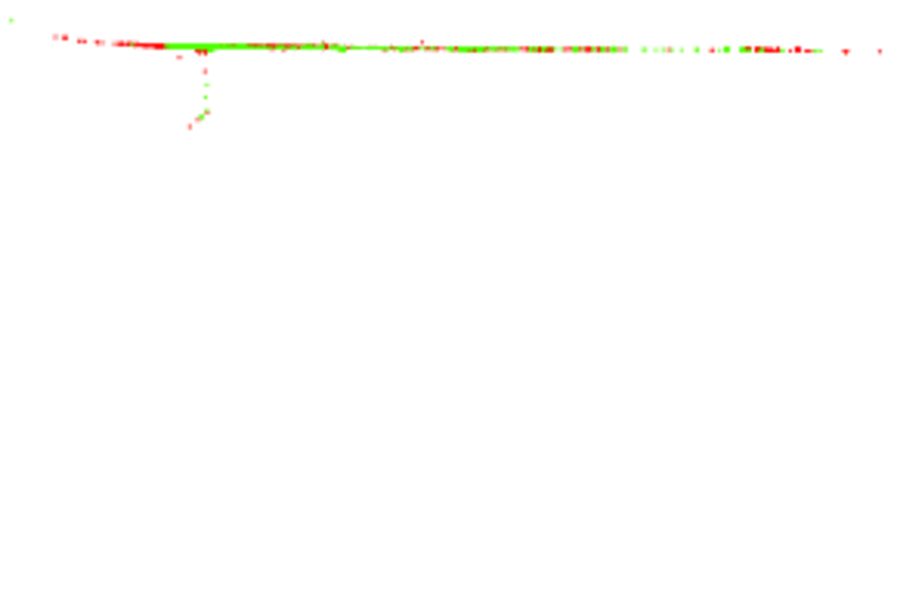
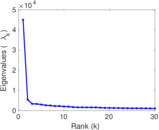
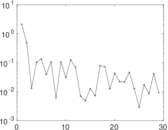
Matrix decompositions plots


Downloads
References
|
[1]
|
Jérôme Kunegis.
KONECT – The Koblenz Network Collection.
In Proc. Int. Conf. on World Wide Web Companion, pages
1343–1350, 2013.
[ http ]
|
|
[2]
|
Wikimedia Foundation.
Wikimedia downloads.
http://dumps.wikimedia.org/, January 2010.
|
 KONECT ‣ Networks ‣
Buy Me a Coffee
KONECT ‣ Networks ‣
Buy Me a Coffee