Wikipedia edits (uk)
This is the bipartite edit network of the Ukrainian Wikipedia. It contains
users and pages from the Ukrainian Wikipedia, connected by edit events. Each
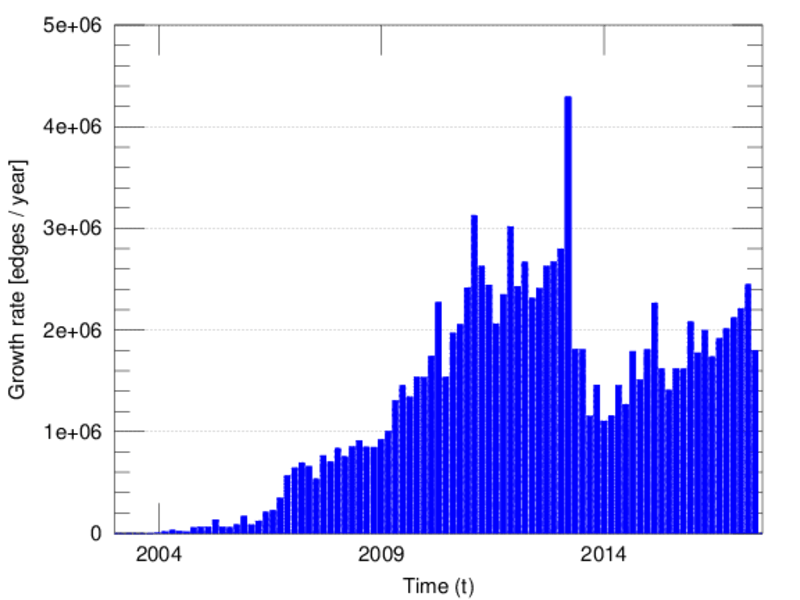
edge represents an edit. The dataset includes the timestamp of each edit.
Metadata
Statistics
| Size | n = | 2,219,329
|
| Left size | n1 = | 76,189
|
| Right size | n2 = | 2,143,140
|
| Volume | m = | 18,633,506
|
| Unique edge count | m̿ = | 8,722,254
|
| Wedge count | s = | 262,537,172,993
|
| Cross count | x = | 6.755 54 × 1020
|
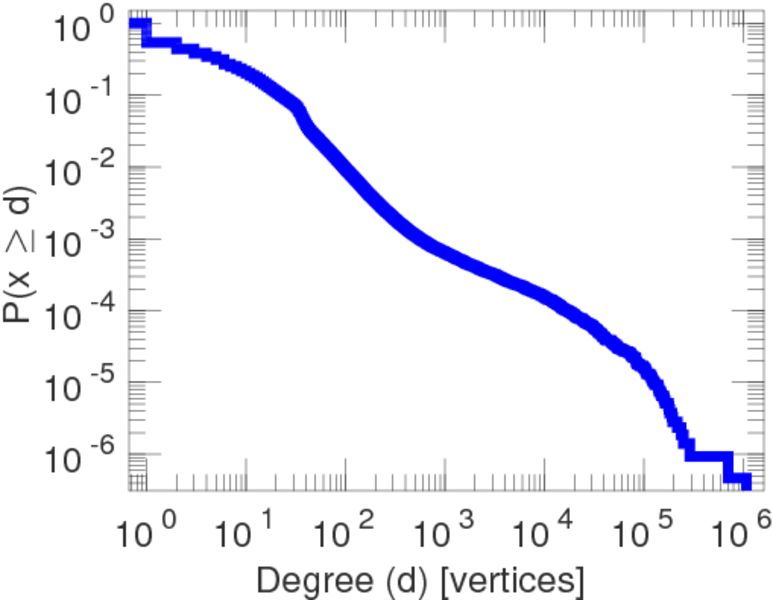
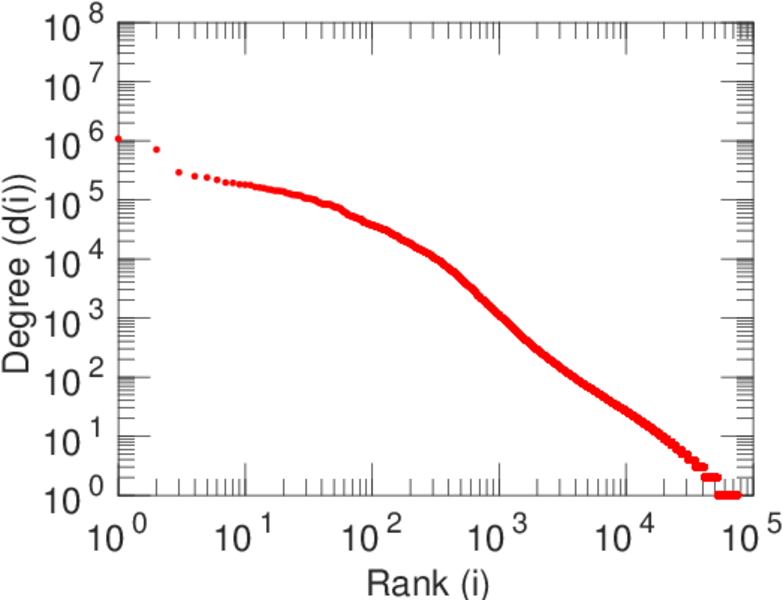
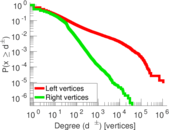
| Maximum degree | dmax = | 1,076,090
|
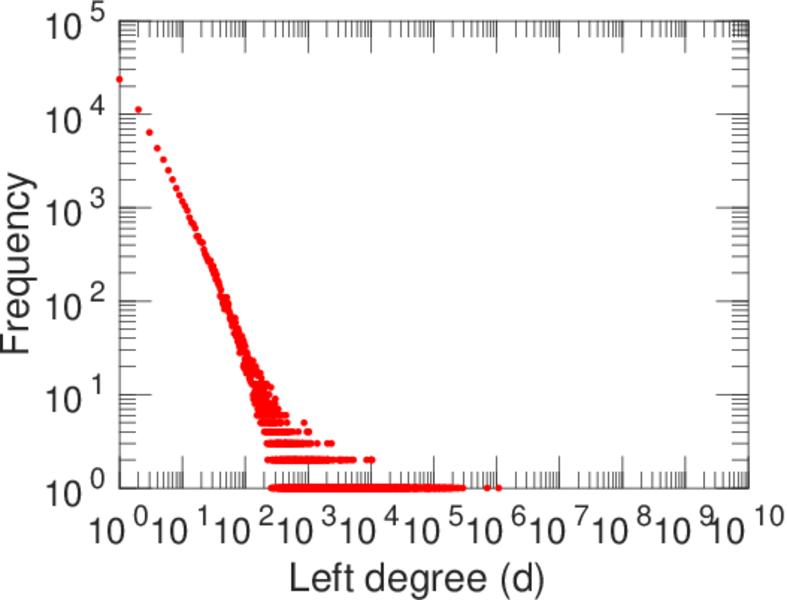
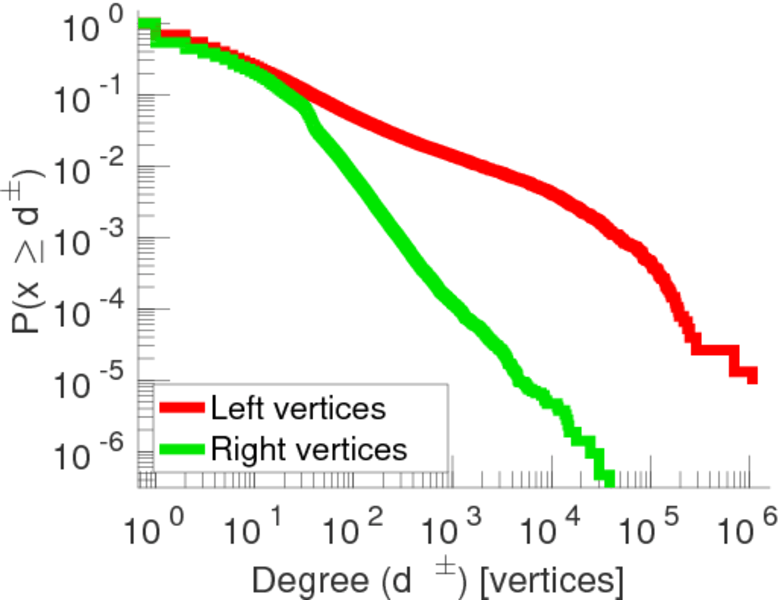
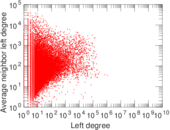
| Maximum left degree | d1max = | 1,076,090
|
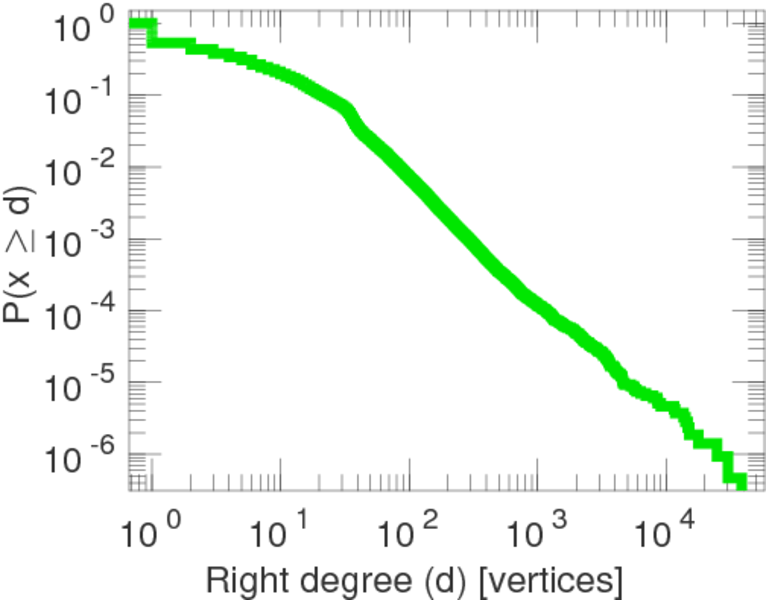
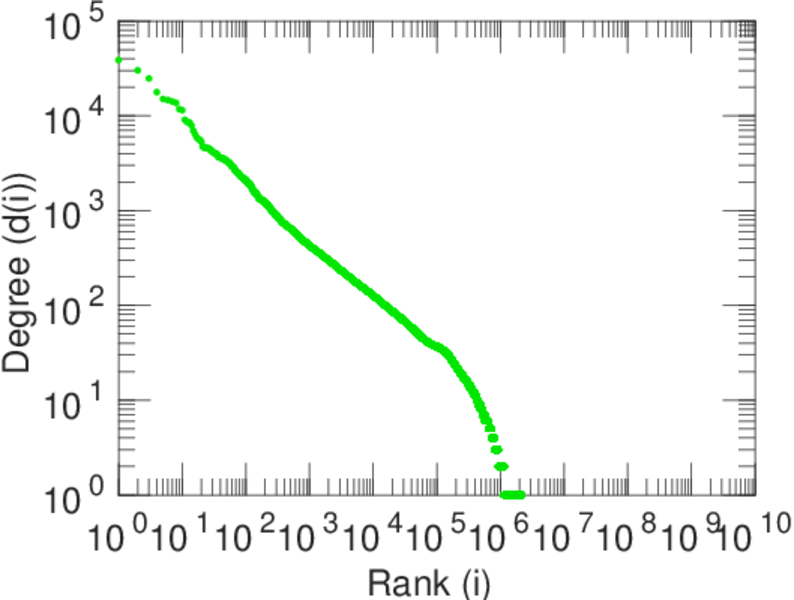
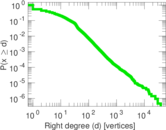
| Maximum right degree | d2max = | 38,678
|
| Average degree | d = | 16.792 0
|
| Average left degree | d1 = | 244.570
|
| Average right degree | d2 = | 8.694 49
|
| Fill | p = | 5.341 78 × 10−5
|
| Average edge multiplicity | m̃ = | 2.136 32
|
| Size of LCC | N = | 2,195,385
|
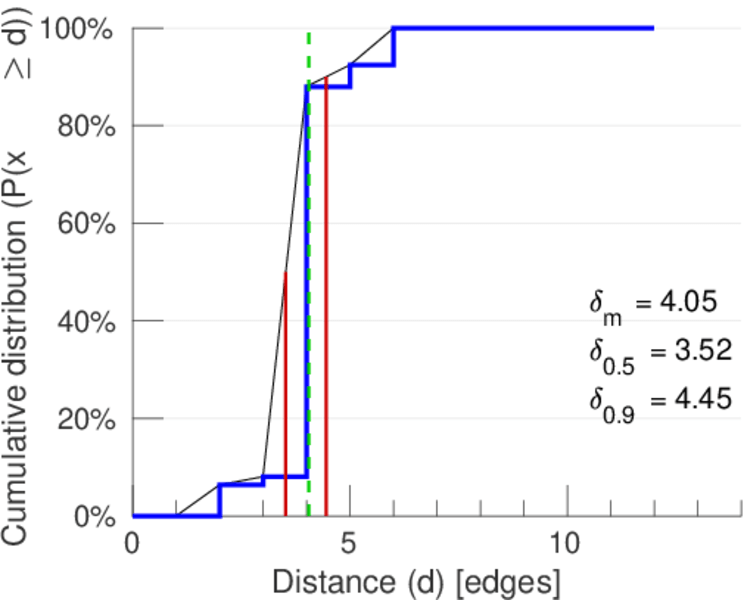
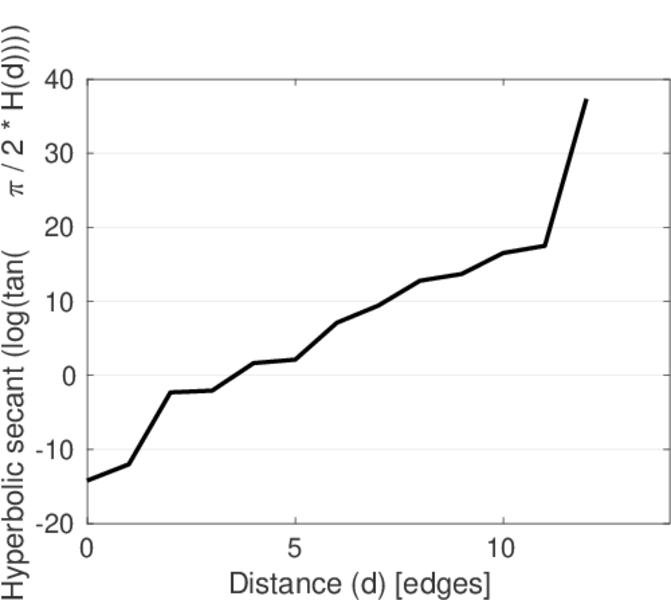
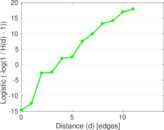
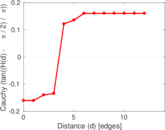
| Diameter | δ = | 14
|
| 50-Percentile effective diameter | δ0.5 = | 3.524 83
|
| 90-Percentile effective diameter | δ0.9 = | 4.454 21
|
| Median distance | δM = | 4
|
| Mean distance | δm = | 4.052 34
|
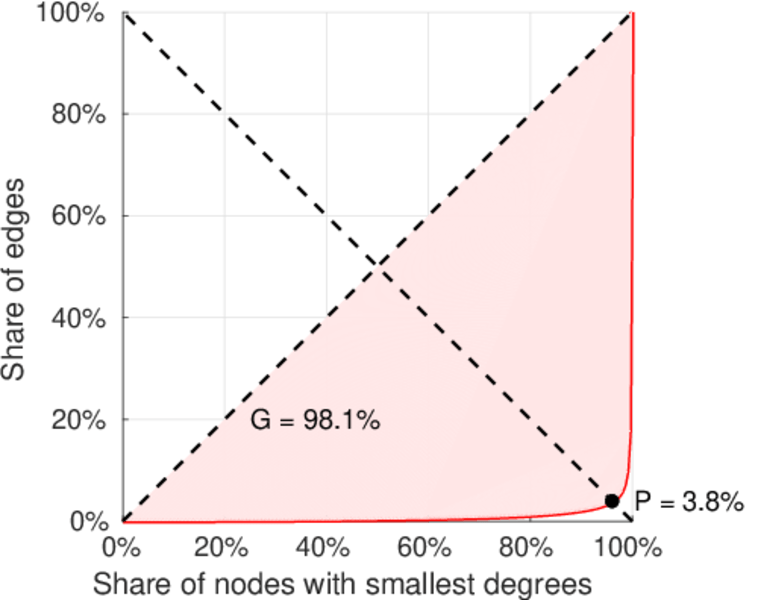
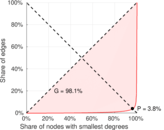
| Gini coefficient | G = | 0.858 419
|
| Balanced inequality ratio | P = | 0.145 902
|
| Left balanced inequality ratio | P1 = | 0.037 934 2
|
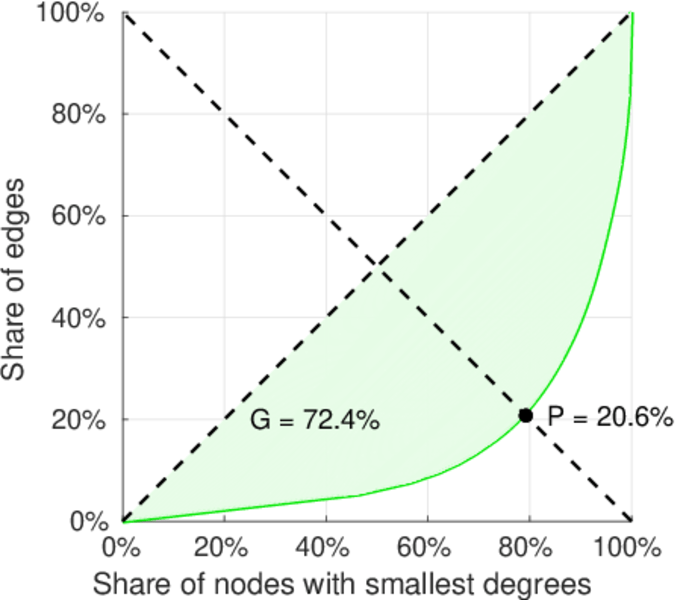
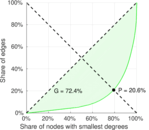
| Right balanced inequality ratio | P2 = | 0.205 978
|
| Relative edge distribution entropy | Her = | 0.729 875
|
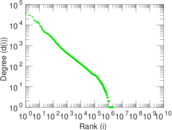
| Power law exponent | γ = | 2.295 04
|
| Tail power law exponent | γt = | 3.001 00
|
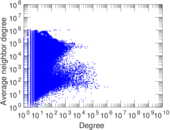
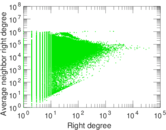
| Degree assortativity | ρ = | −0.104 822
|
| Degree assortativity p-value | pρ = | 0.000 00
|
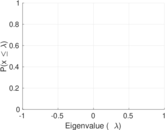
| Spectral norm | α = | 16,802.6
|
| Controllability | C = | 2,073,584
|
| Relative controllability | Cr = | 0.938 715
|
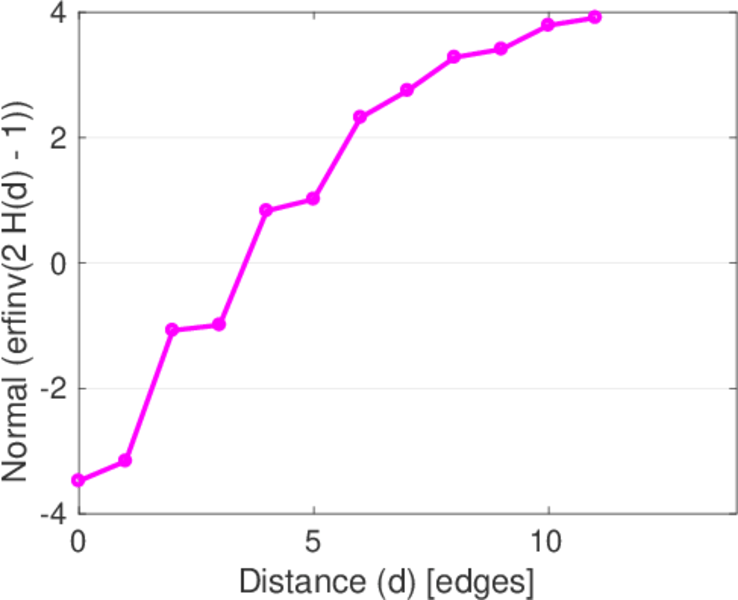
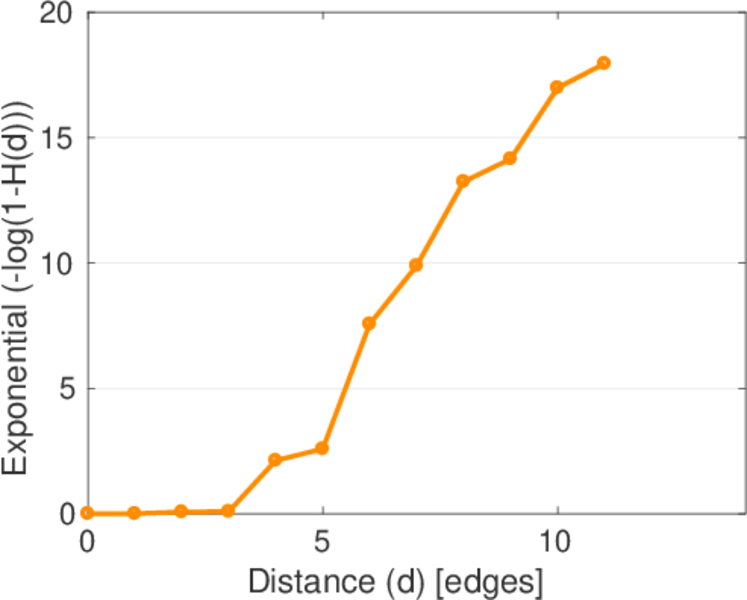
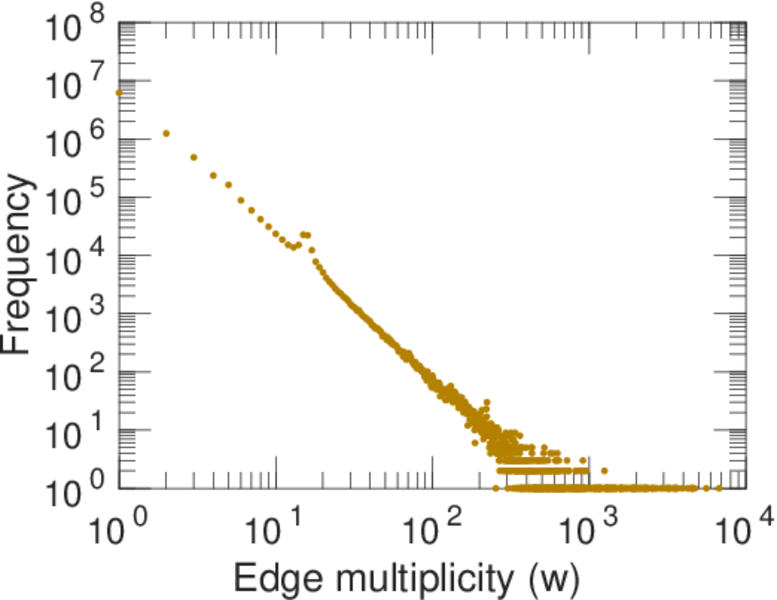
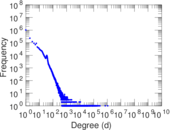
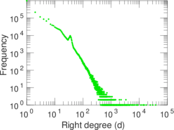
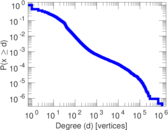
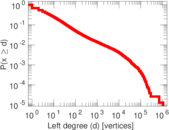
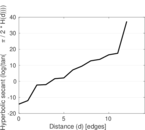
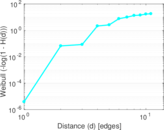
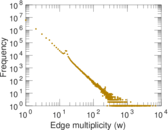
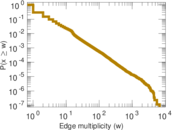
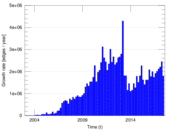
Plots


Downloads
References
|
[1]
|
Jérôme Kunegis.
KONECT – The Koblenz Network Collection.
In Proc. Int. Conf. on World Wide Web Companion, pages
1343–1350, 2013.
[ http ]
|
|
[2]
|
Wikimedia Foundation.
Wikimedia downloads.
http://dumps.wikimedia.org/, January 2010.
|
 KONECT ‣ Networks ‣
Buy Me a Coffee
KONECT ‣ Networks ‣
Buy Me a Coffee