Wikipedia edits (vi)
This is the bipartite edit network of the Vietnamese Wikipedia. It contains
users and pages from the Vietnamese Wikipedia, connected by edit events. Each
edge represents an edit. The dataset includes the timestamp of each edit.
Metadata
Statistics
| Size | n = | 3,585,652
|
| Left size | n1 = | 72,931
|
| Right size | n2 = | 3,512,721
|
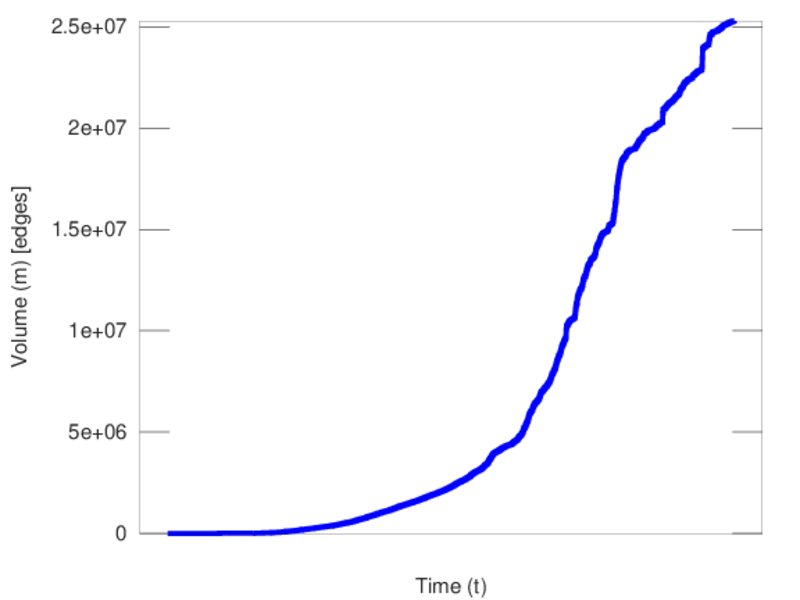
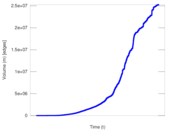
| Volume | m = | 25,286,492
|
| Unique edge count | m̿ = | 13,652,888
|
| Wedge count | s = | 6,664,278,837,076
|
| Claw count | z = | 3,795,205,544,172,848,640
|
| Cross count | x = | 1.794 75 × 1024
|
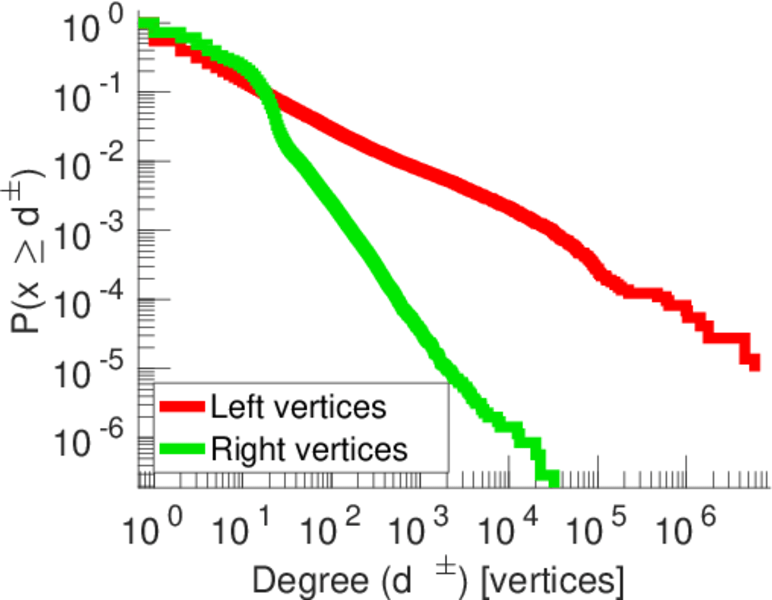
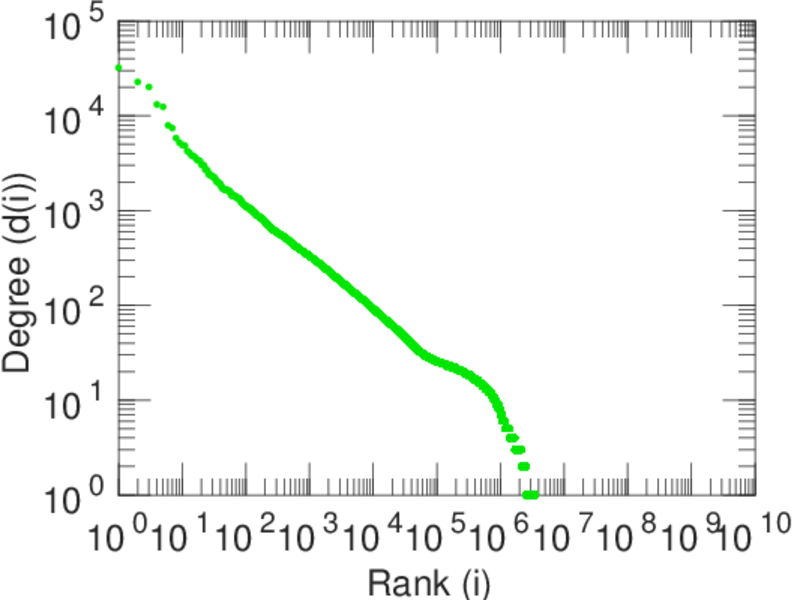
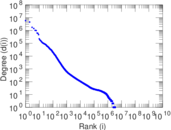
| Maximum degree | dmax = | 5,902,991
|
| Maximum left degree | d1max = | 5,902,991
|
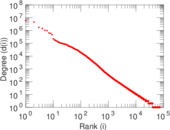
| Maximum right degree | d2max = | 32,169
|
| Average degree | d = | 14.104 3
|
| Average left degree | d1 = | 346.718
|
| Average right degree | d2 = | 7.198 55
|
| Fill | p = | 5.329 28 × 10−5
|
| Average edge multiplicity | m̃ = | 1.852 10
|
| Size of LCC | N = | 3,555,676
|
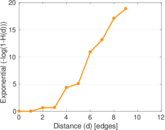
| Diameter | δ = | 12
|
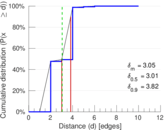
| 50-Percentile effective diameter | δ0.5 = | 3.012 57
|
| 90-Percentile effective diameter | δ0.9 = | 3.823 05
|
| Median distance | δM = | 4
|
| Mean distance | δm = | 3.048 50
|
| Gini coefficient | G = | 0.793 147
|
| Balanced inequality ratio | P = | 0.191 785
|
| Left balanced inequality ratio | P1 = | 0.018 928 4
|
| Right balanced inequality ratio | P2 = | 0.267 622
|
| Relative edge distribution entropy | Her = | 0.658 974
|
| Power law exponent | γ = | 2.017 17
|
| Degree assortativity | ρ = | −0.051 640 4
|
| Degree assortativity p-value | pρ = | 0.000 00
|
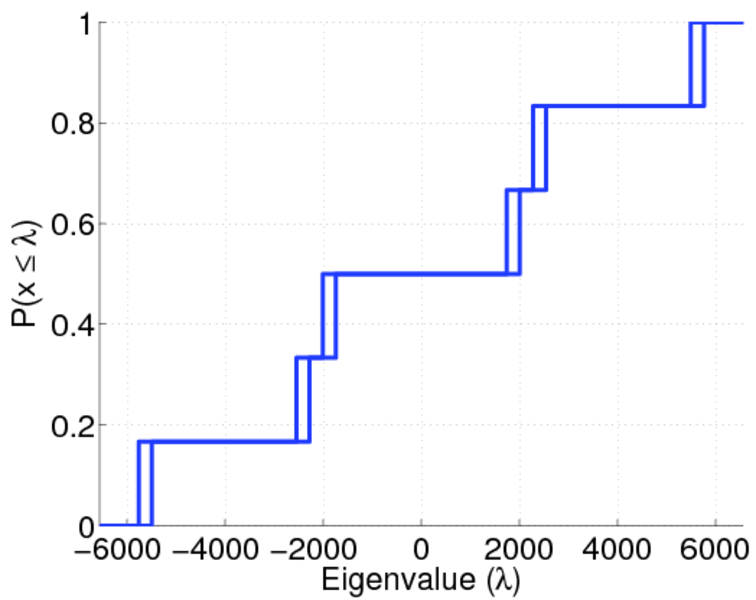
| Spectral norm | α = | 6,565.16
|
| Controllability | C = | 3,469,892
|
| Relative controllability | Cr = | 0.972 273
|
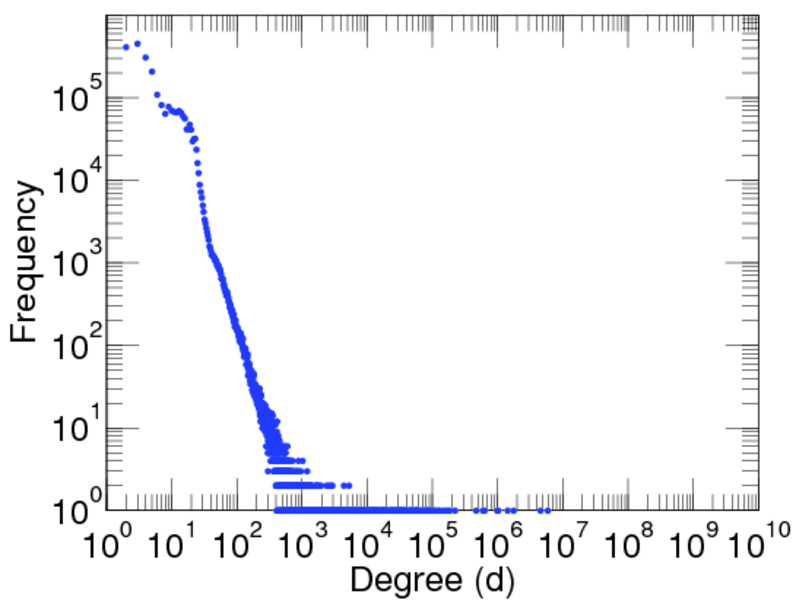
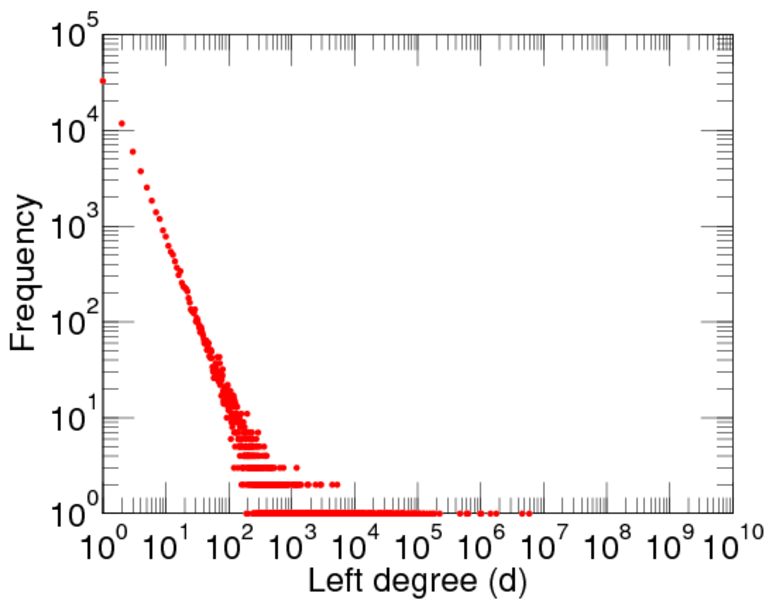
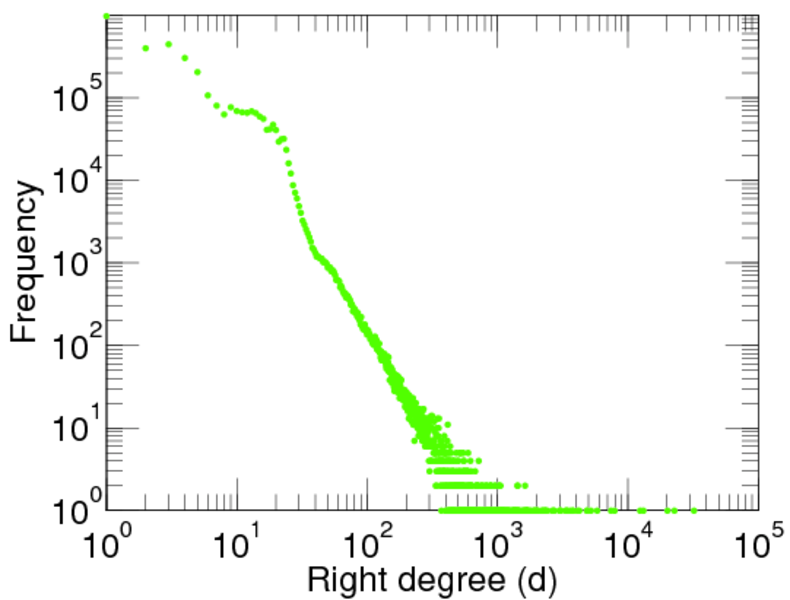
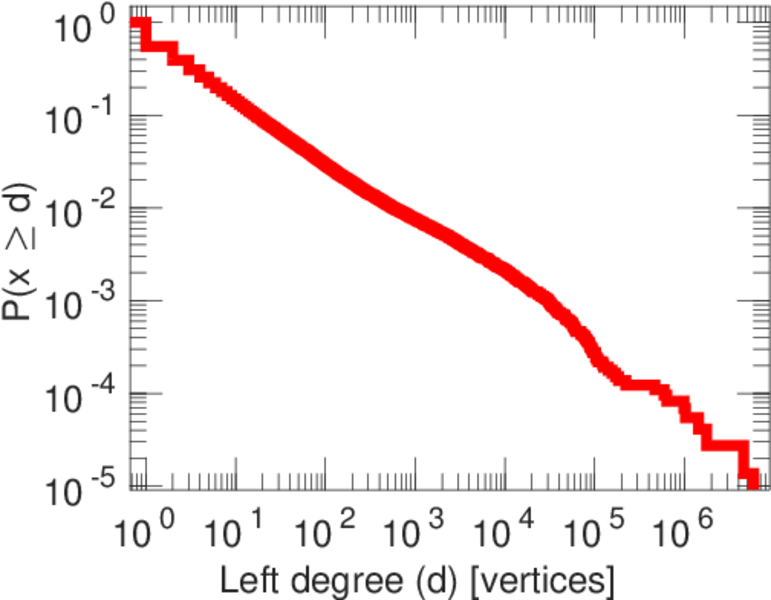
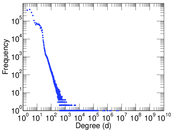
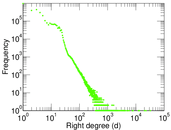
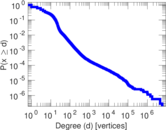
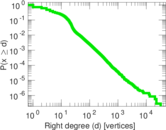
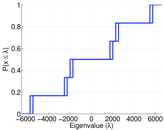
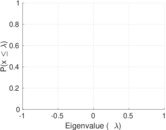
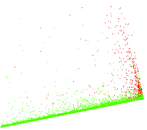
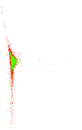
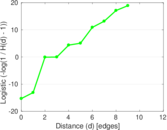
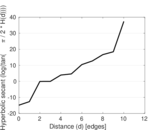
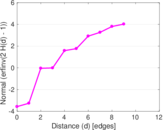
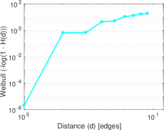
Plots


Downloads
References
|
[1]
|
Jérôme Kunegis.
KONECT – The Koblenz Network Collection.
In Proc. Int. Conf. on World Wide Web Companion, pages
1343–1350, 2013.
[ http ]
|
|
[2]
|
Wikimedia Foundation.
Wikimedia downloads.
http://dumps.wikimedia.org/, January 2010.
|
 KONECT ‣ Networks ‣
Buy Me a Coffee
KONECT ‣ Networks ‣
Buy Me a Coffee