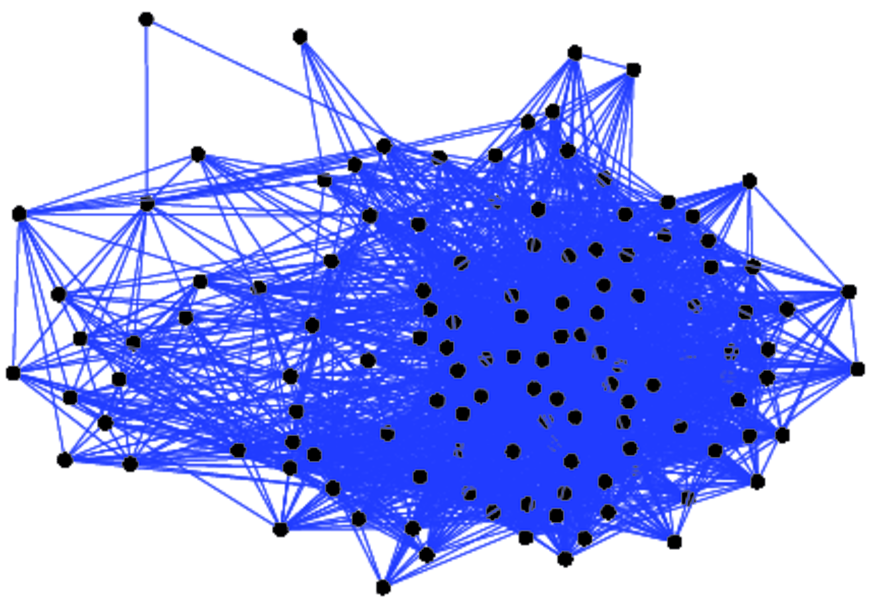
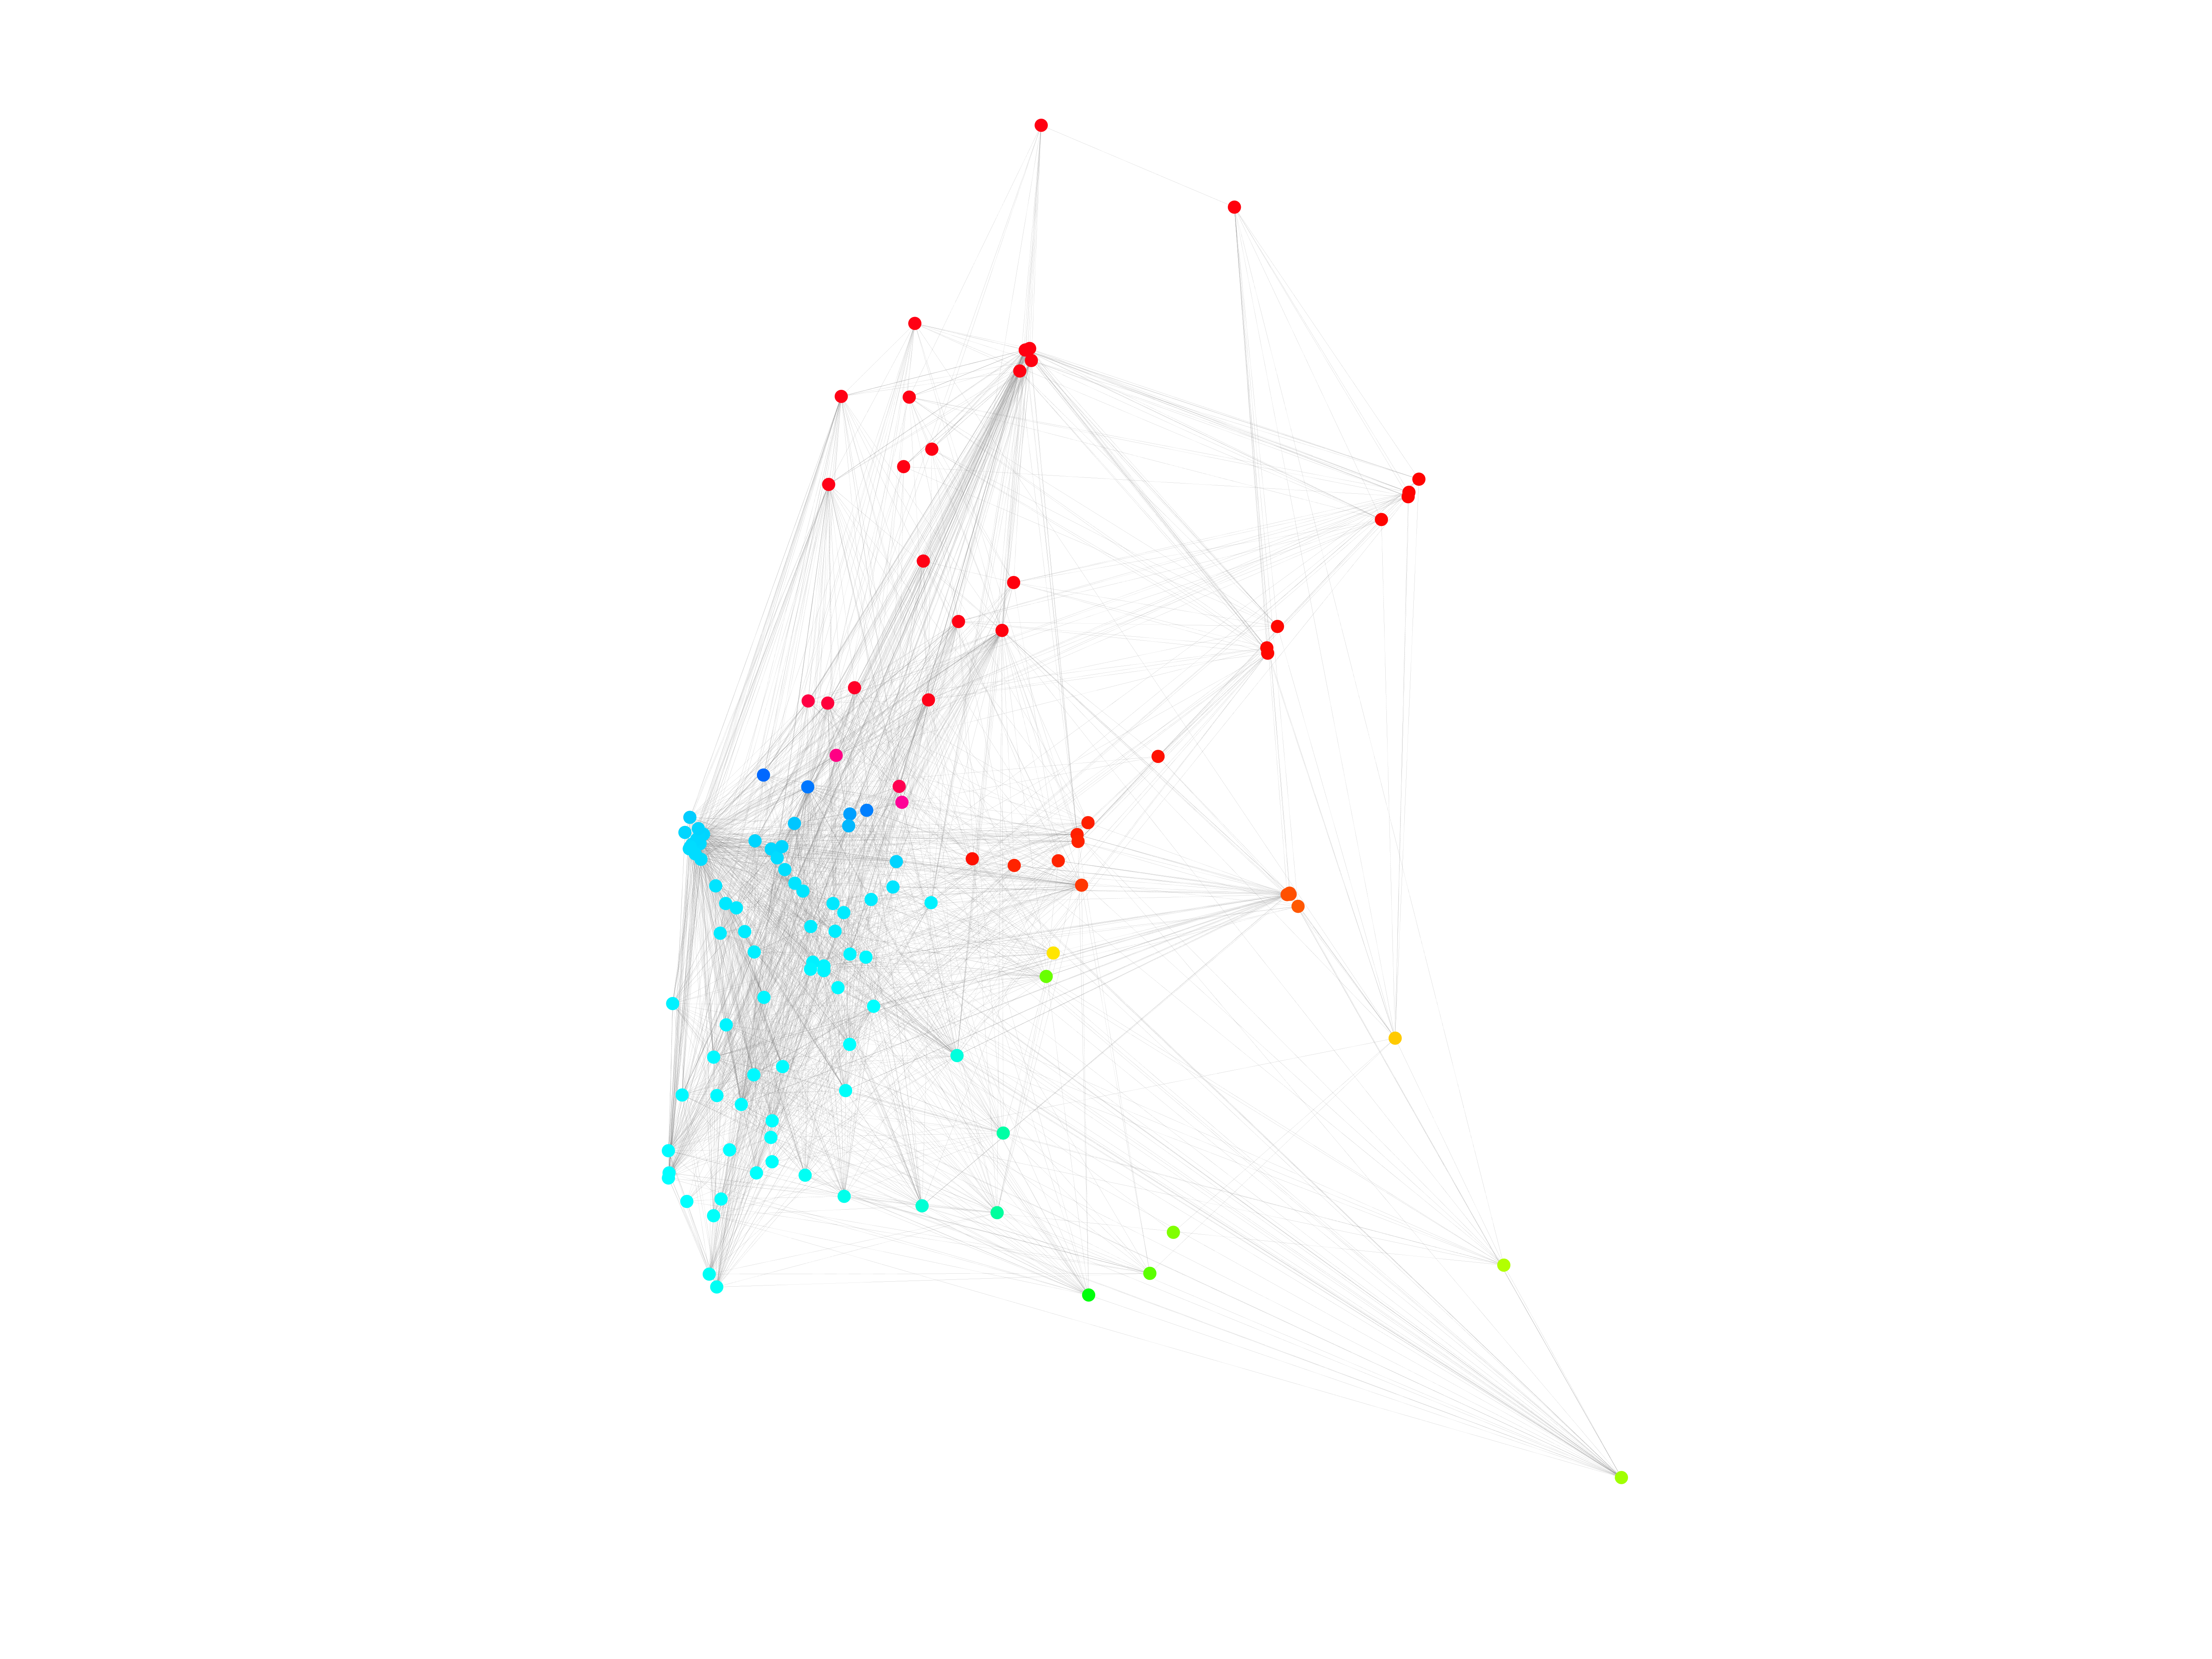
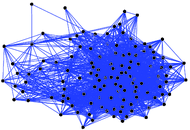
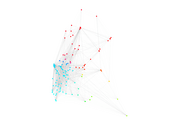
Florida ecosystem dry
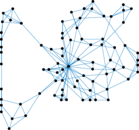
This network contains the carbon exchanges in the cypress wetlands of South
Florida during the dry season. Nodes represent taxa and an an edge denotes that
a taxon uses another taxon as food with a given trophic factor (feeding level).
Metadata
Statistics
| Size | n = | 128
|
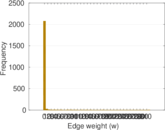
| Volume | m = | 2,137
|
| Loop count | l = | 0
|
| Wedge count | s = | 83,185
|
| Claw count | z = | 1,414,104
|
| Cross count | x = | 21,386,699
|
| Triangle count | t = | 8,715
|
| Square count | q = | 335,189
|
| 4-Tour count | T4 = | 3,018,464
|
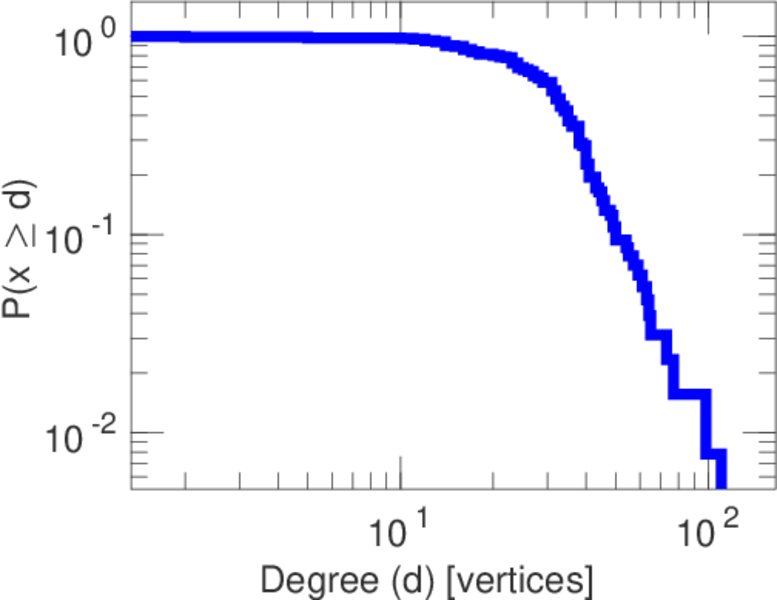
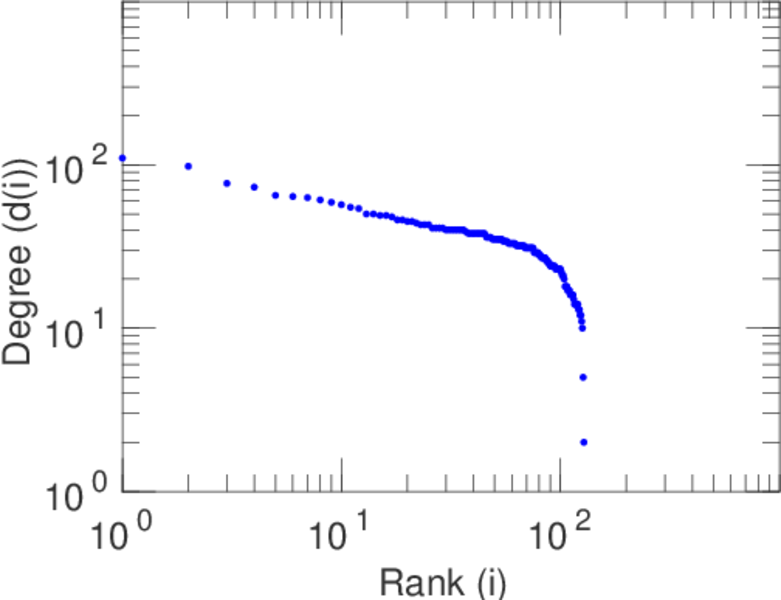
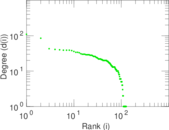
| Maximum degree | dmax = | 110
|
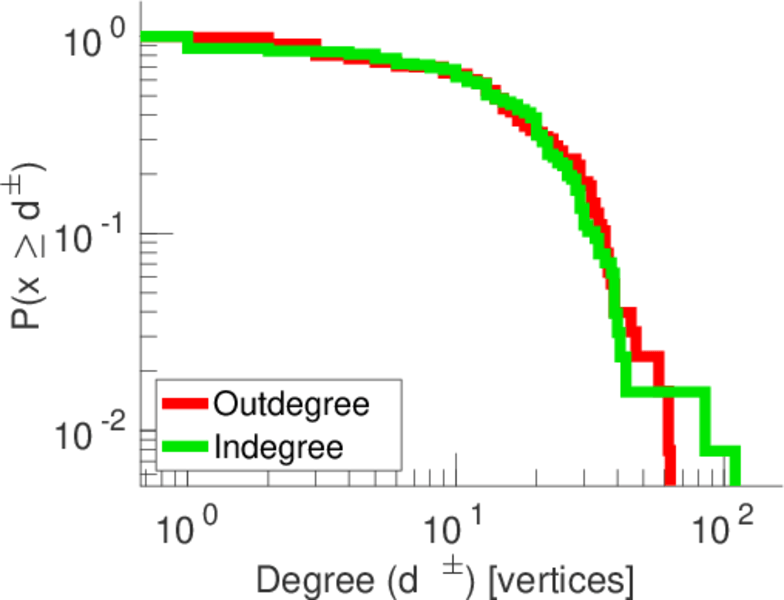
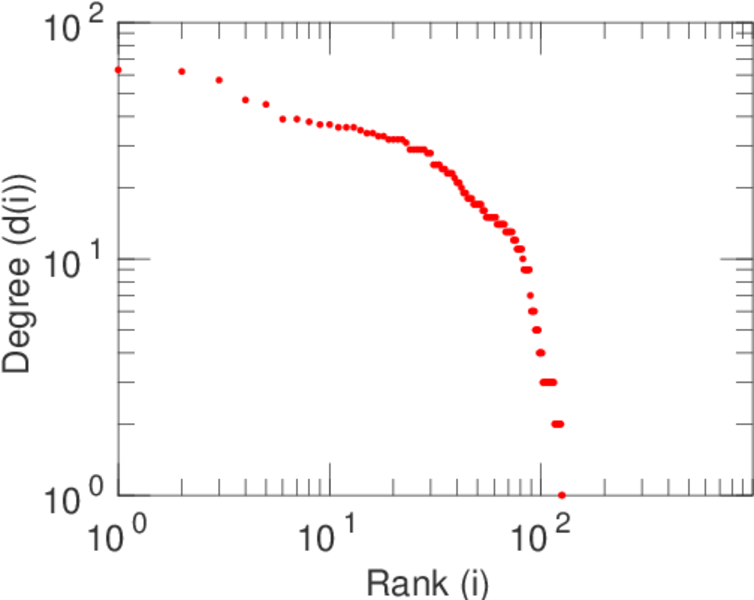
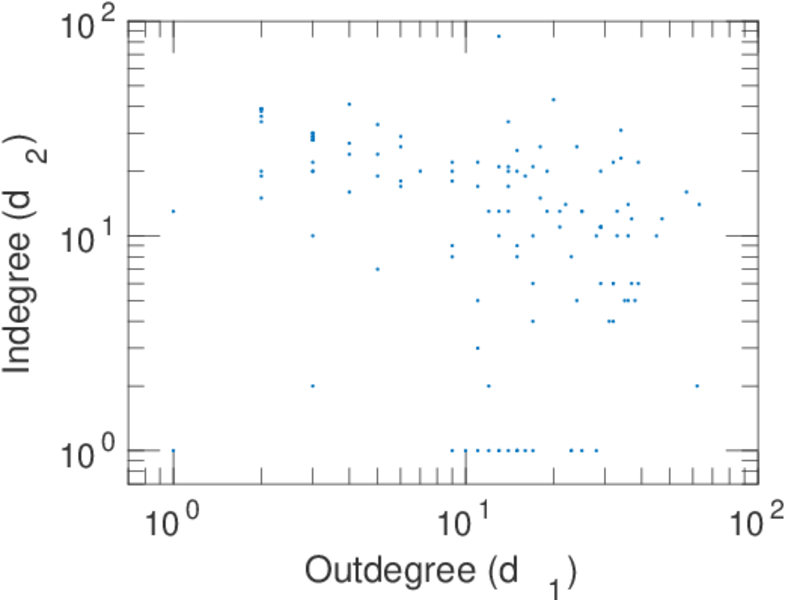
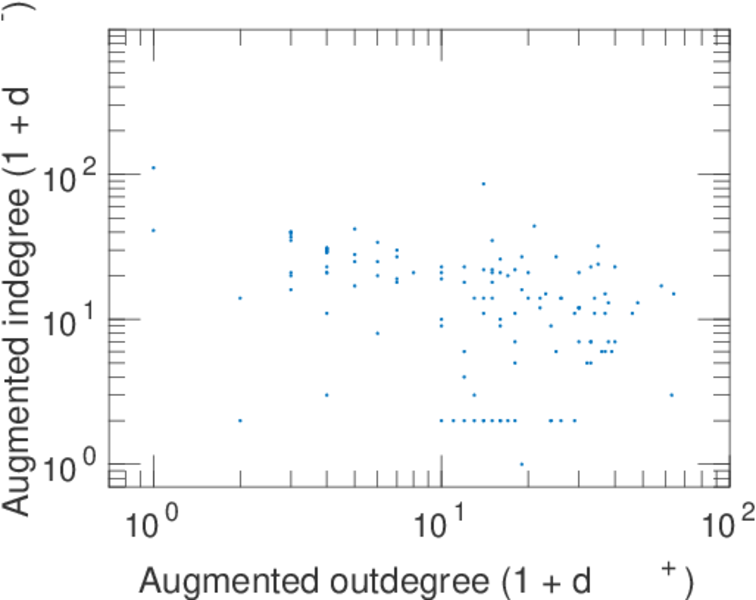
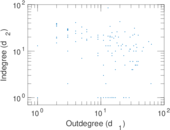
| Maximum outdegree | d+max = | 63
|
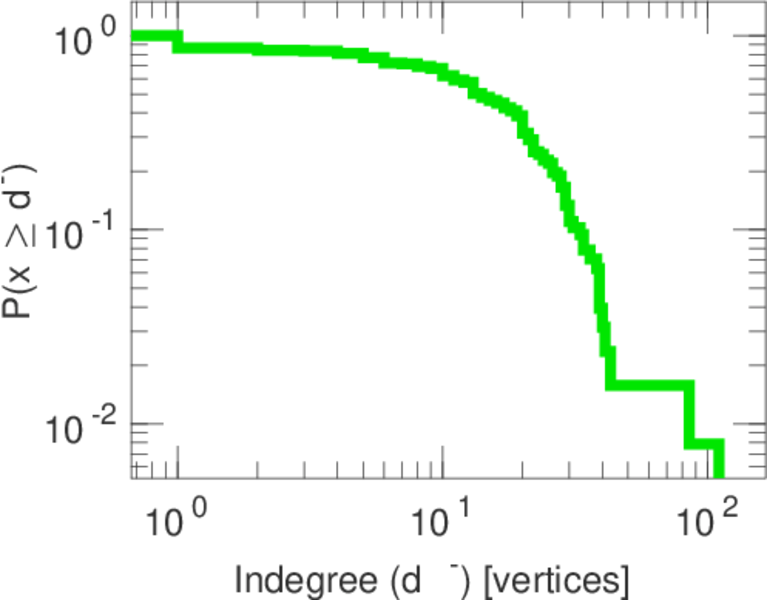
| Maximum indegree | d−max = | 110
|
| Average degree | d = | 33.390 6
|
| Fill | p = | 0.131 459
|
| Size of LCC | N = | 128
|
| Size of LSCC | Ns = | 103
|
| Relative size of LSCC | Nrs = | 0.804 688
|
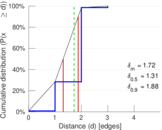
| Diameter | δ = | 3
|
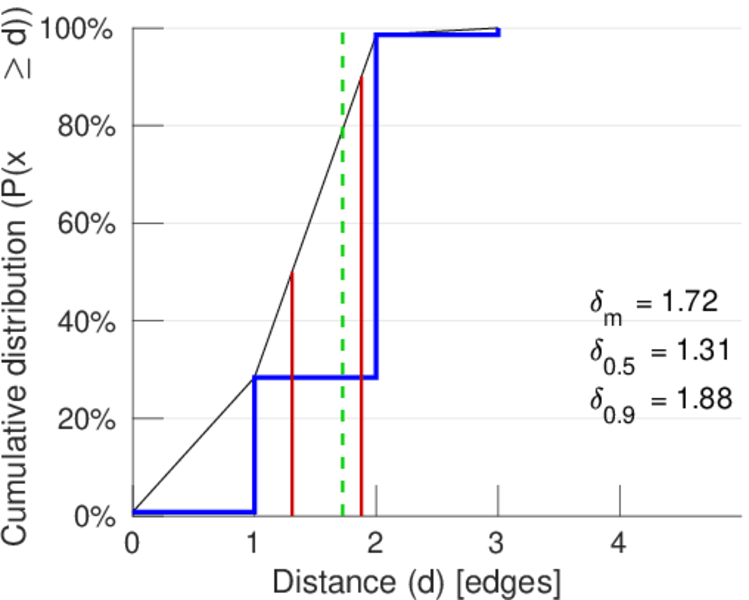
| 50-Percentile effective diameter | δ0.5 = | 1.307 91
|
| 90-Percentile effective diameter | δ0.9 = | 1.877 53
|
| Median distance | δM = | 2
|
| Mean distance | δm = | 1.722 26
|
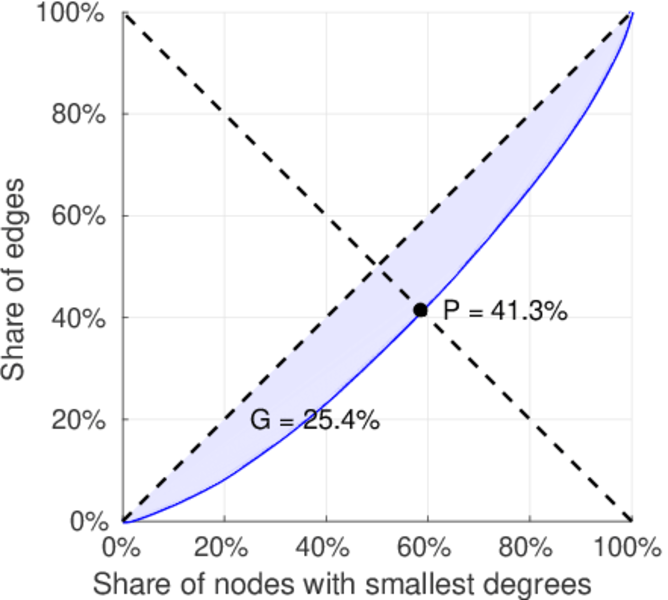
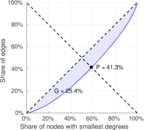
| Gini coefficient | G = | 0.253 663
|
| Balanced inequality ratio | P = | 0.413 430
|
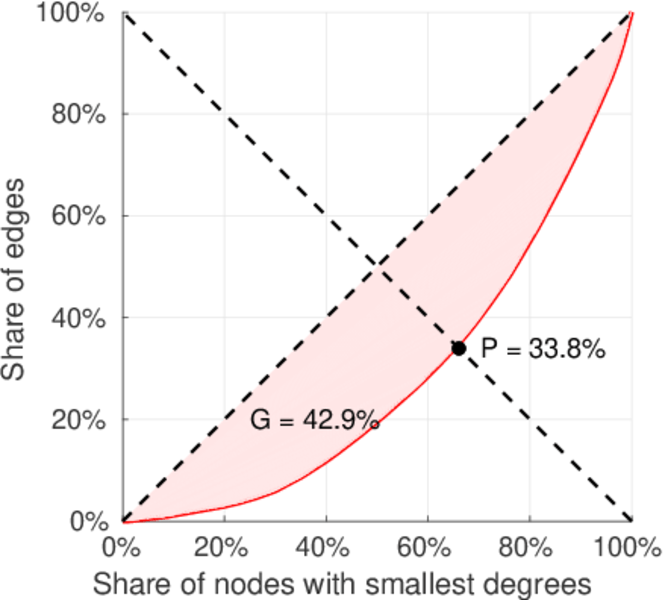
| Outdegree balanced inequality ratio | P+ = | 0.337 857
|
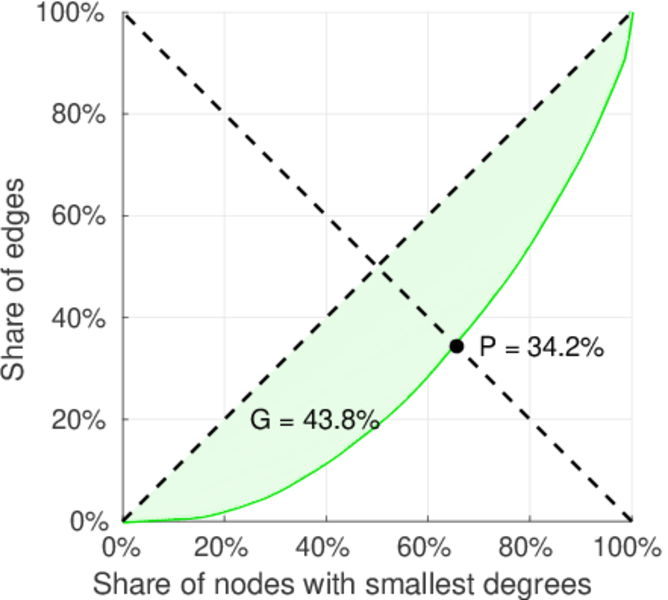
| Indegree balanced inequality ratio | P− = | 0.342 068
|
| Relative edge distribution entropy | Her = | 0.977 136
|
| Power law exponent | γ = | 1.373 21
|
| Tail power law exponent | γt = | 5.021 00
|
| Tail power law exponent with p | γ3 = | 5.021 00
|
| p-value | p = | 0.961 000
|
| Outdegree tail power law exponent with p | γ3,o = | 5.931 00
|
| Outdegree p-value | po = | 0.437 000
|
| Indegree tail power law exponent with p | γ3,i = | 3.531 00
|
| Indegree p-value | pi = | 0.100 000
|
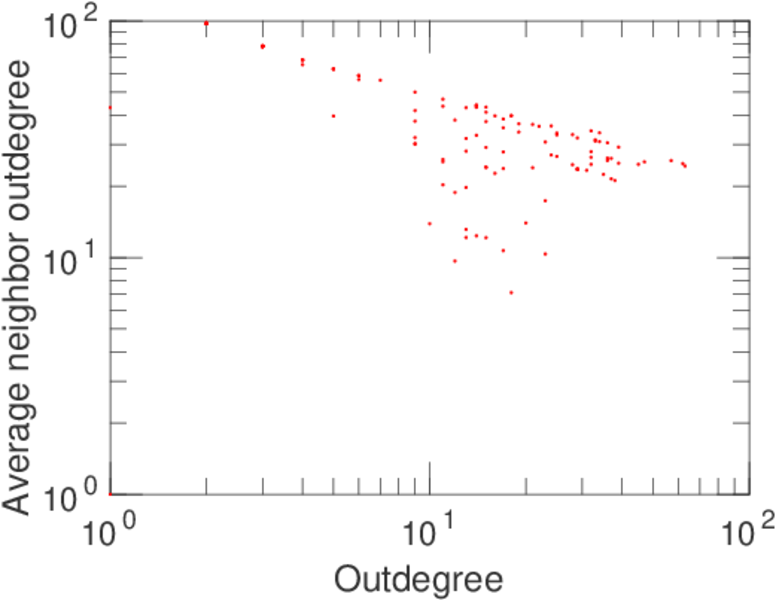
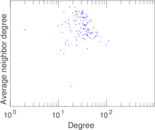
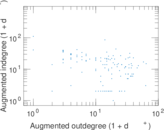
| Degree assortativity | ρ = | −0.104 372
|
| Degree assortativity p-value | pρ = | 1.119 24 × 10−11
|
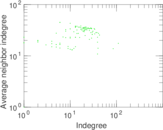
| In/outdegree correlation | ρ± = | −0.386 098
|
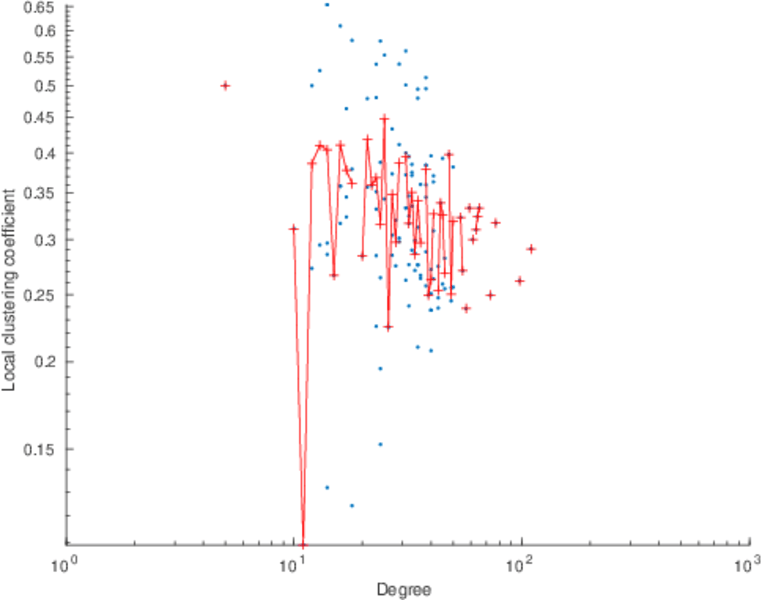
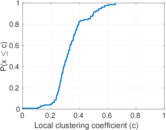
| Clustering coefficient | c = | 0.314 299
|
| Directed clustering coefficient | c± = | 0.339 695
|
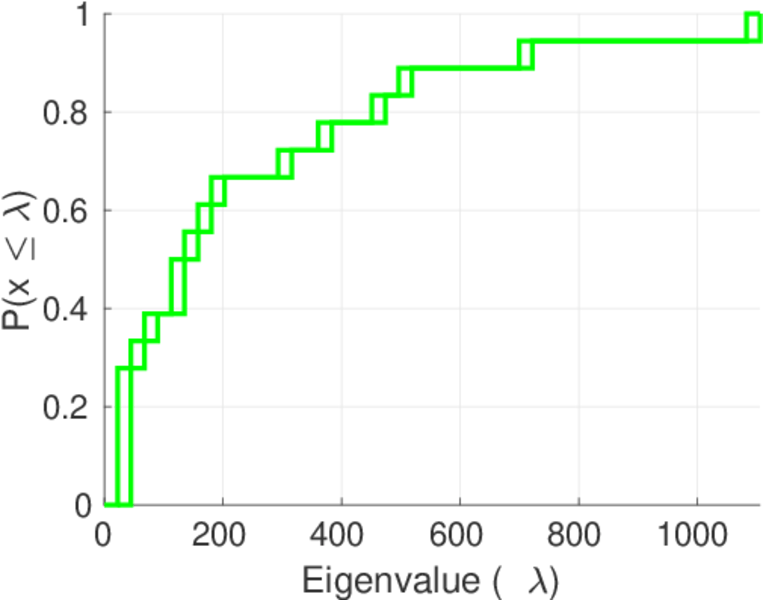
| Spectral norm | α = | 435.201
|
| Operator 2-norm | ν = | 347.139
|
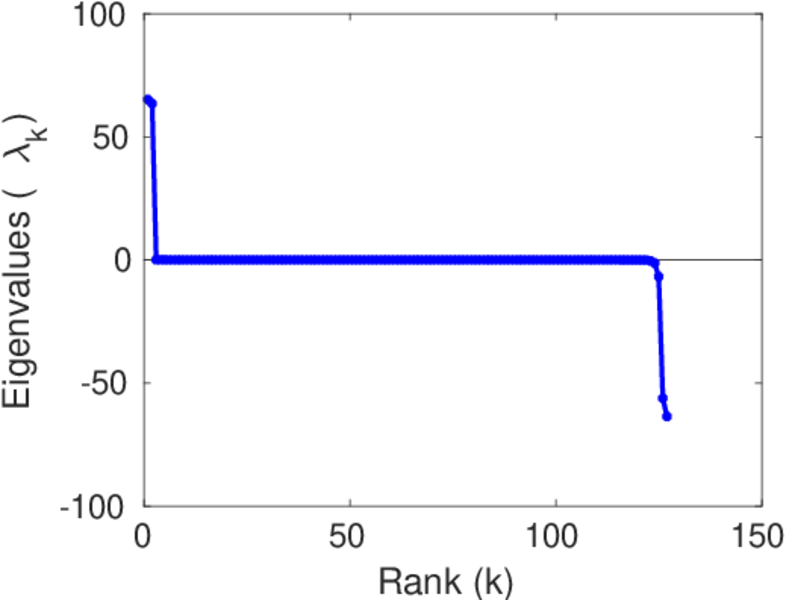
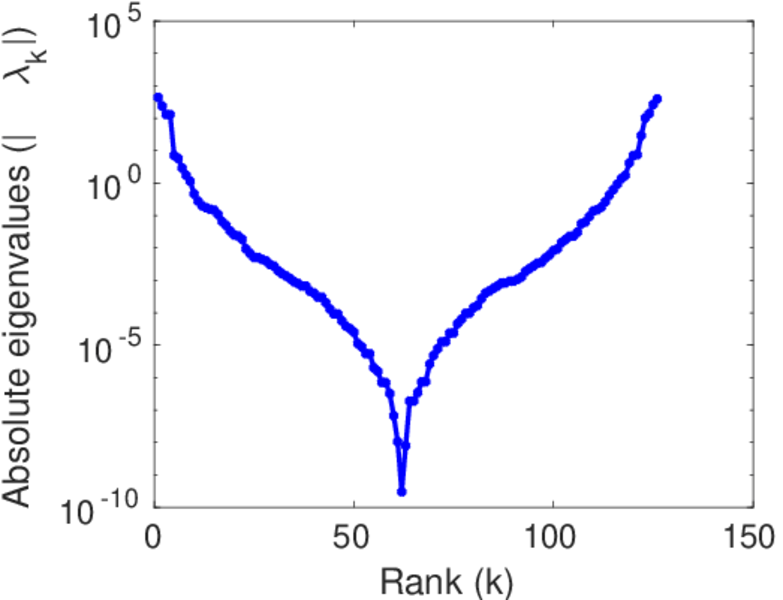
| Cyclic eigenvalue | π = | 65.098 2
|
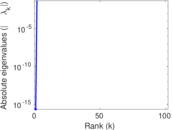
| Algebraic connectivity | a = | 2.338 96 × 10−5
|
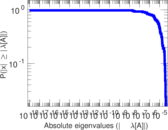
| Spectral separation | |λ1[A] / λ2[A]| = | 1.104 37
|
| Reciprocity | y = | 0.029 012 6
|
| Non-bipartivity | bA = | 0.490 948
|
| Normalized non-bipartivity | bN = | 0.445 053
|
| Algebraic non-bipartivity | χ = | 1.906 87
|
| Spectral bipartite frustration | bK = | 0.014 487 1
|
| Controllability | C = | 29
|
| Relative controllability | Cr = | 0.226 562
|
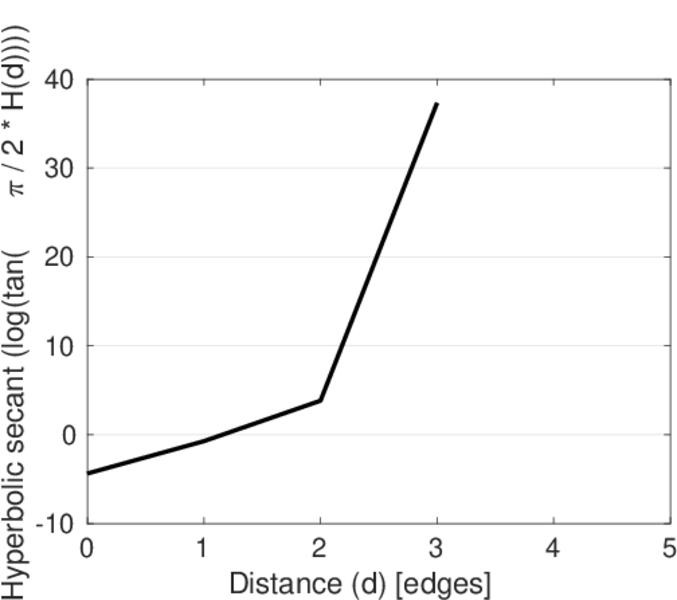
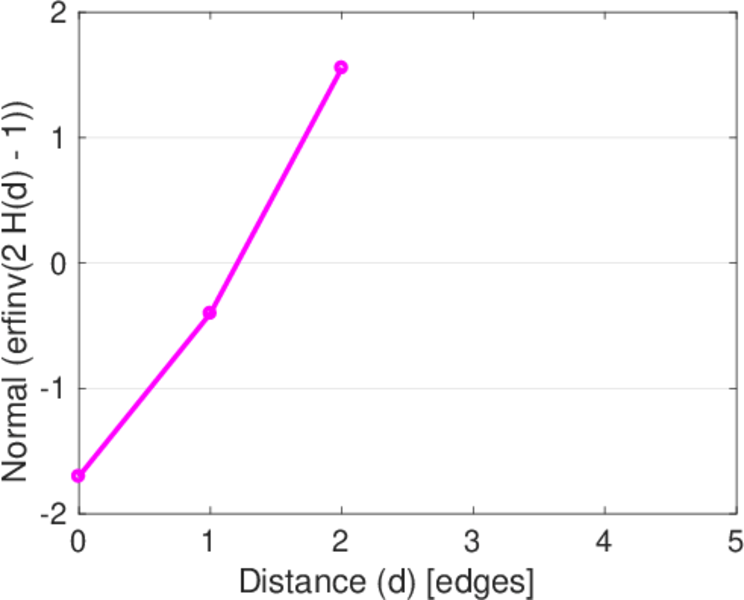
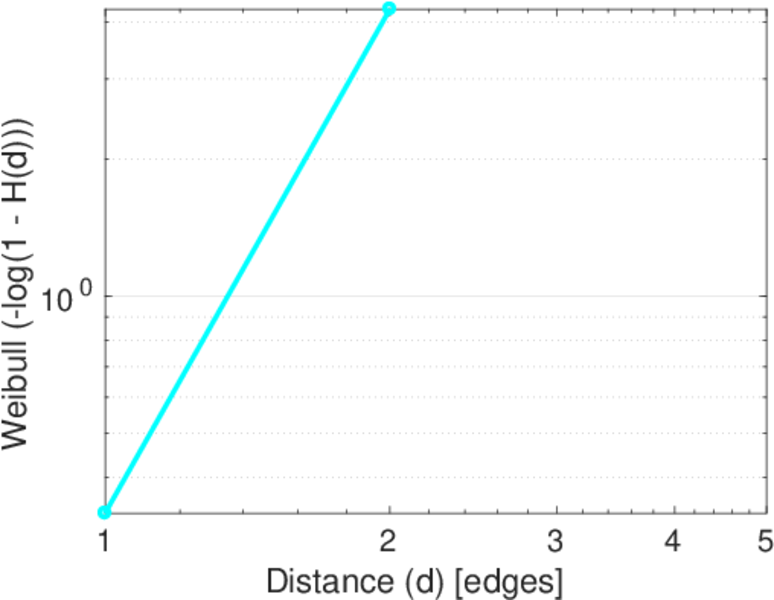
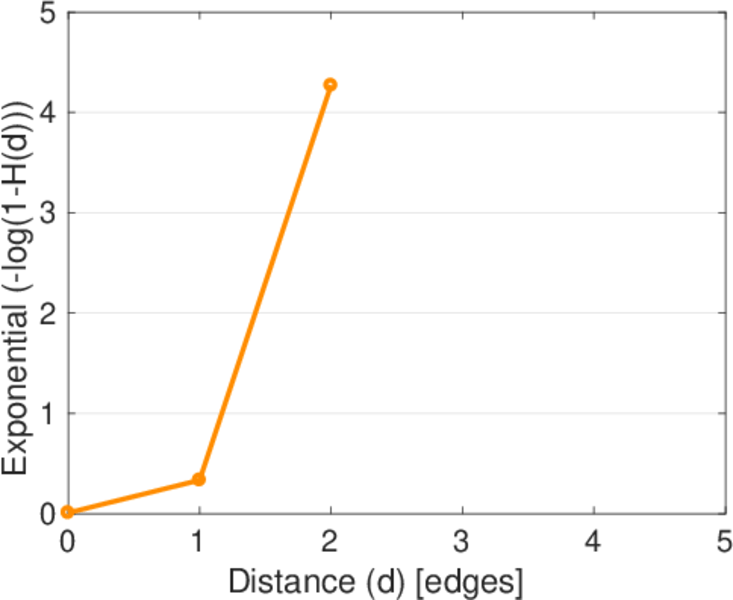
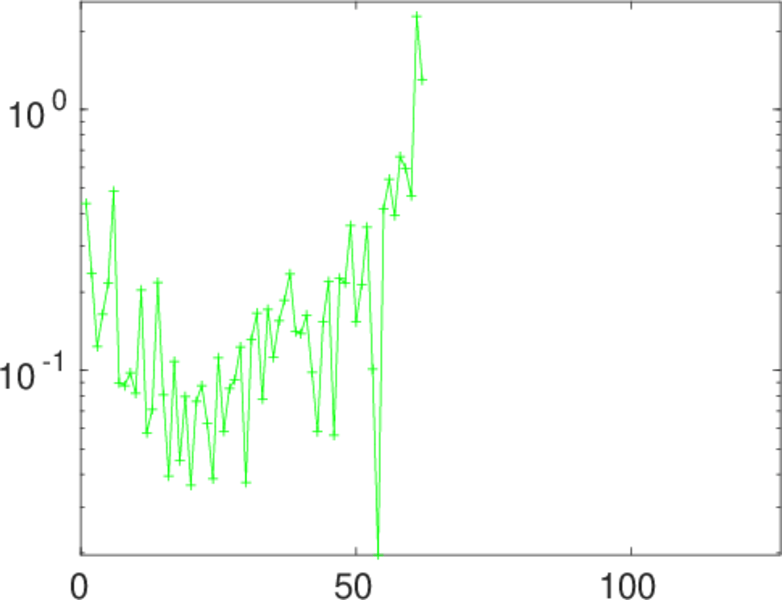
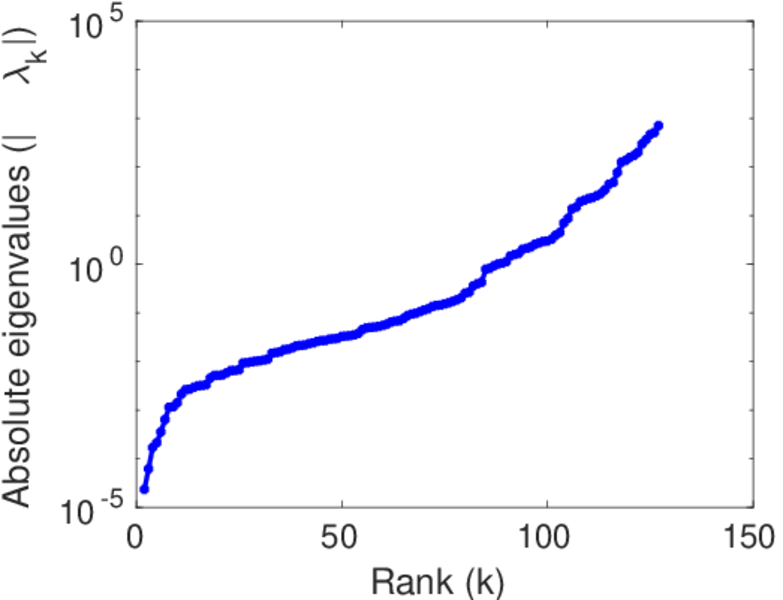
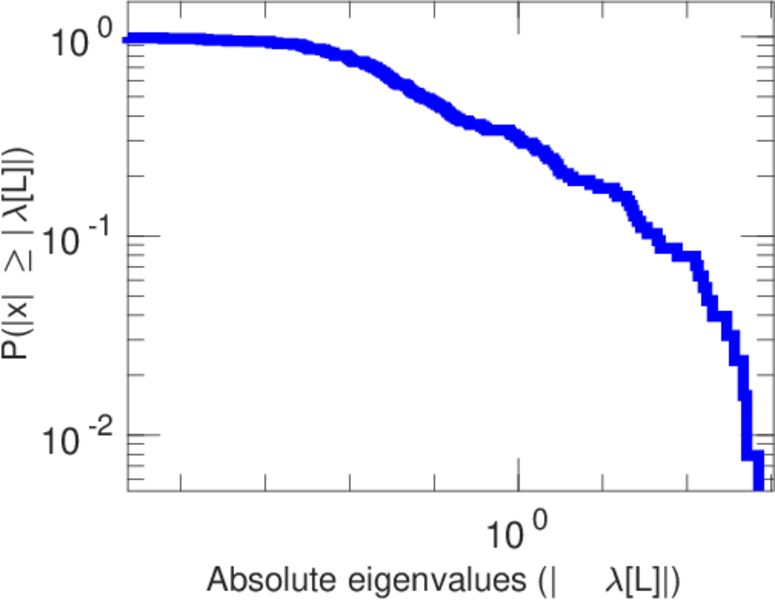
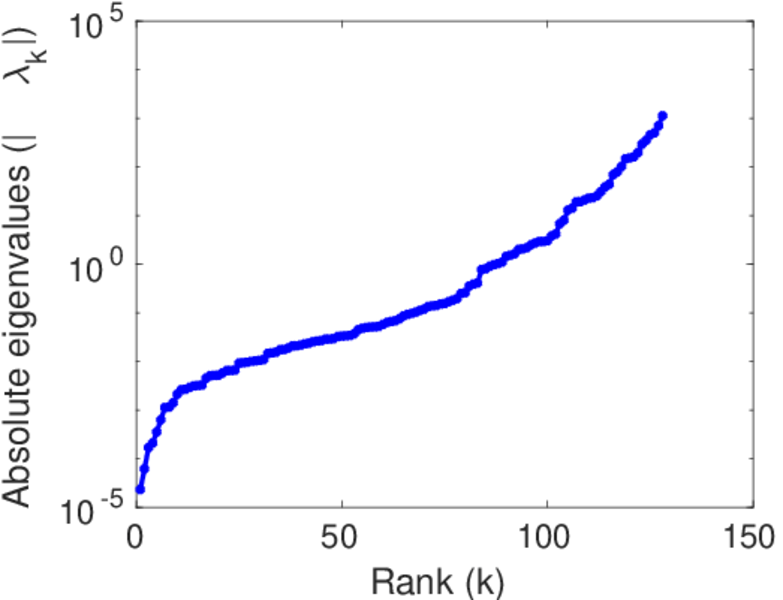
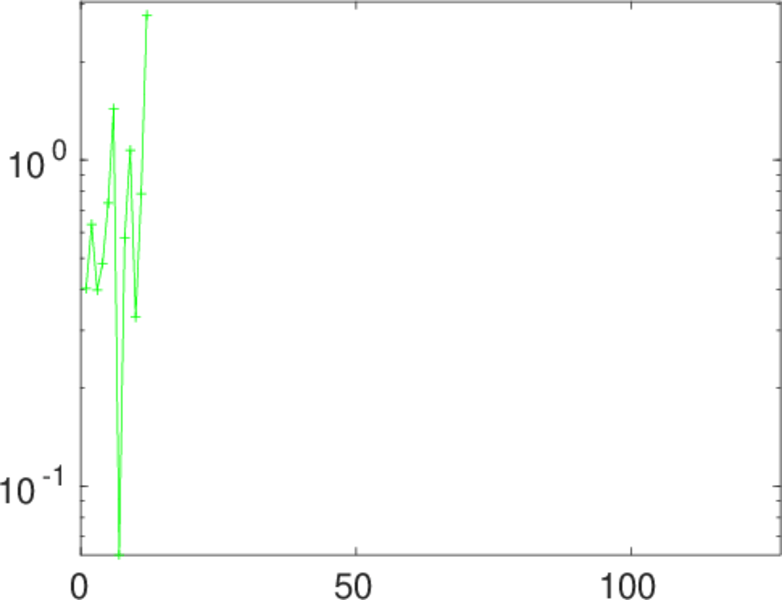
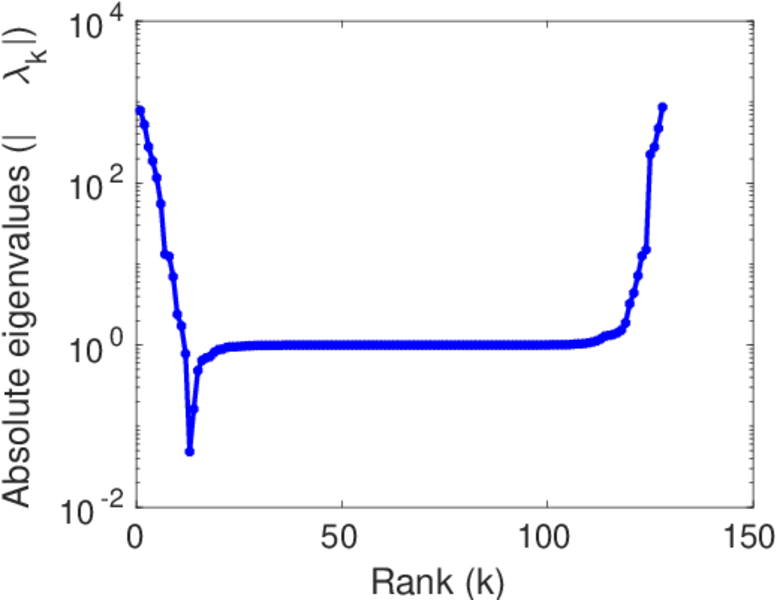
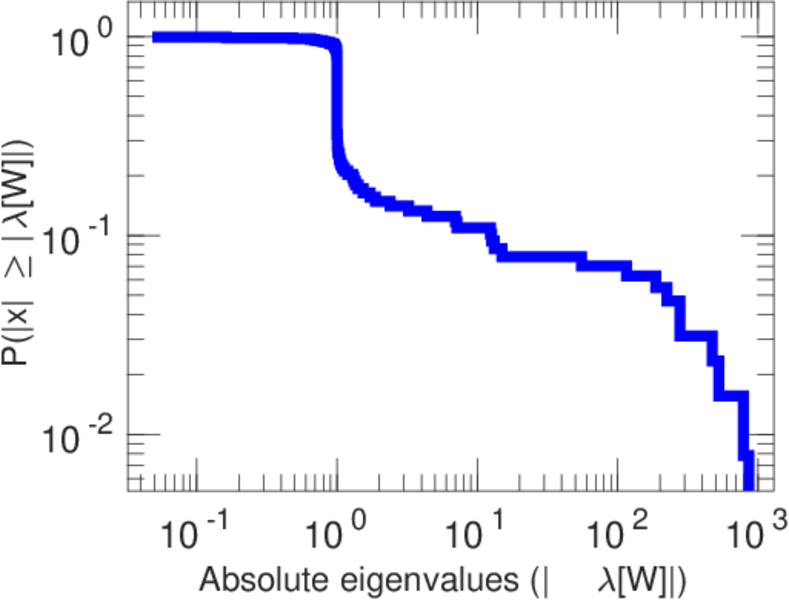
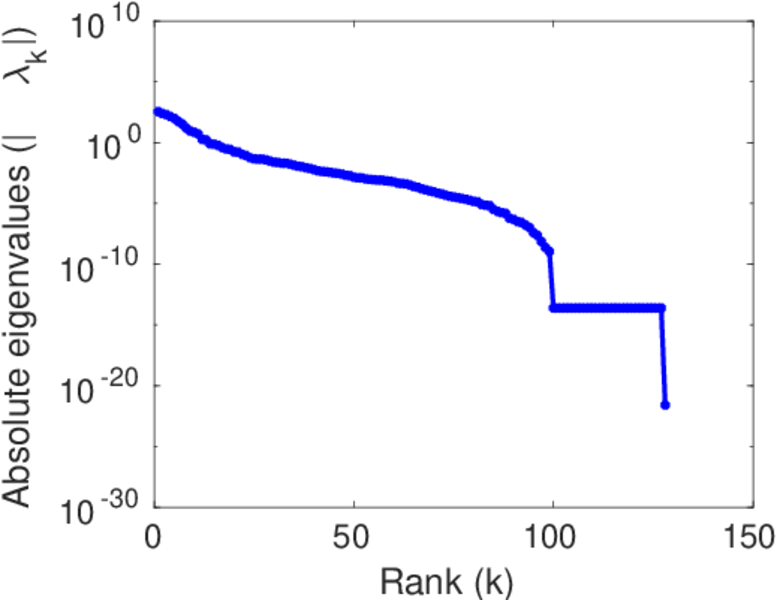
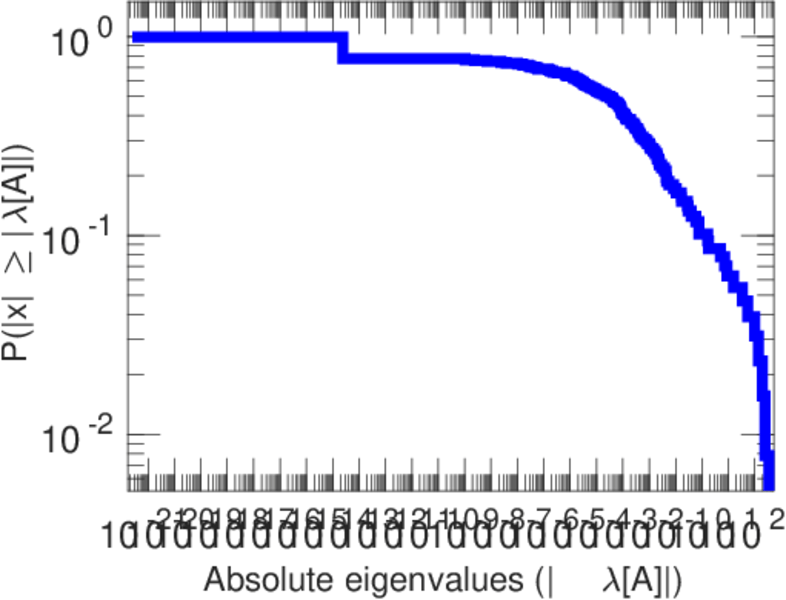
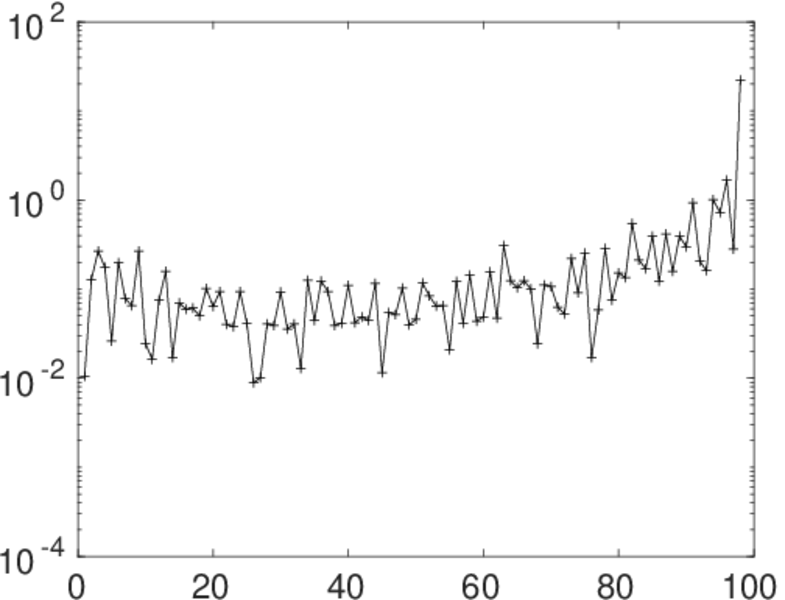
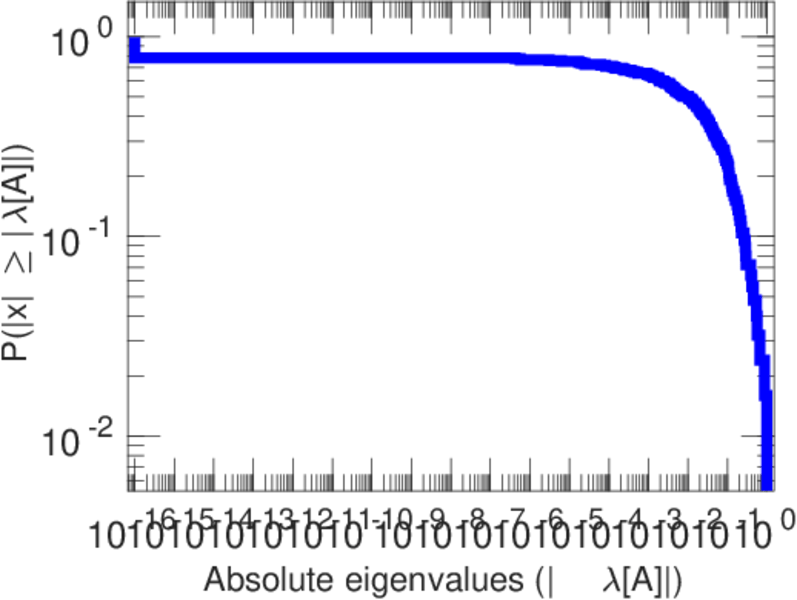
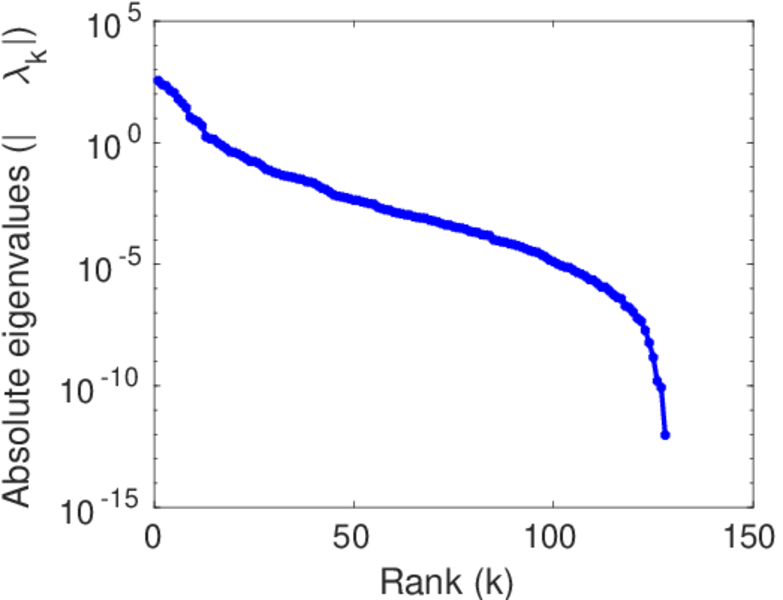
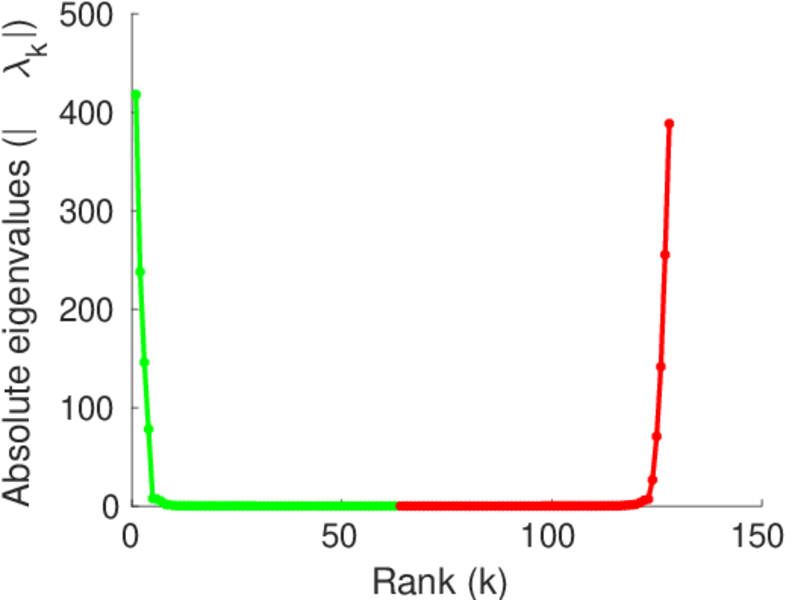
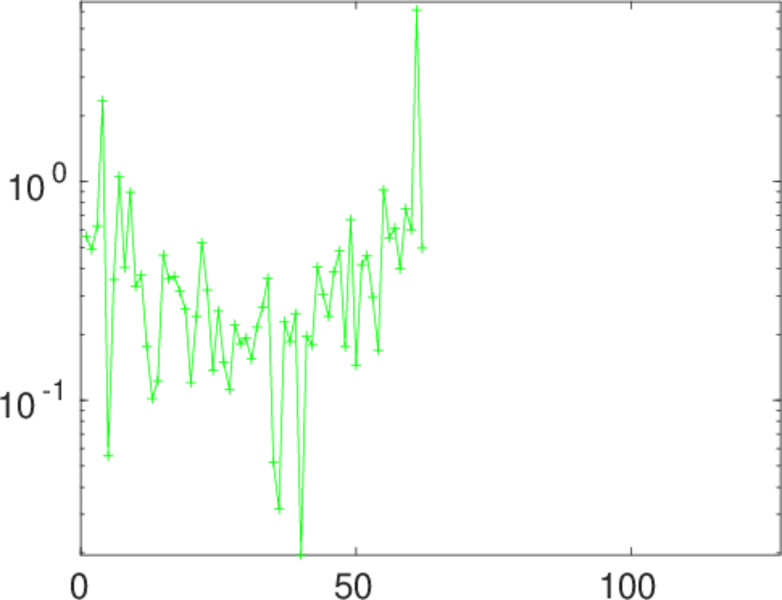
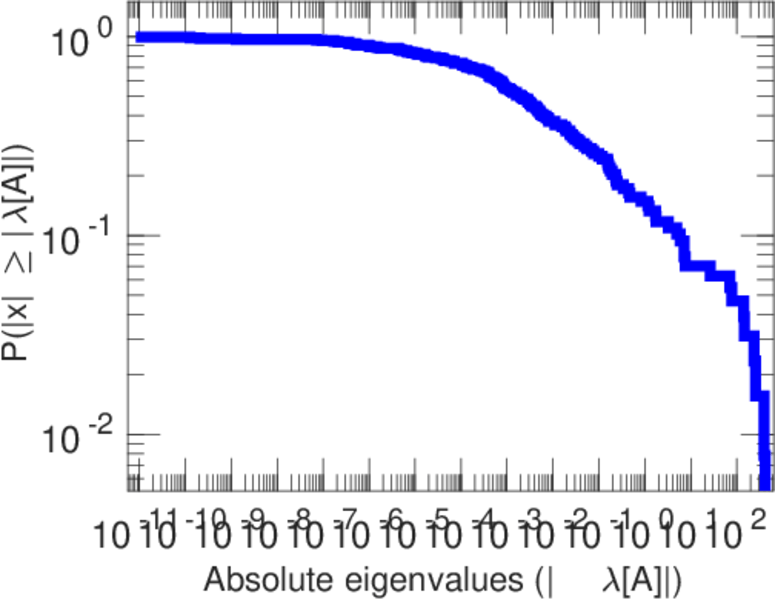
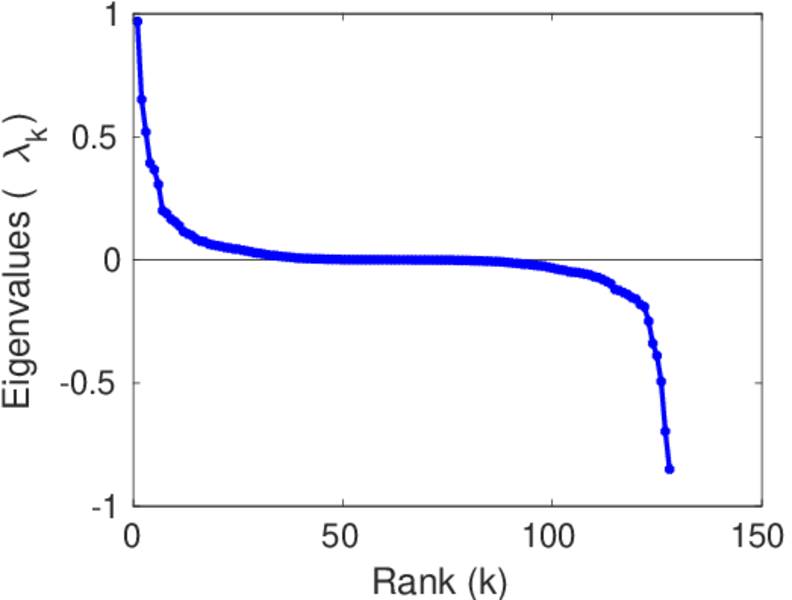
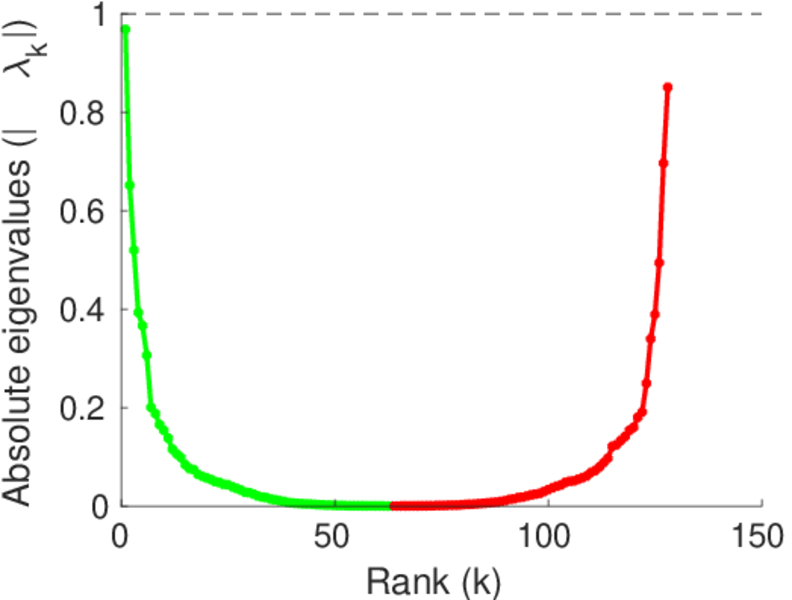
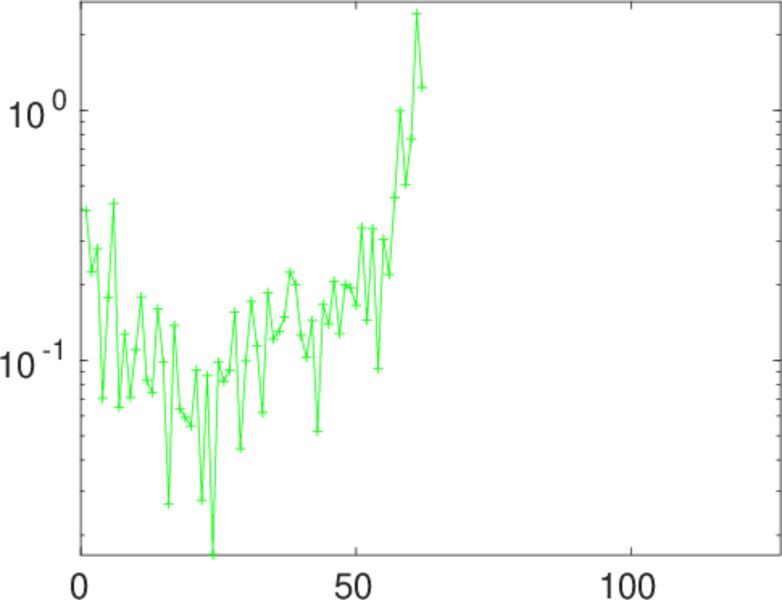
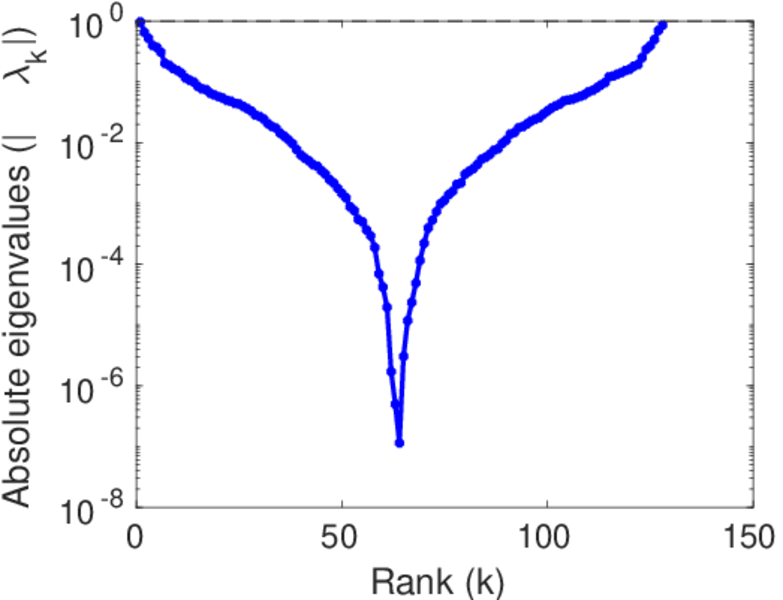
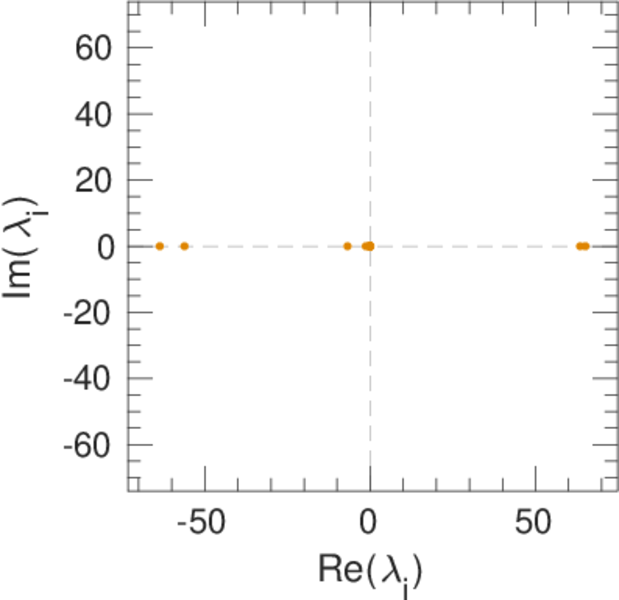
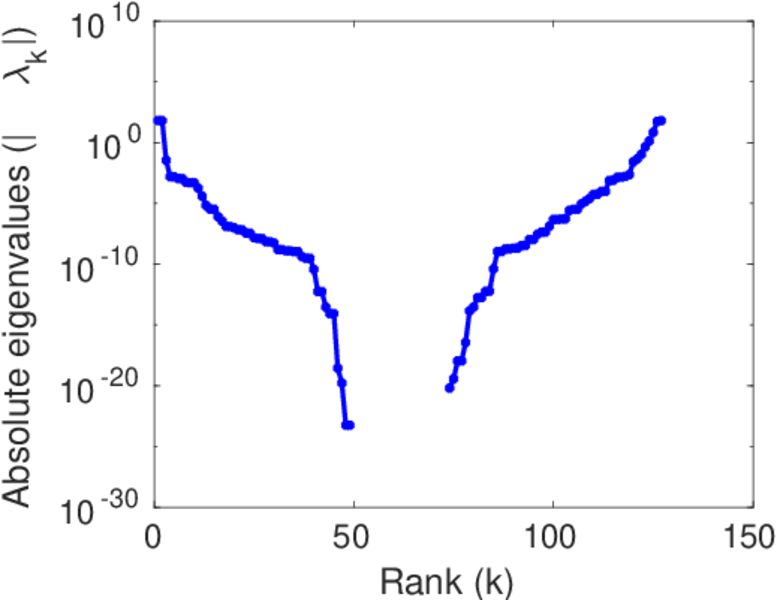
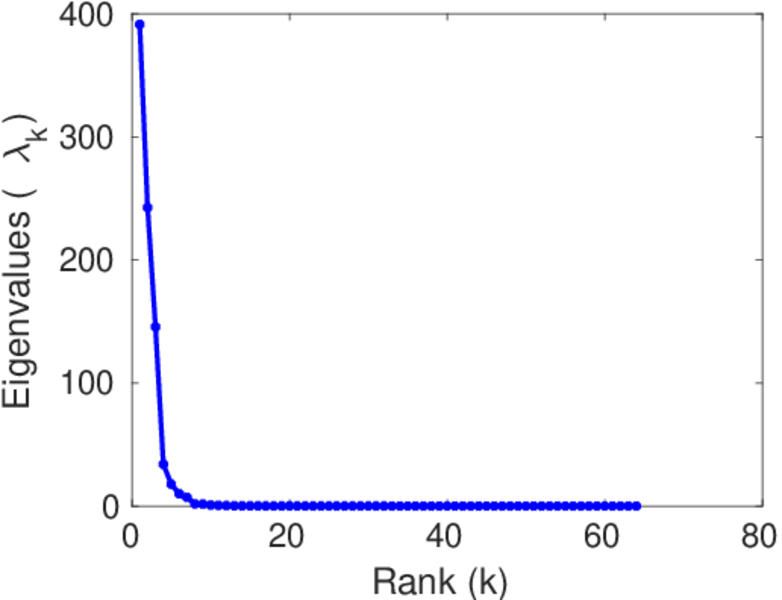
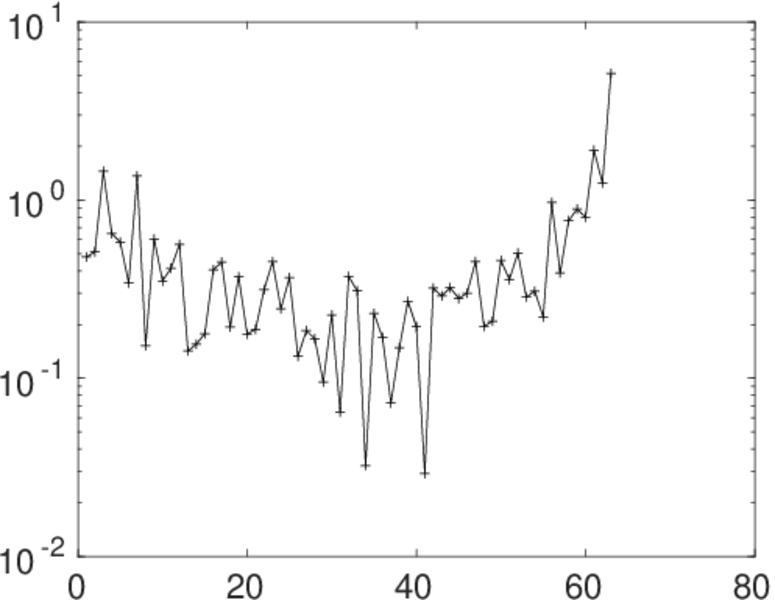
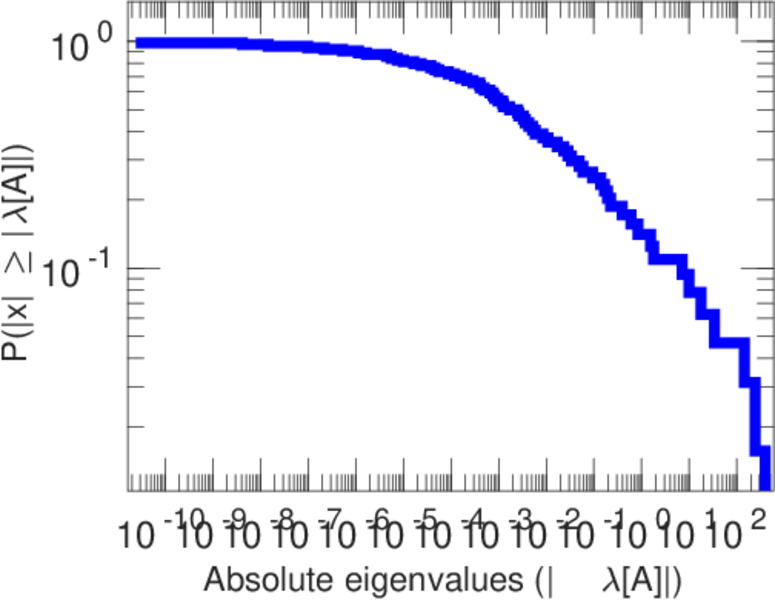
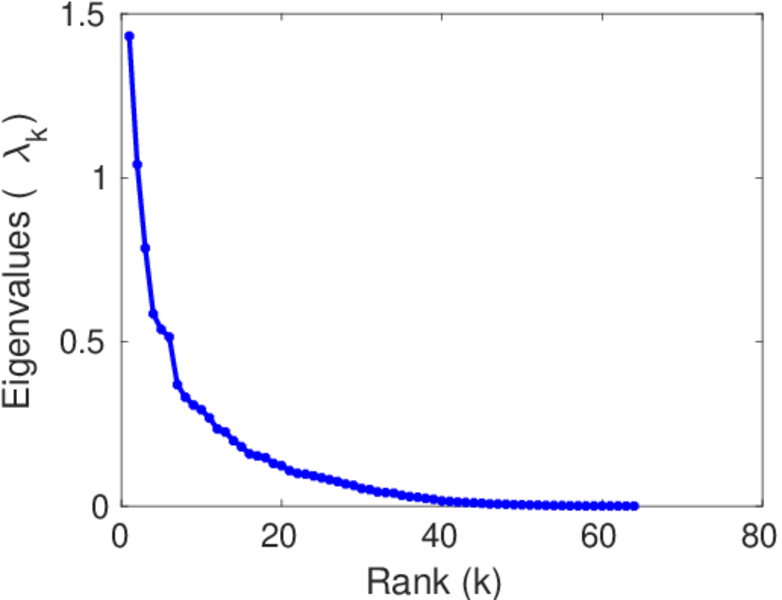
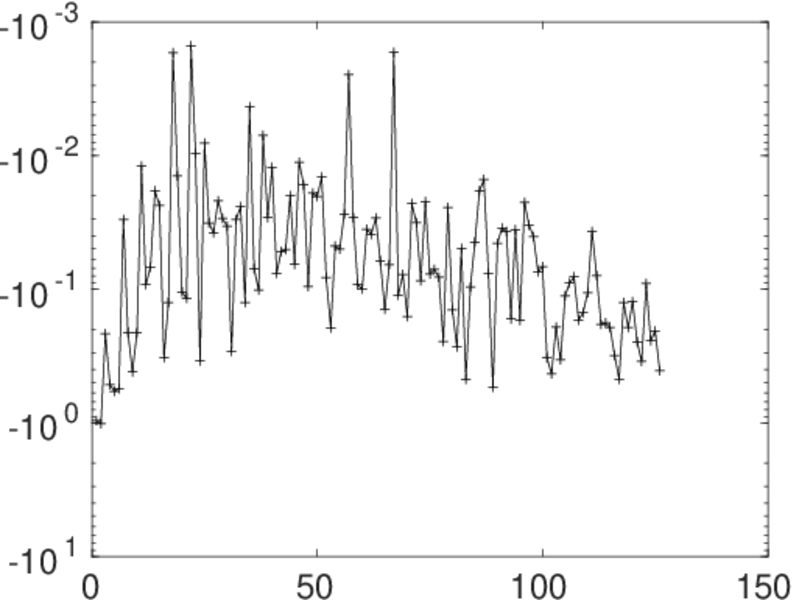
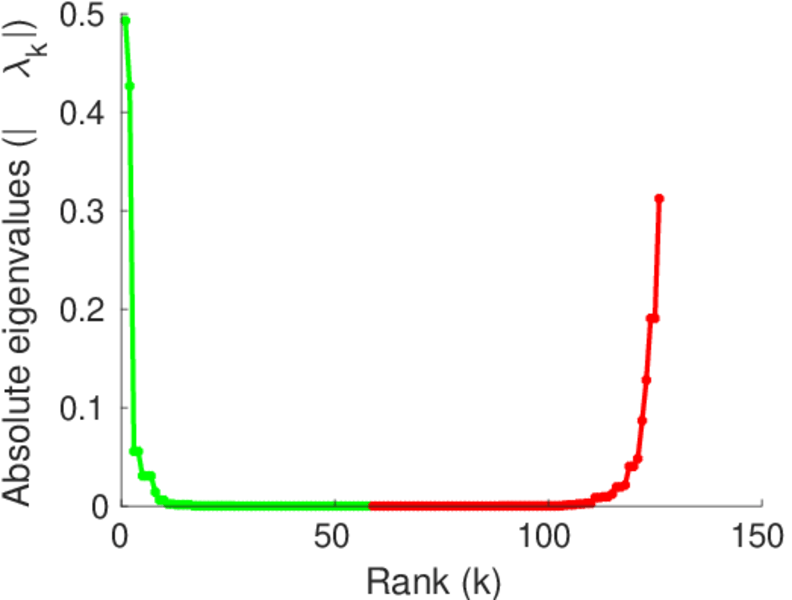
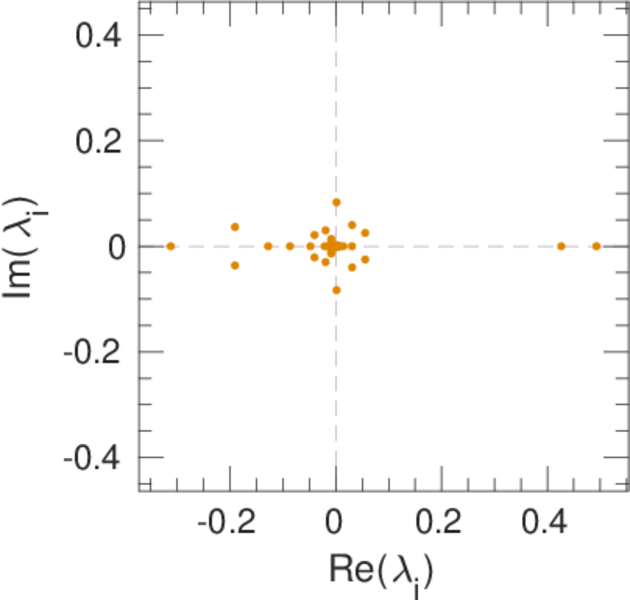
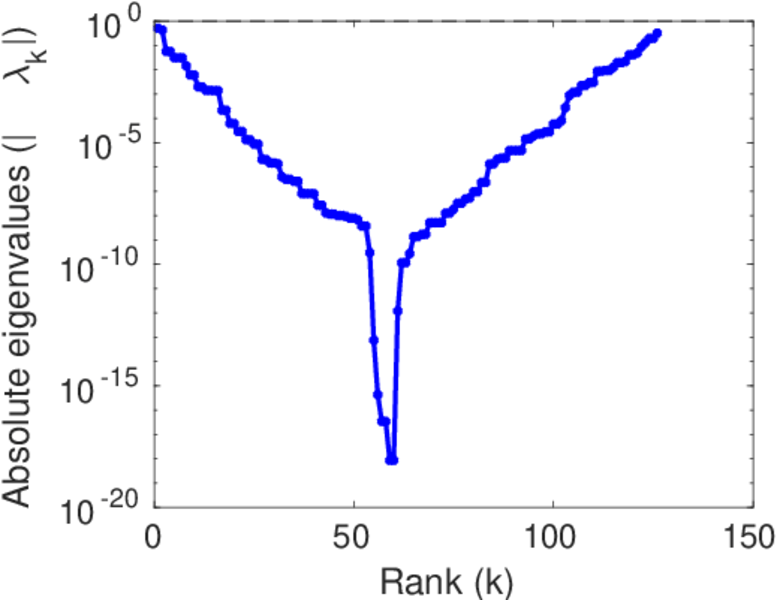
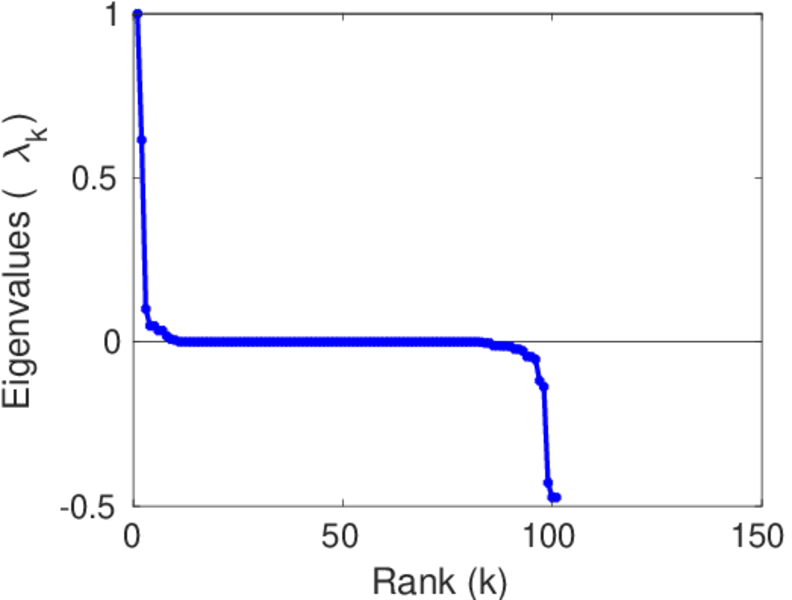
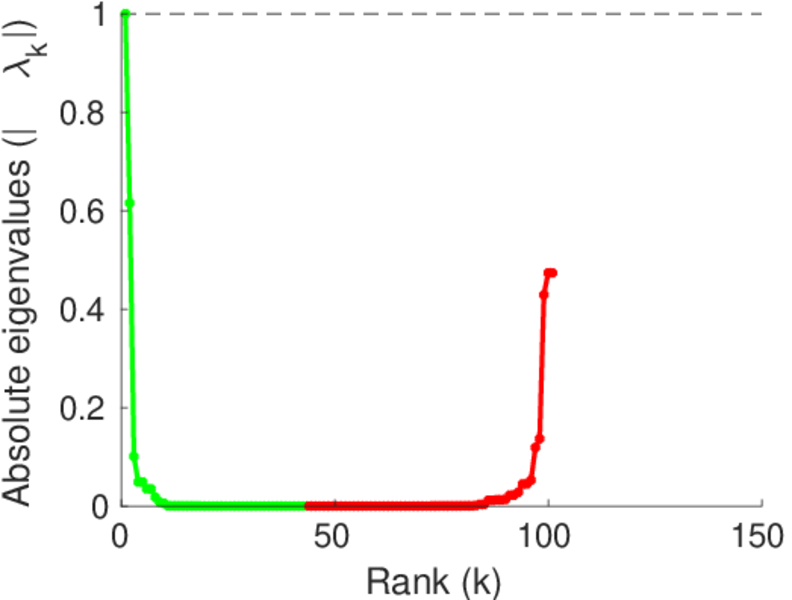
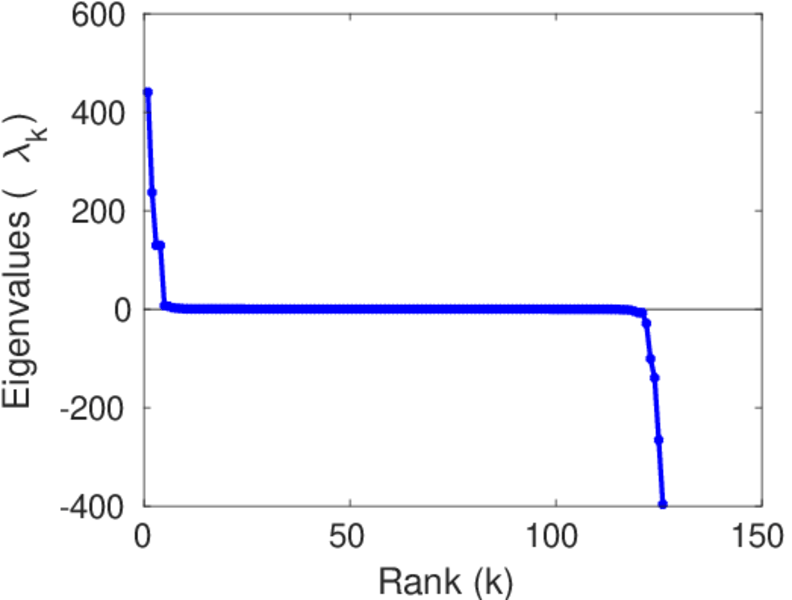
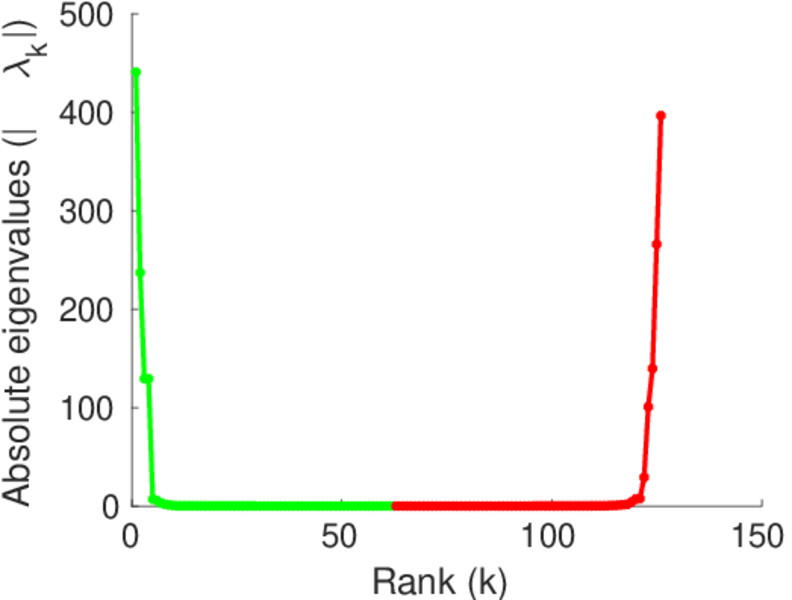
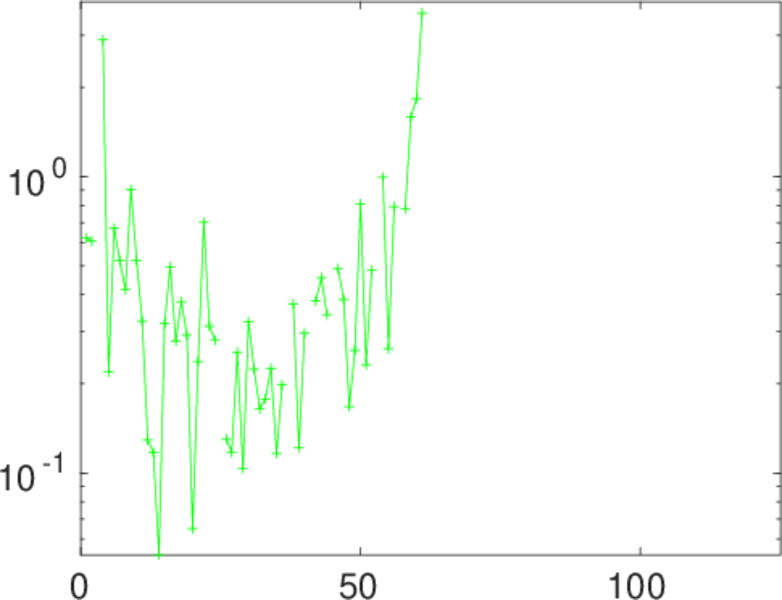
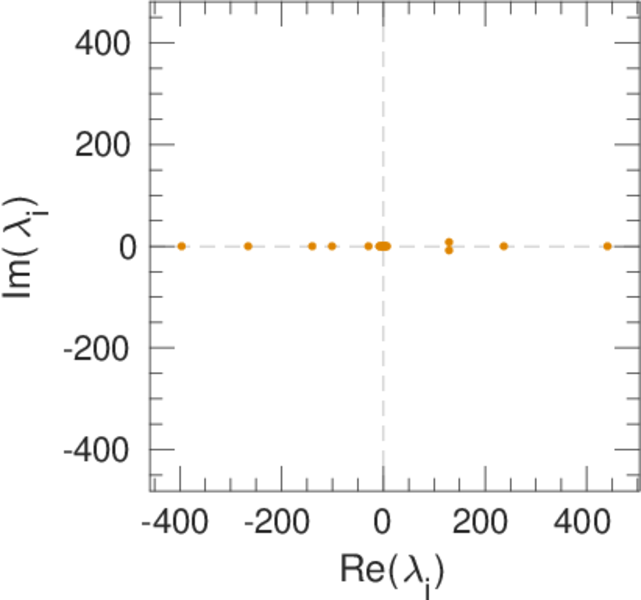
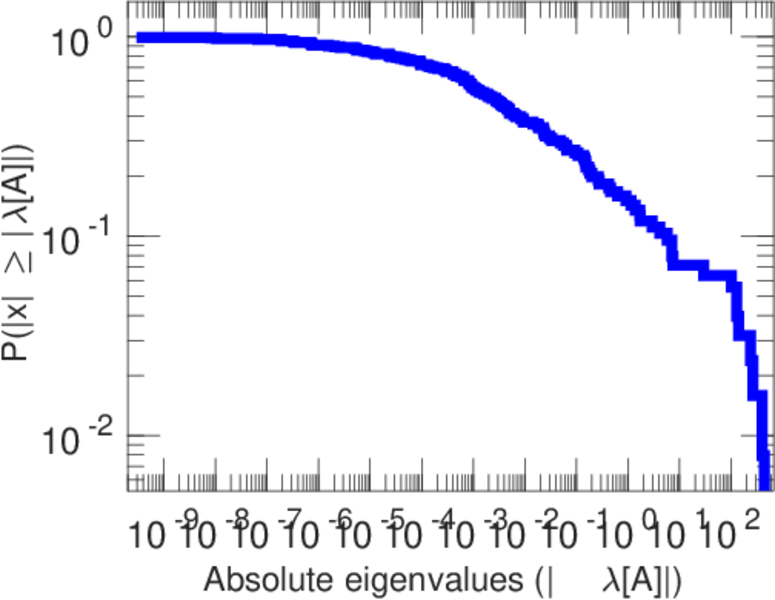
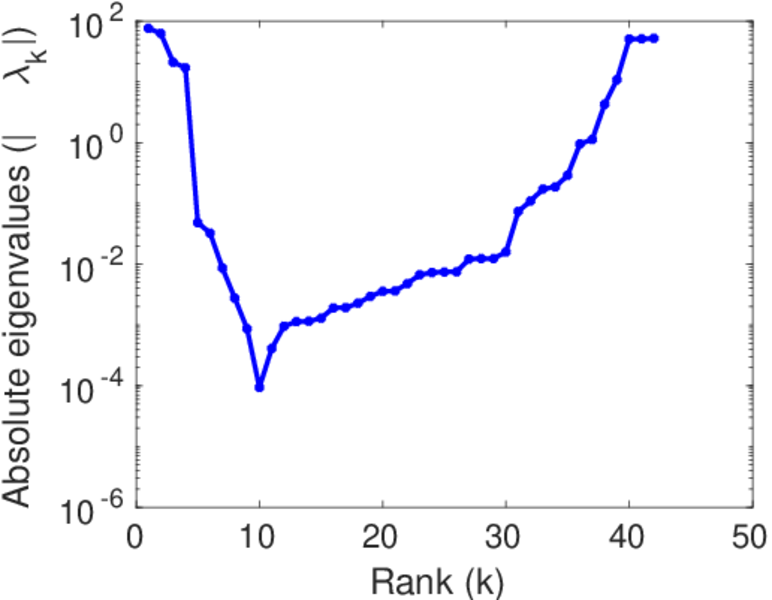
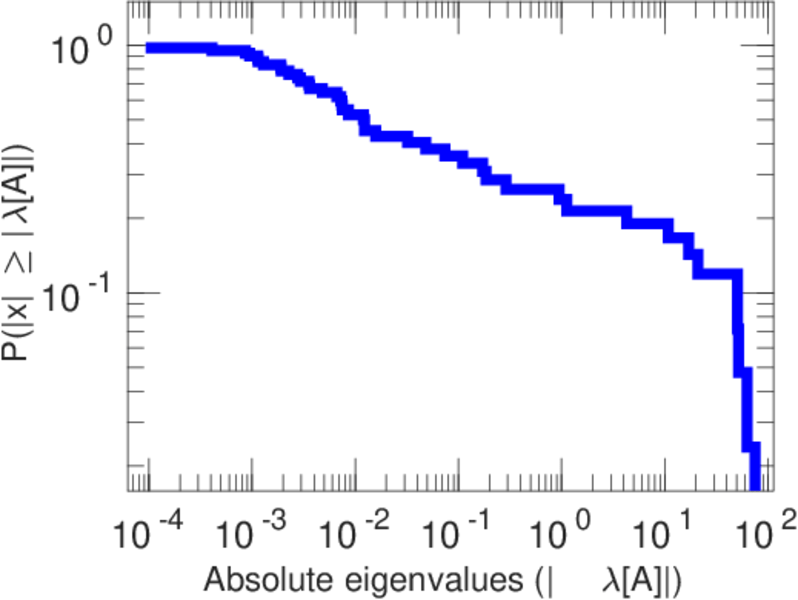
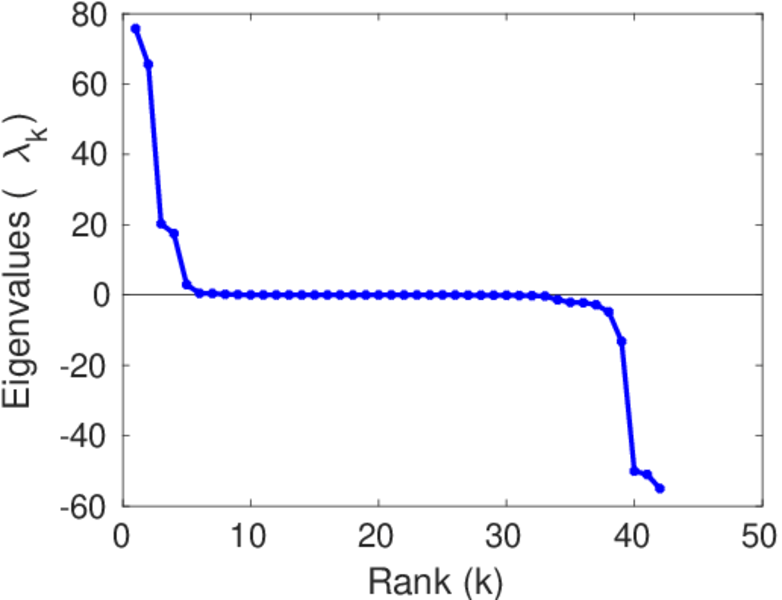
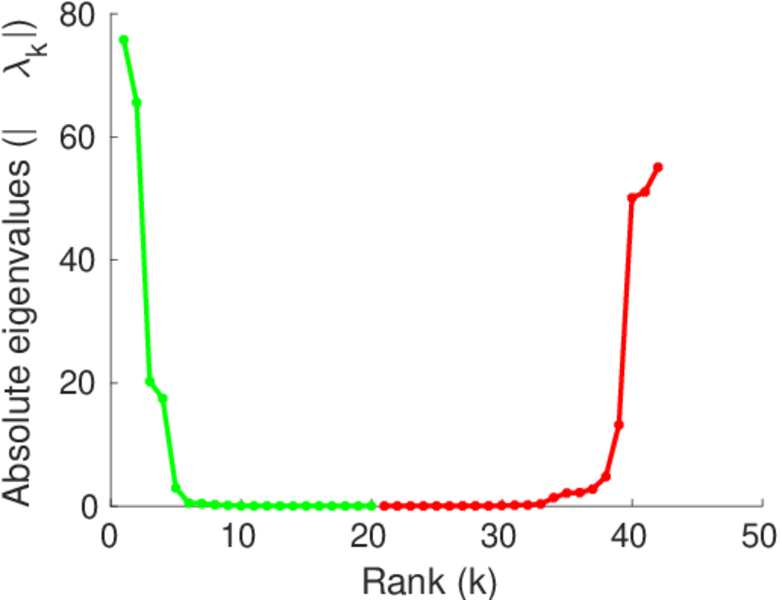
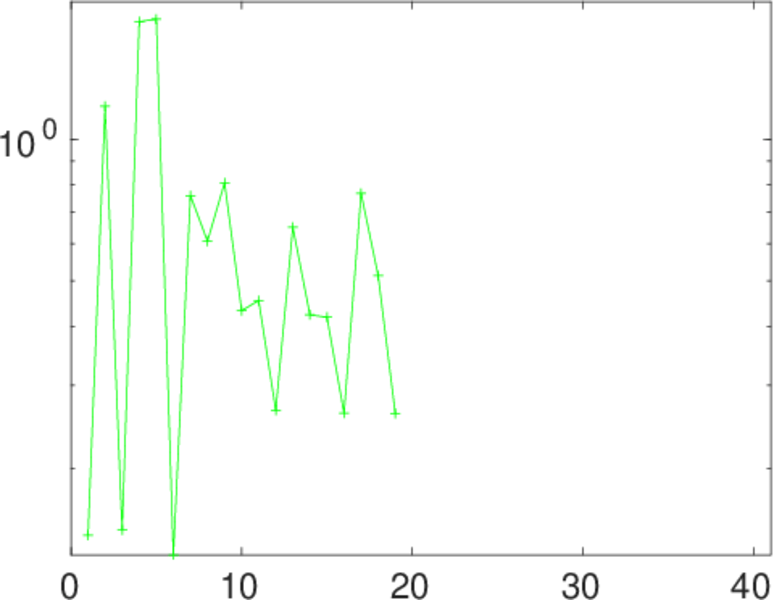
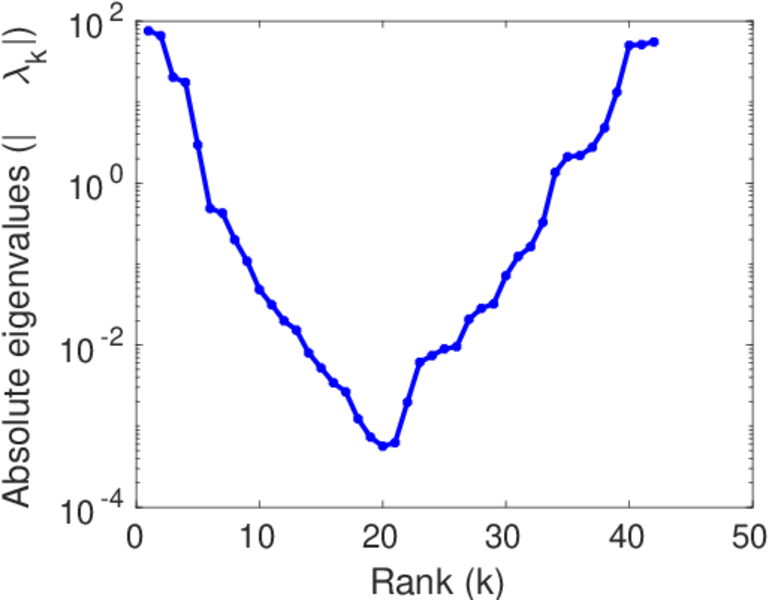
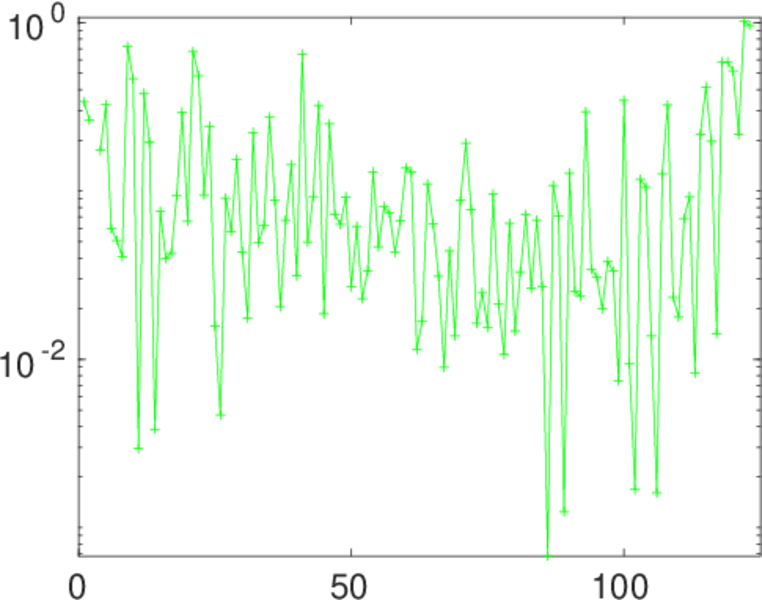
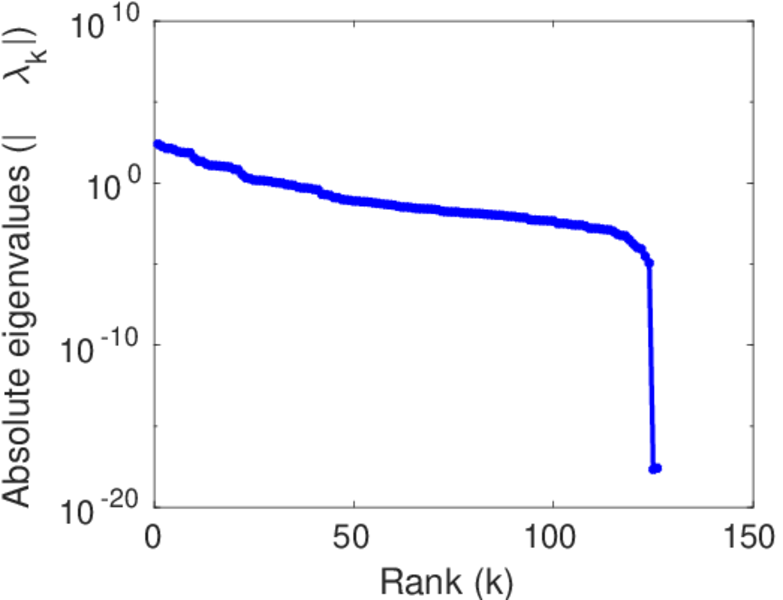
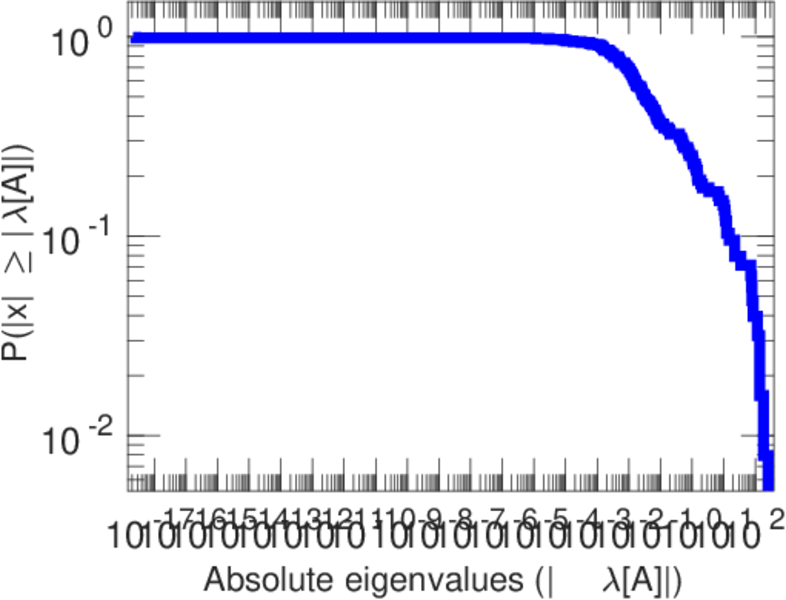
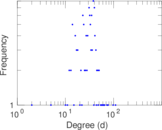
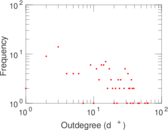
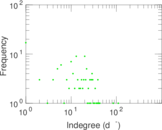
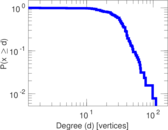
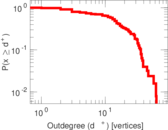
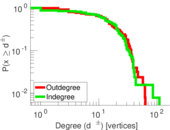
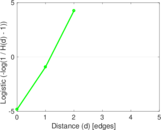
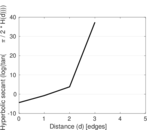
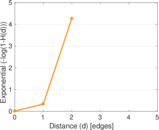
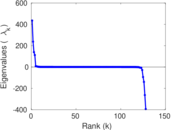
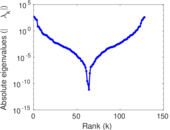
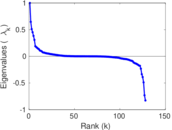
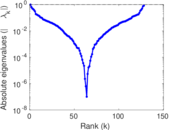
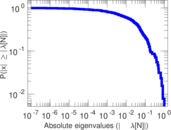
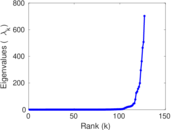
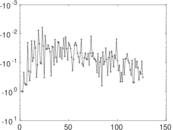
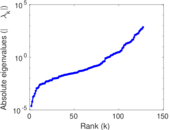
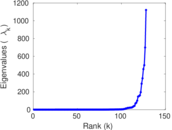
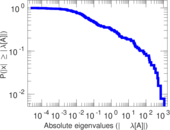
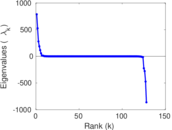
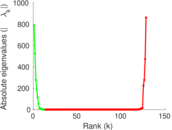
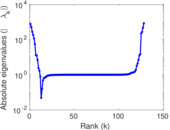
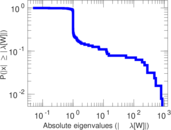
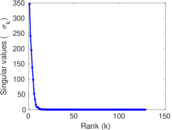
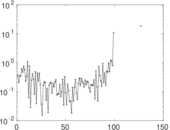
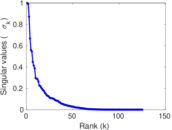
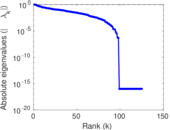
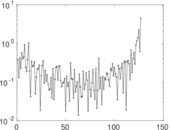
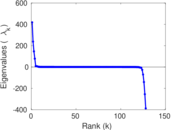
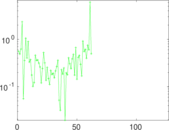
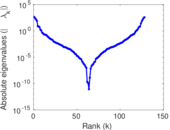
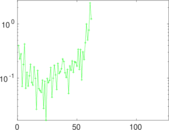
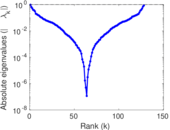
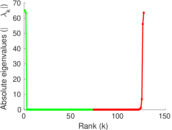
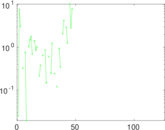
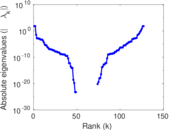
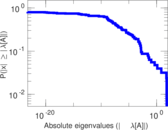
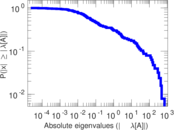
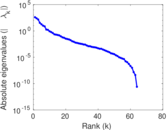
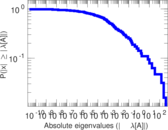
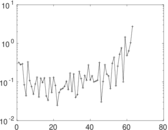
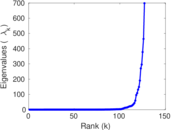
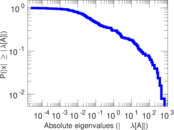
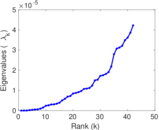
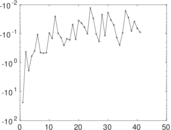
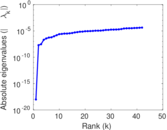
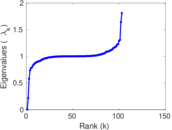
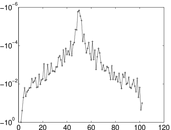
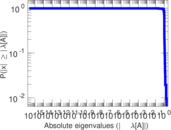
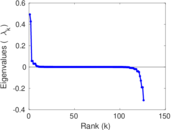
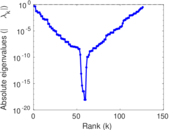
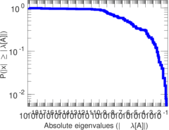
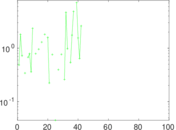
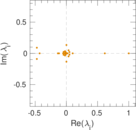
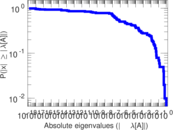
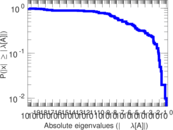
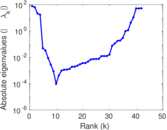
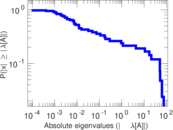
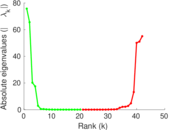
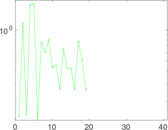
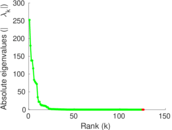
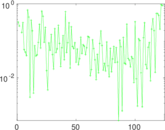
Plots


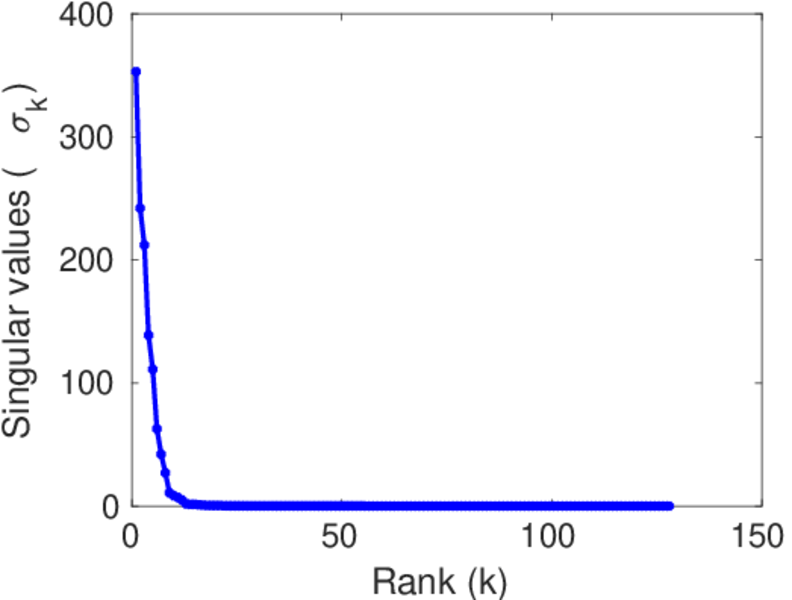
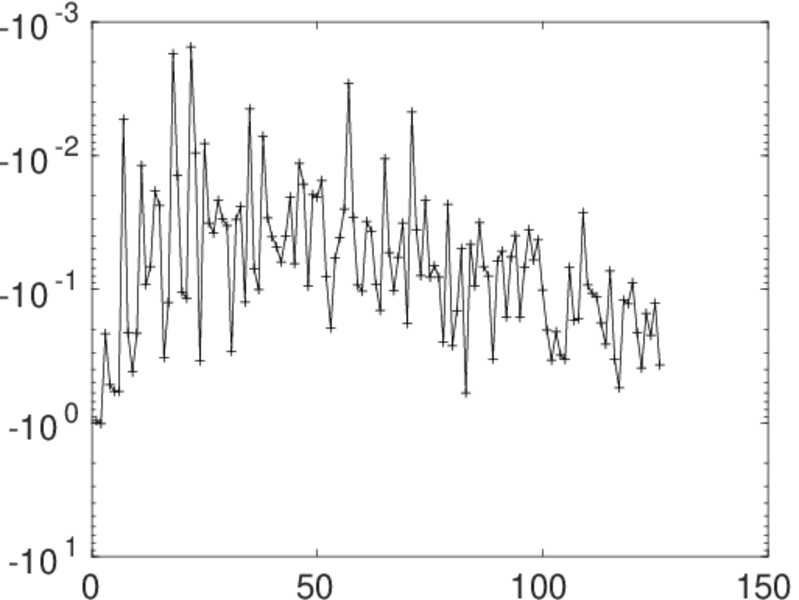
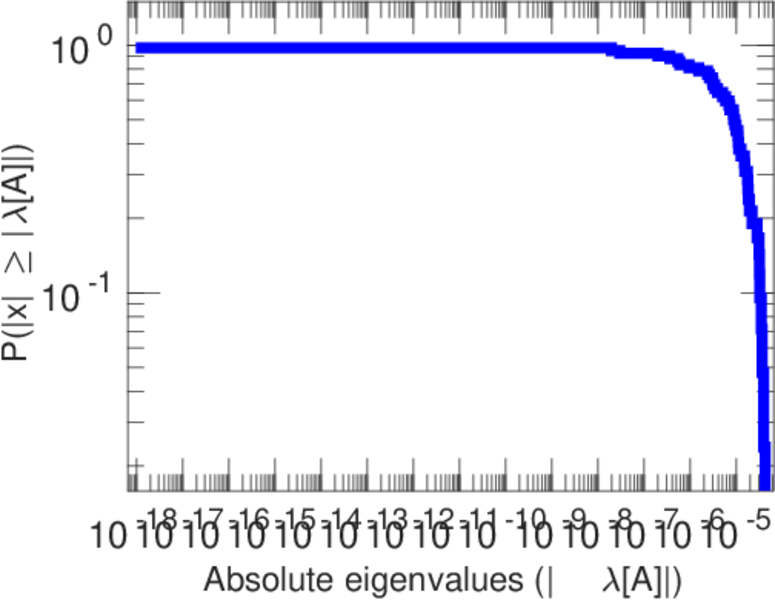
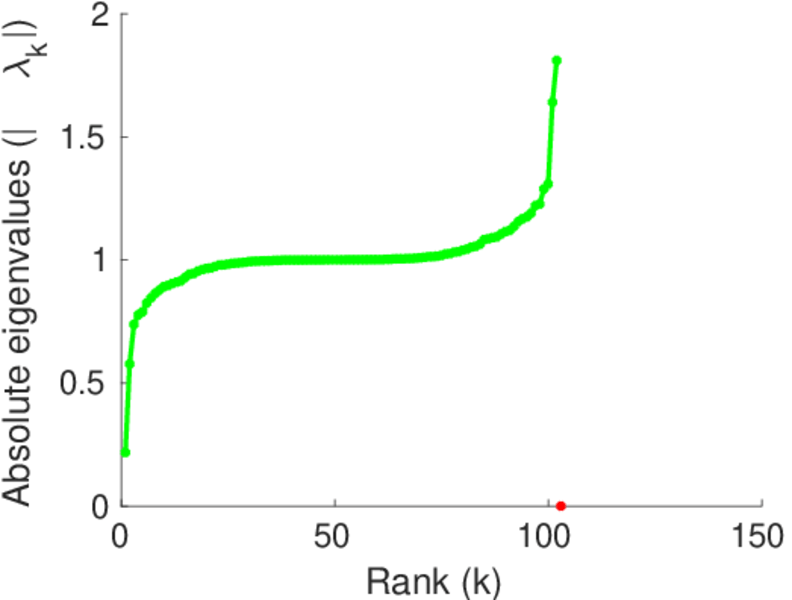
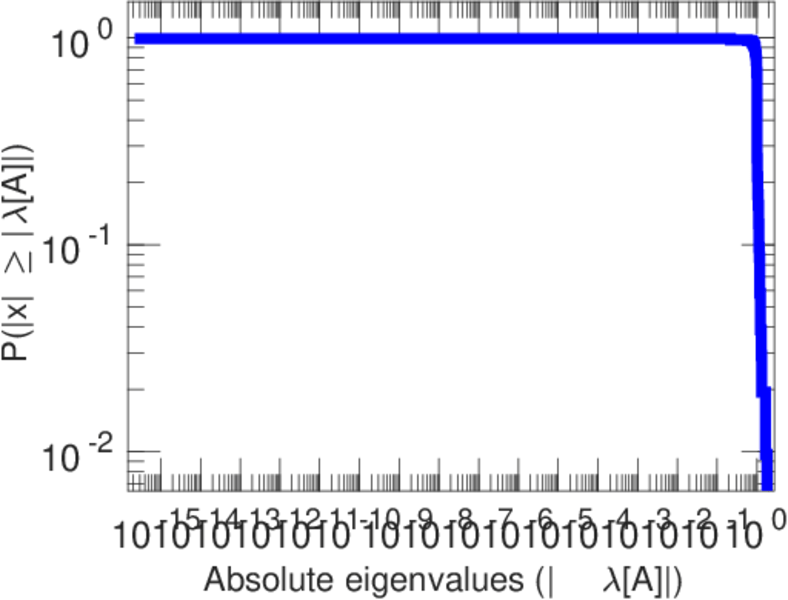
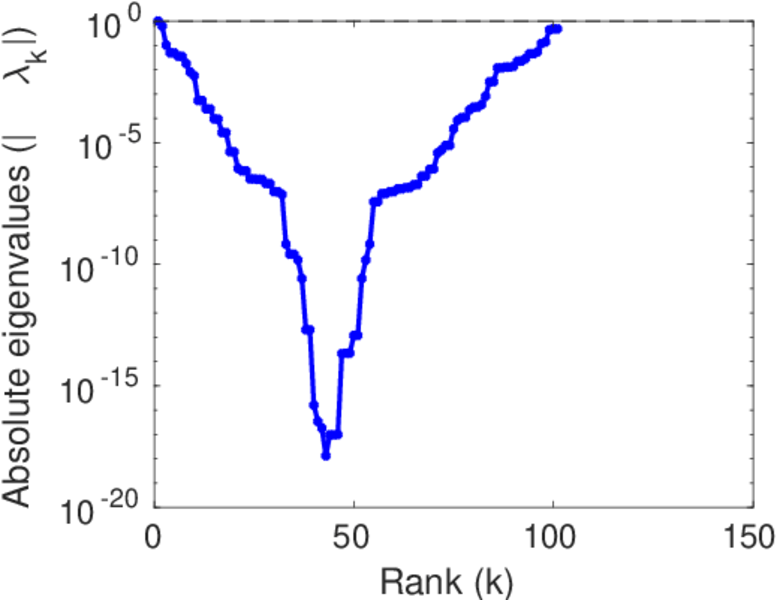
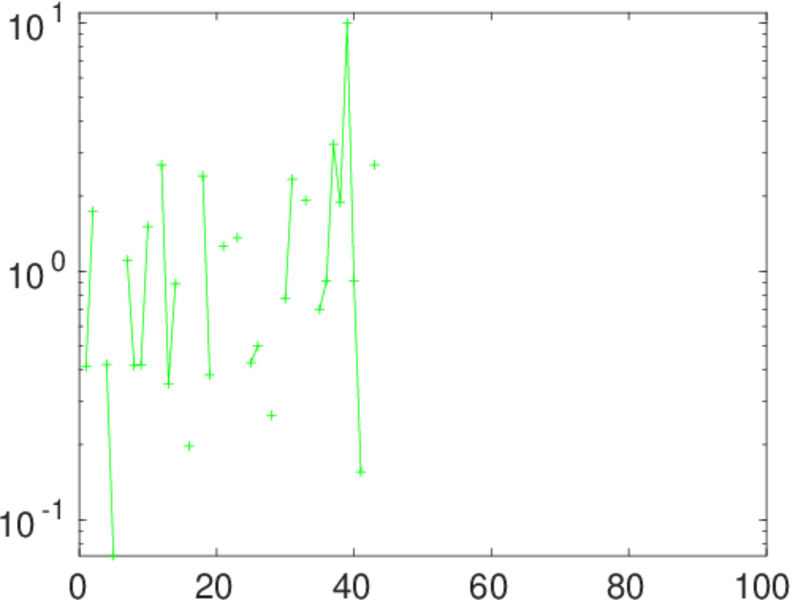
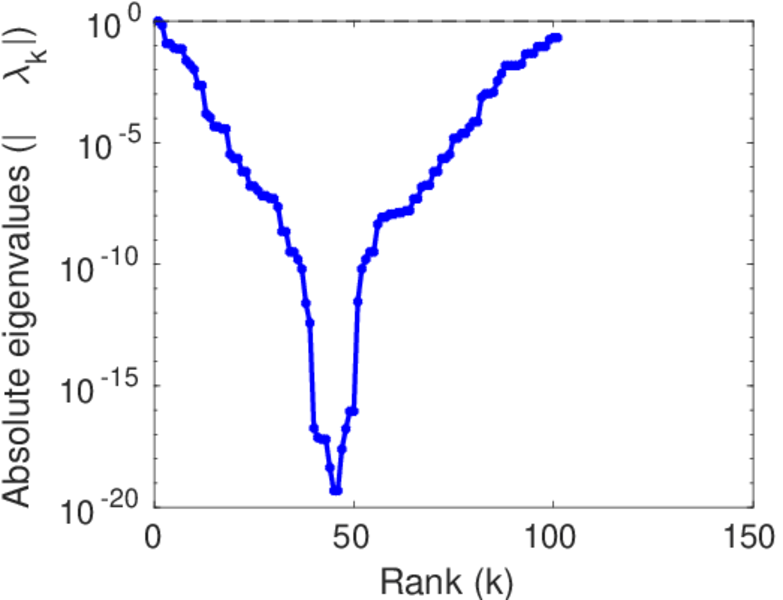
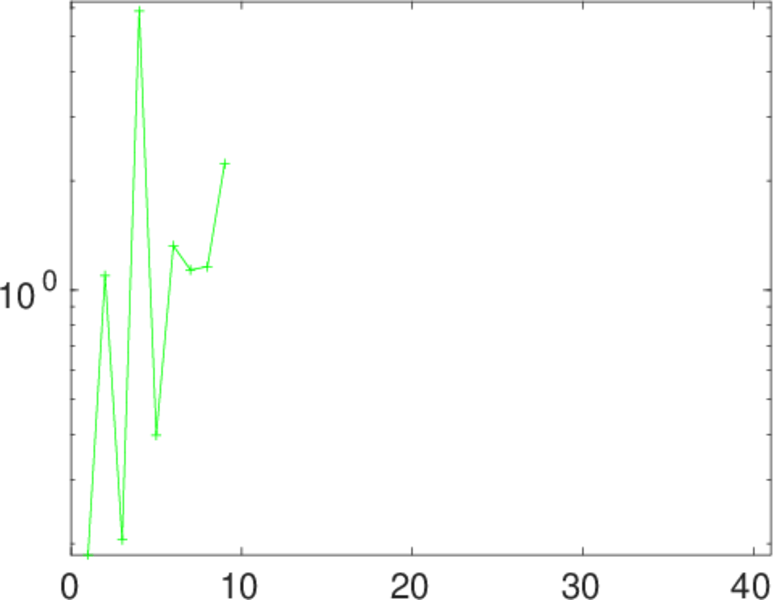
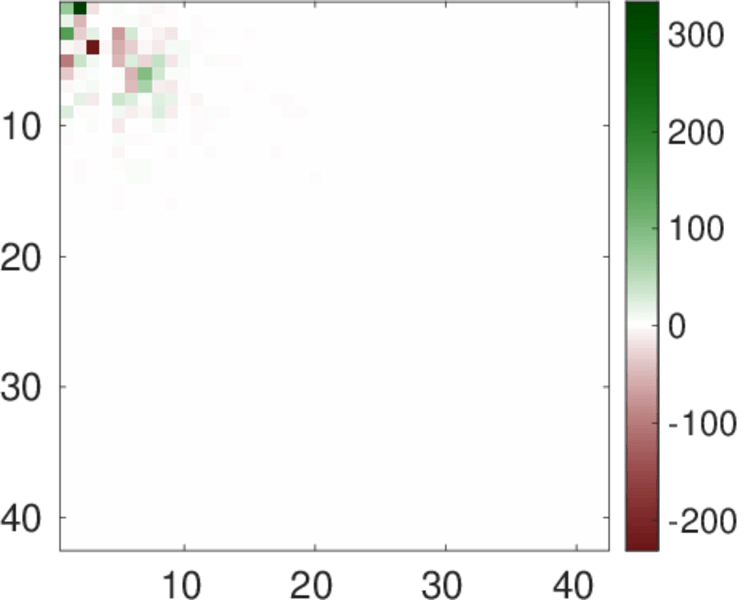
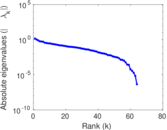
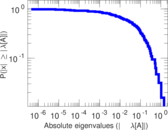
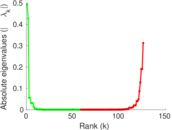
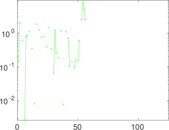
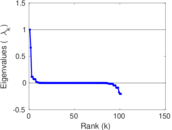
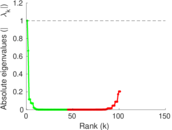
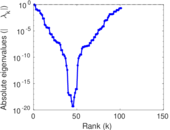
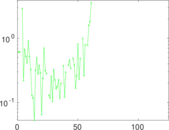
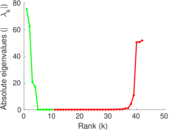
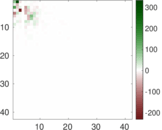
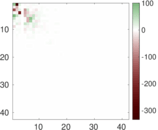
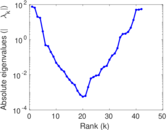
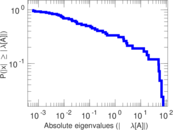
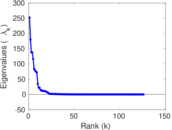
Matrix decompositions plots


Downloads
References
|
[1]
|
Jérôme Kunegis.
KONECT – The Koblenz Network Collection.
In Proc. Int. Conf. on World Wide Web Companion, pages
1343–1350, 2013.
[ http ]
|
|
[2]
|
Robert E. Ulanowicz, Johanna J. Heymans, and Michael S. Egnotovich.
Network analysis of trophic dynamics in South Florida ecosystems,
FY 99: The graminoid ecosystem.
Ann. Report to the United States Geological Service Biol.
Resources Division Ref. No.[UMCES] CBL 00-0176, Chesapeake Biological
Laboratory, Univ. of Maryland, 2000.
|
 KONECT ‣ Networks ‣
Buy Me a Coffee
KONECT ‣ Networks ‣
Buy Me a Coffee