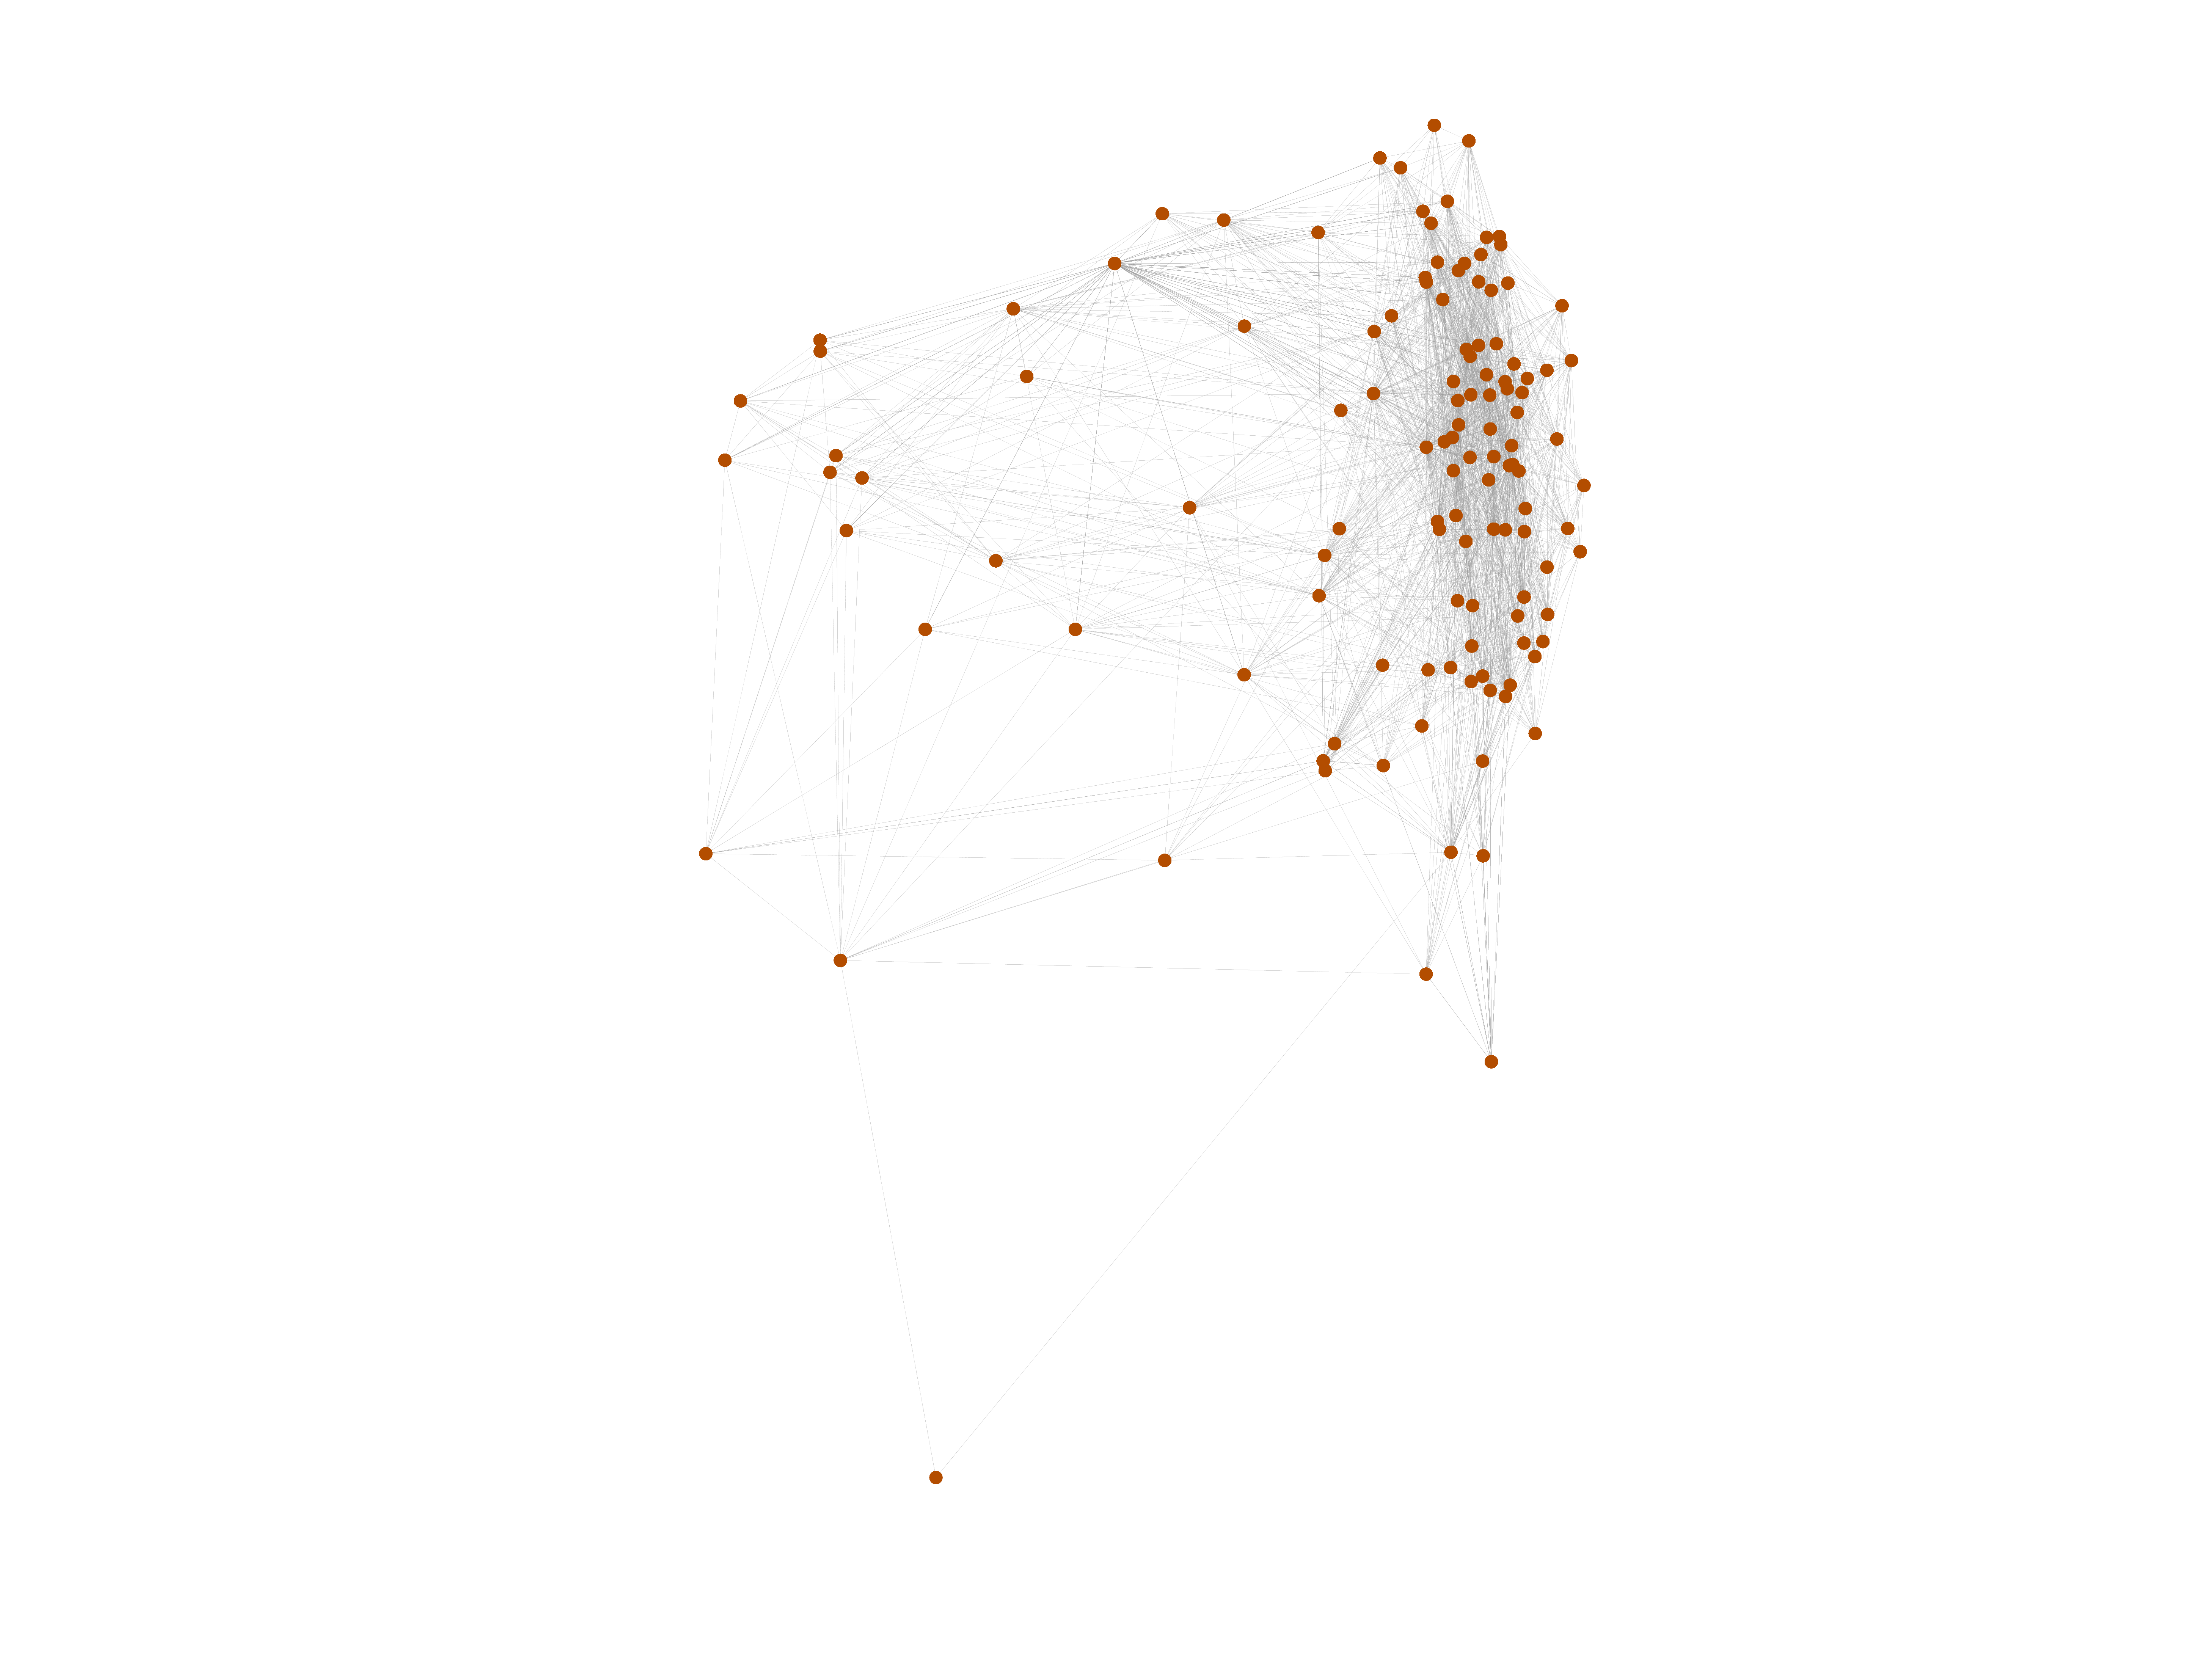
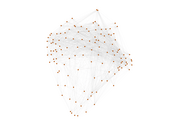
Florida ecosystem wet
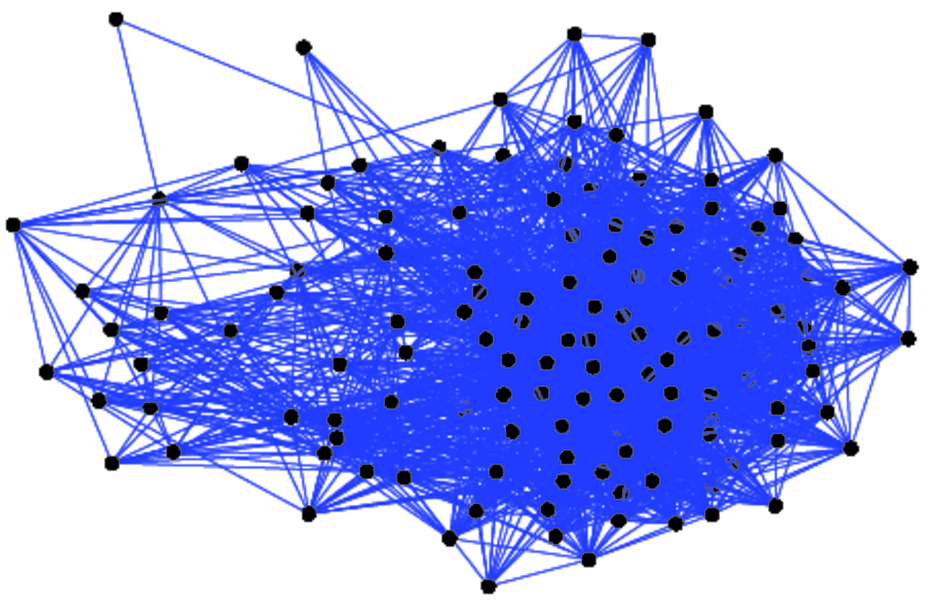
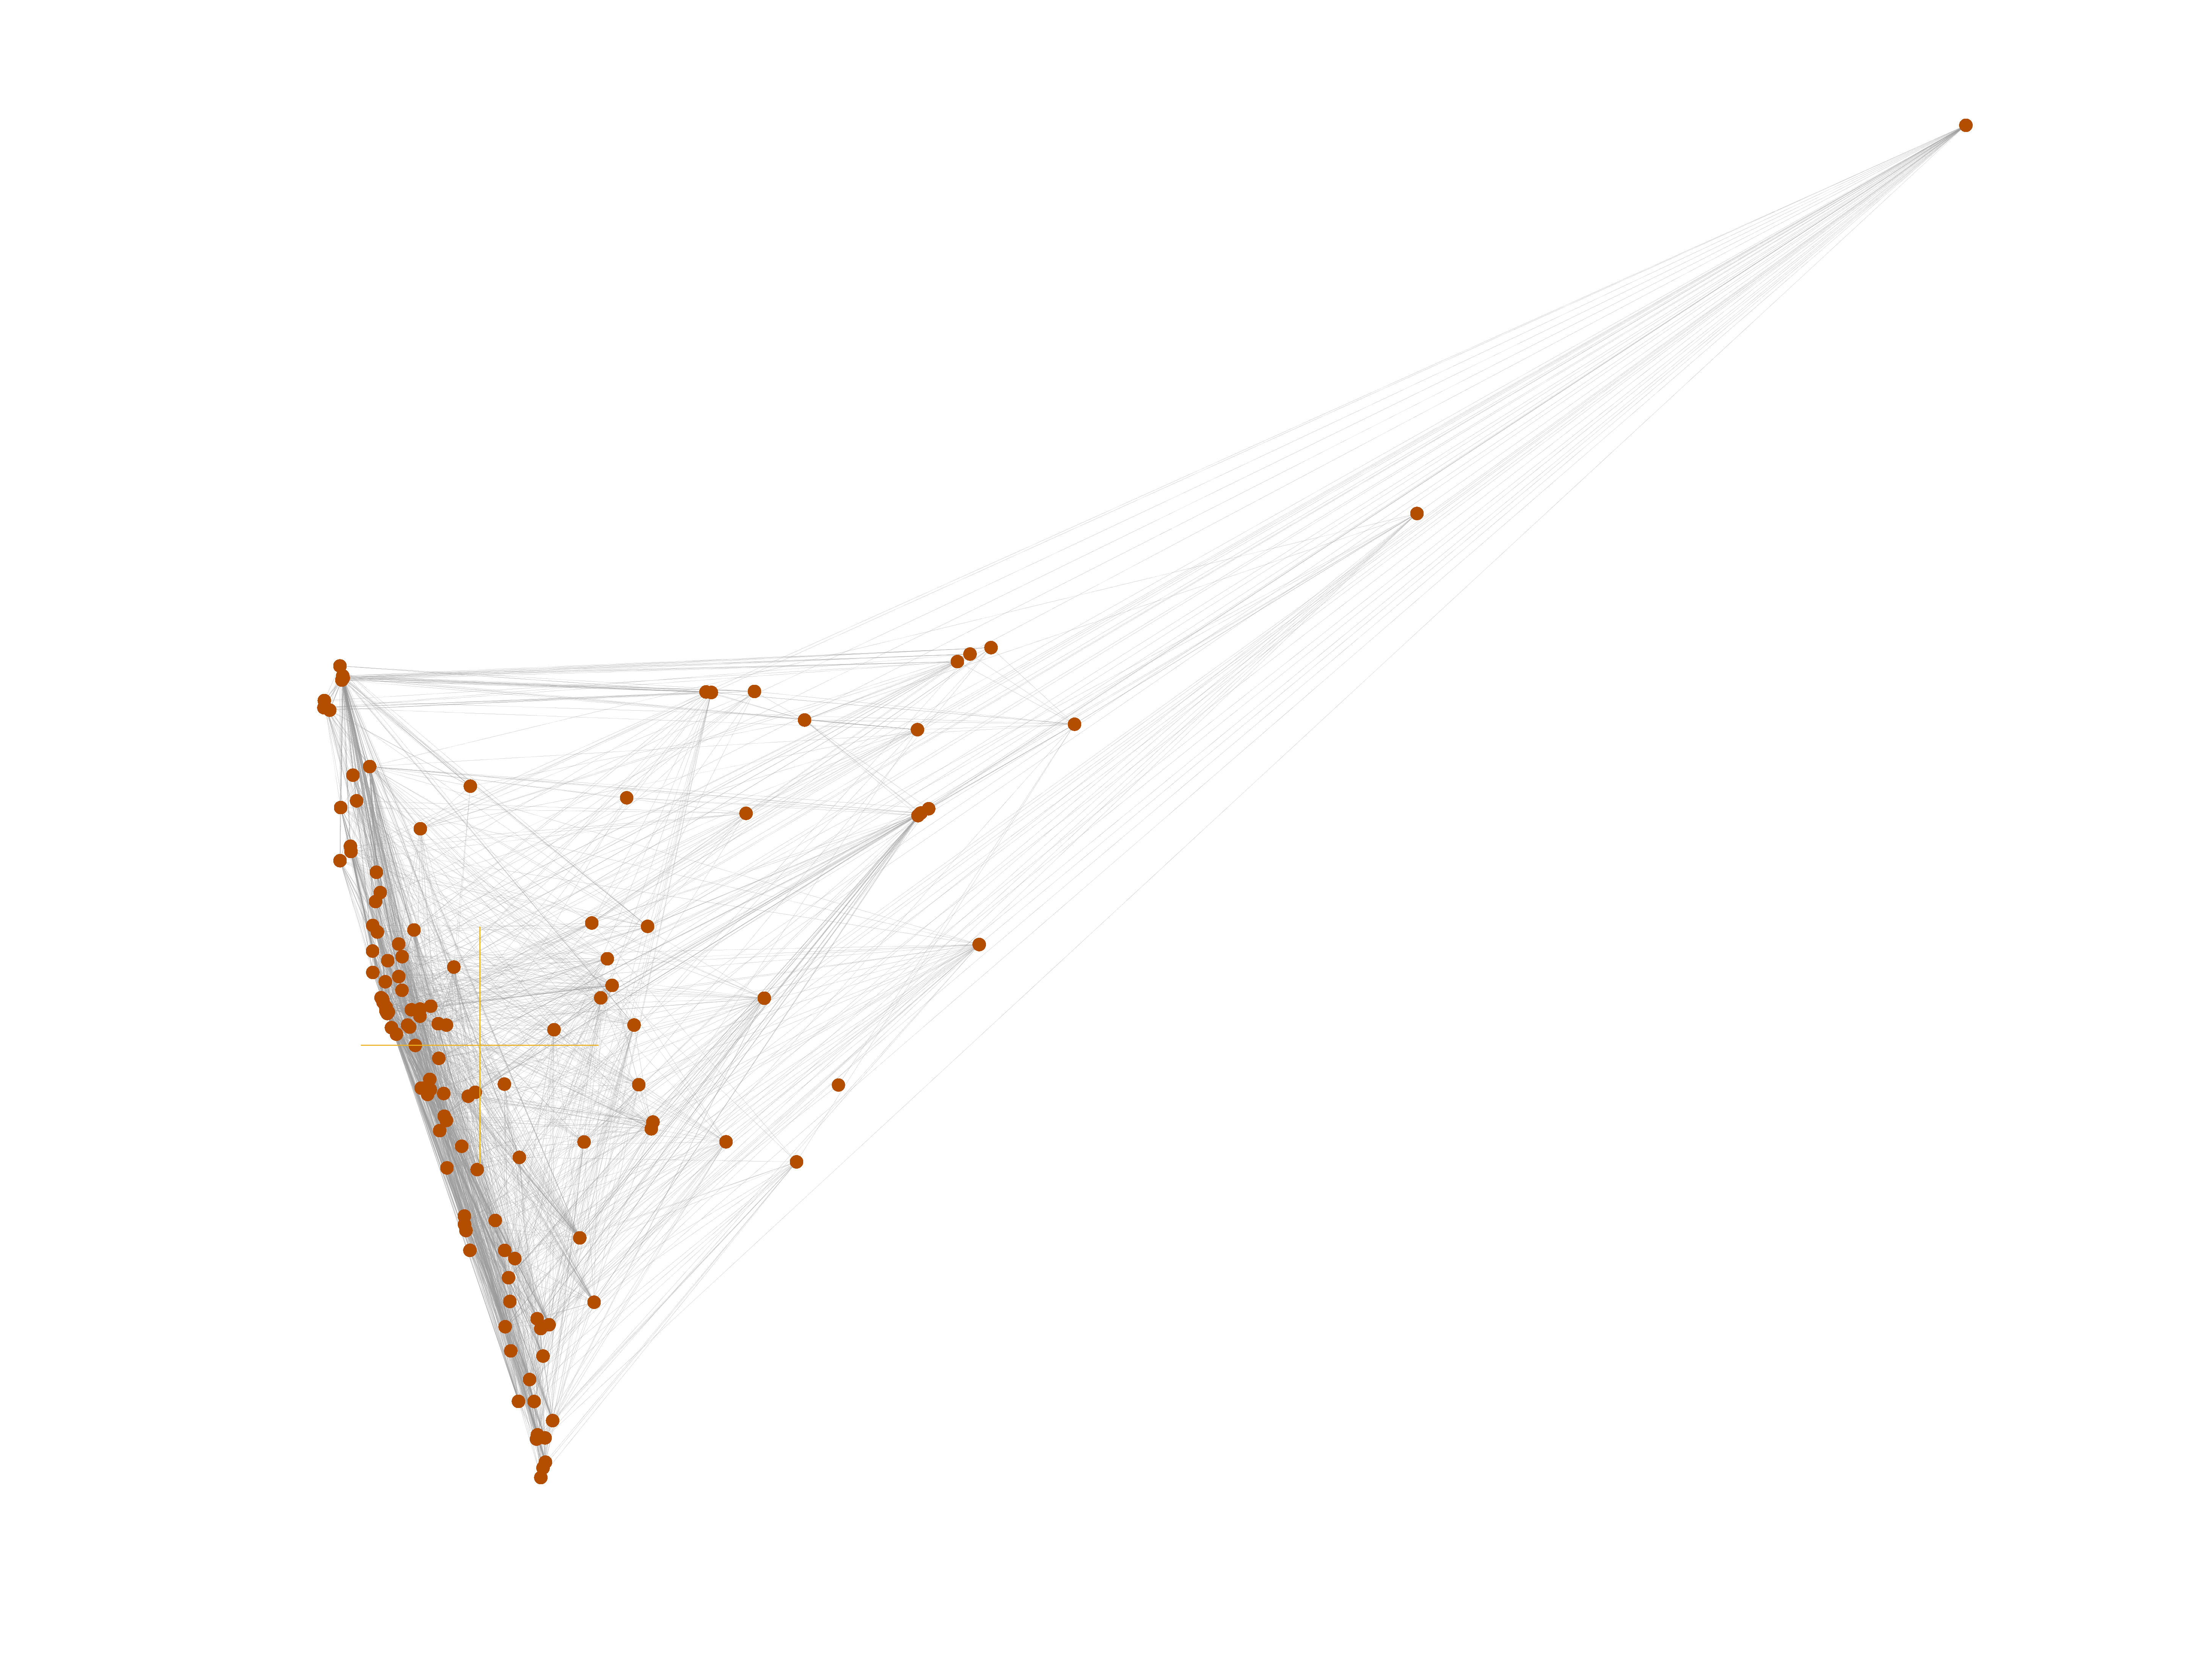
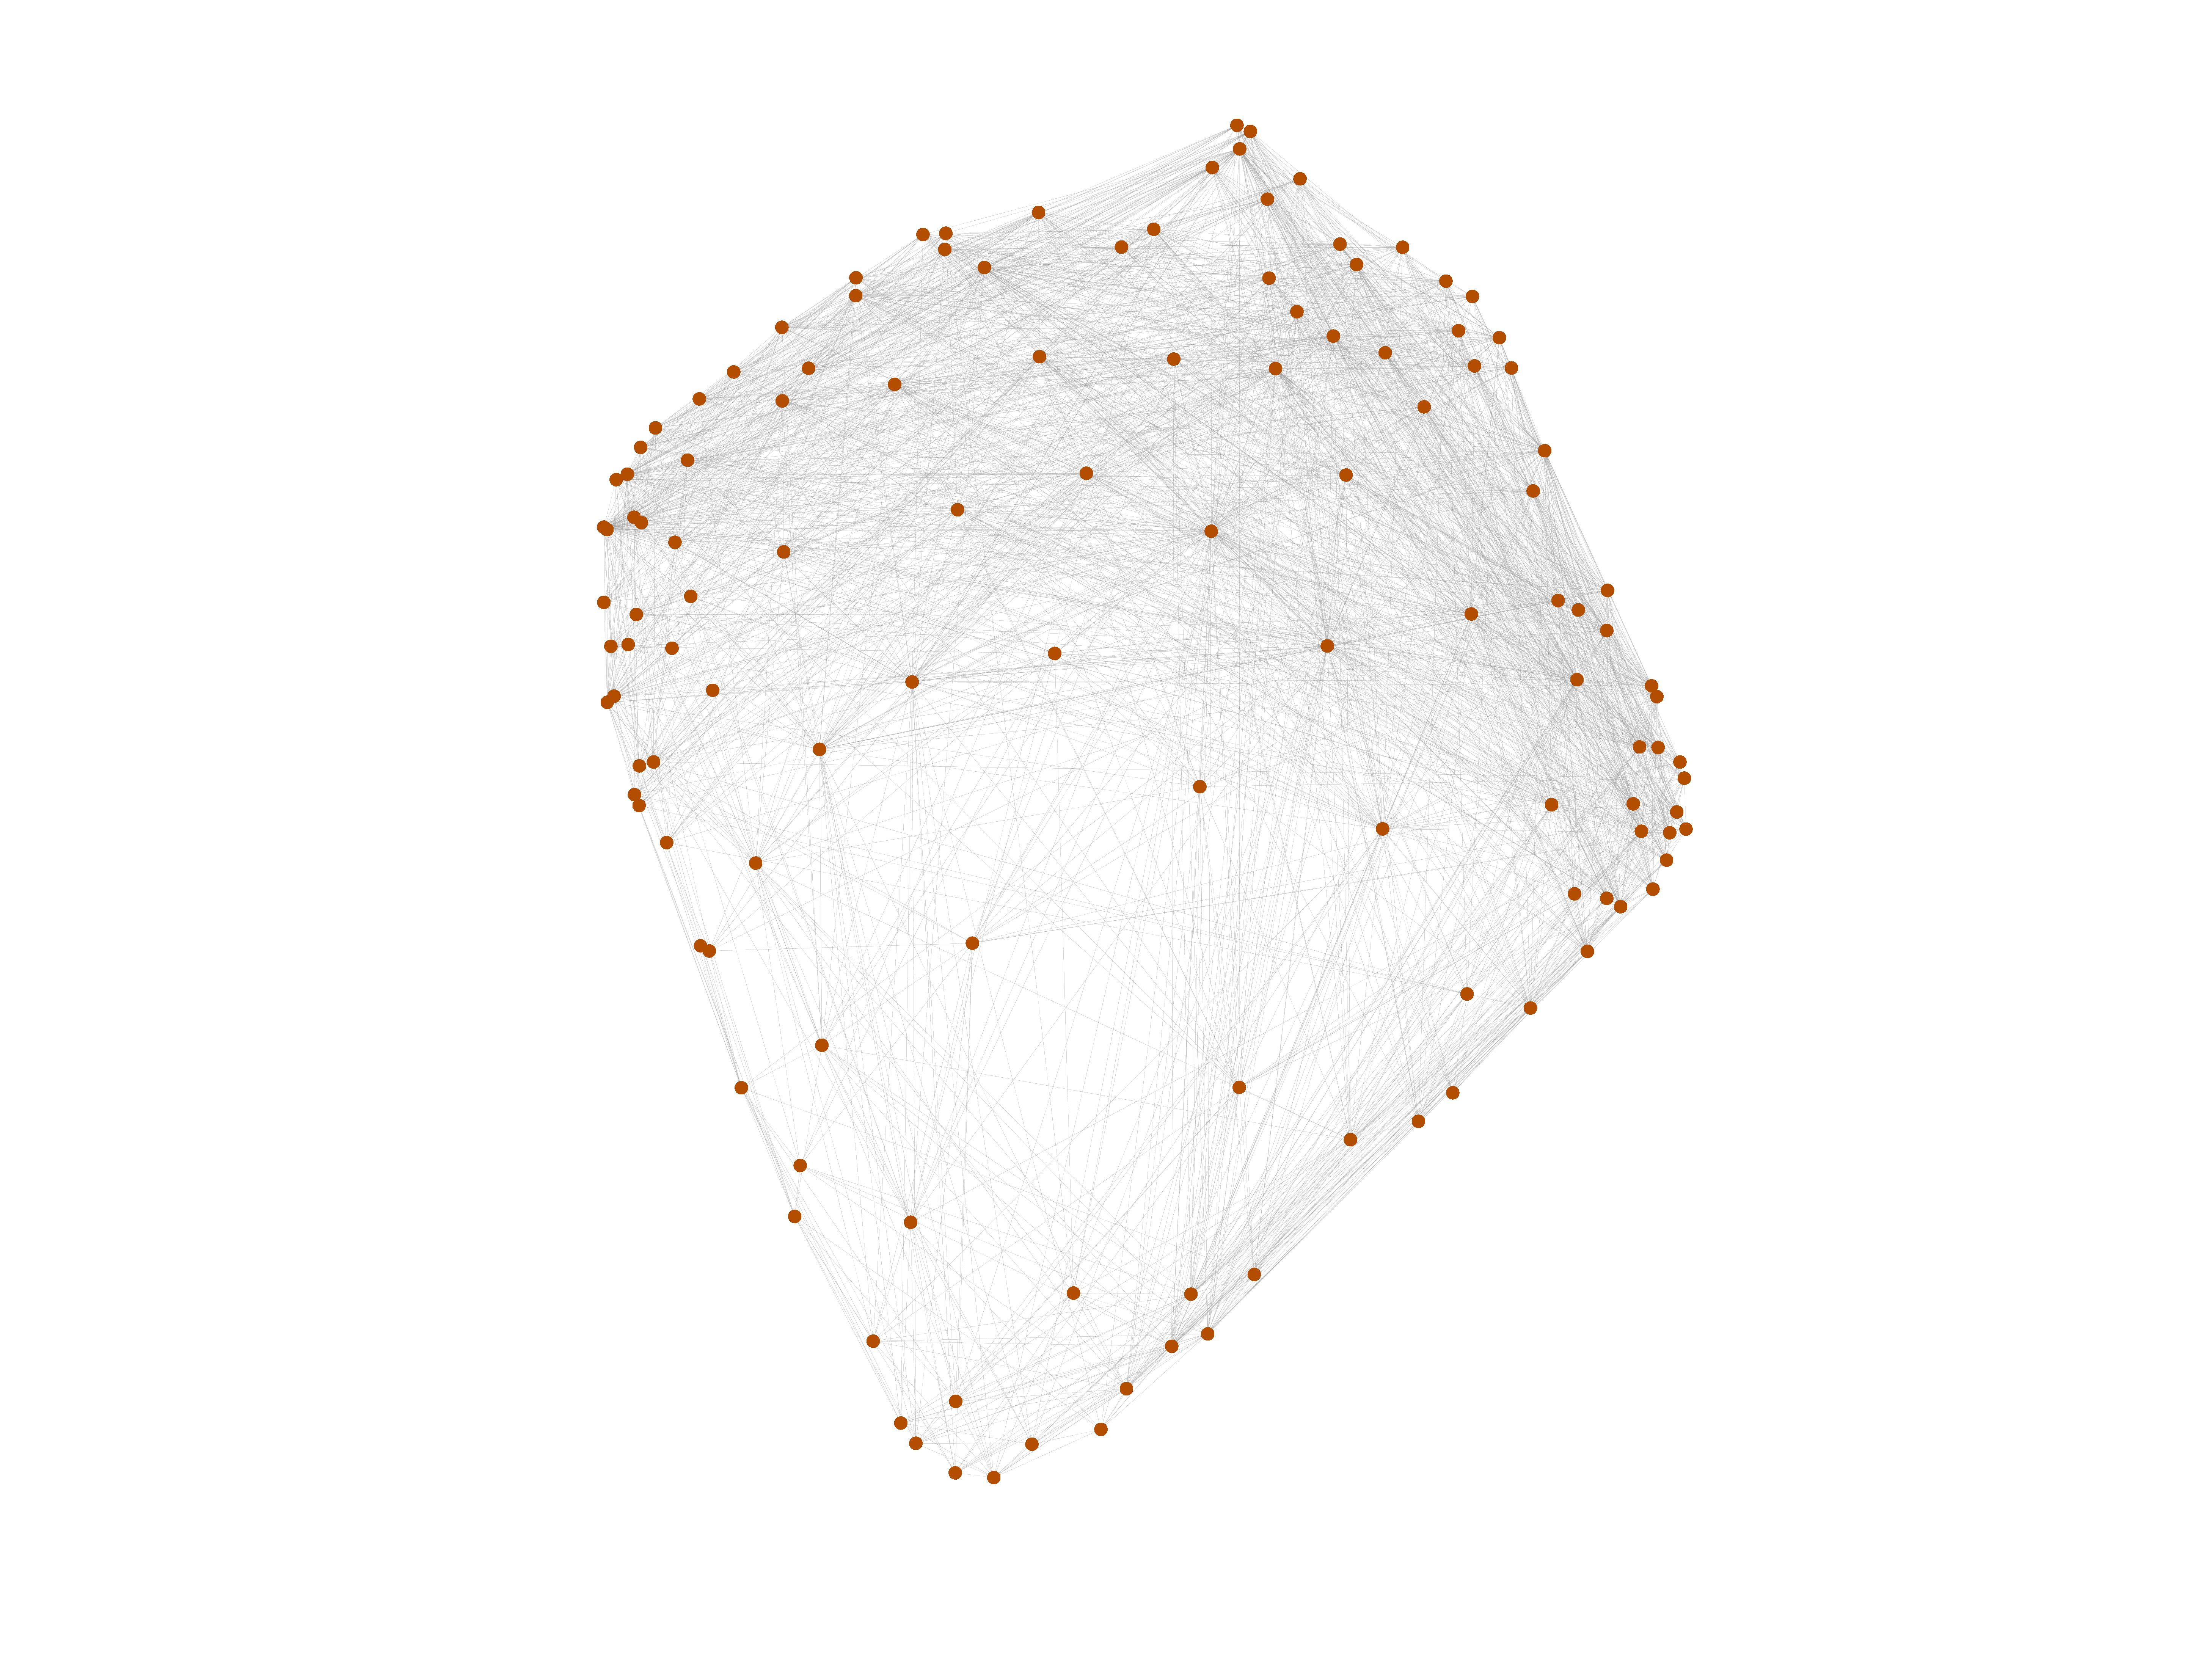
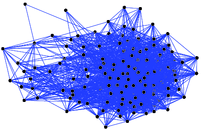
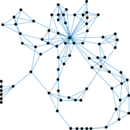
This network contains the carbon exchanges in the cypress wetlands of South
Florida during the wet season. Nodes represent taxa and an an edge denotes that
a taxon uses another taxon as food with a given trophic factor (feeding level).
Metadata
Statistics
| Size | n = | 128
|
| Volume | m = | 2,106
|
| Loop count | l = | 0
|
| Wedge count | s = | 81,147
|
| Claw count | z = | 1,380,155
|
| Cross count | x = | 20,997,705
|
| Triangle count | t = | 8,437
|
| Square count | q = | 318,981
|
| 4-Tour count | T4 = | 2,880,586
|
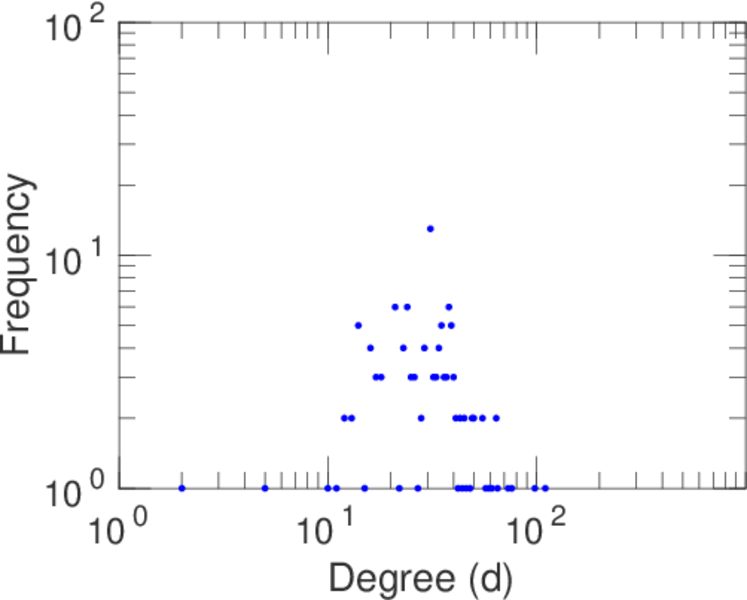
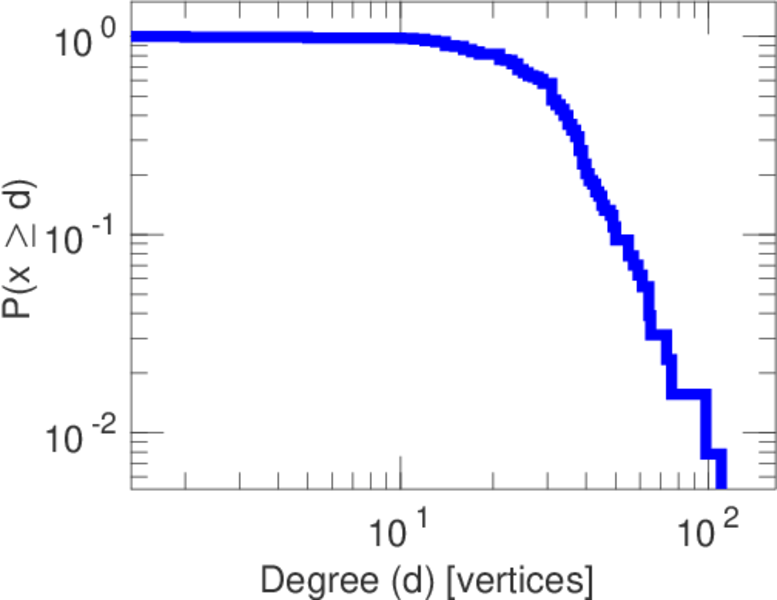
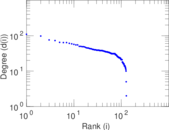
| Maximum degree | dmax = | 110
|
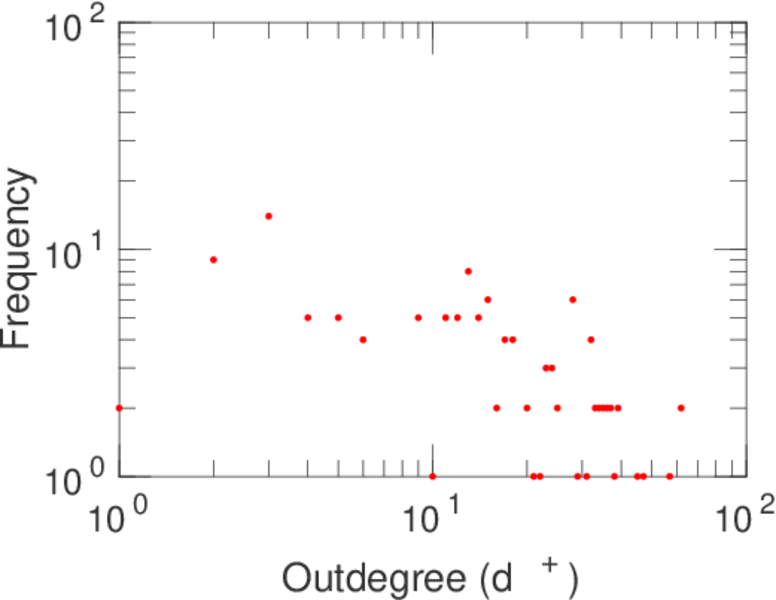
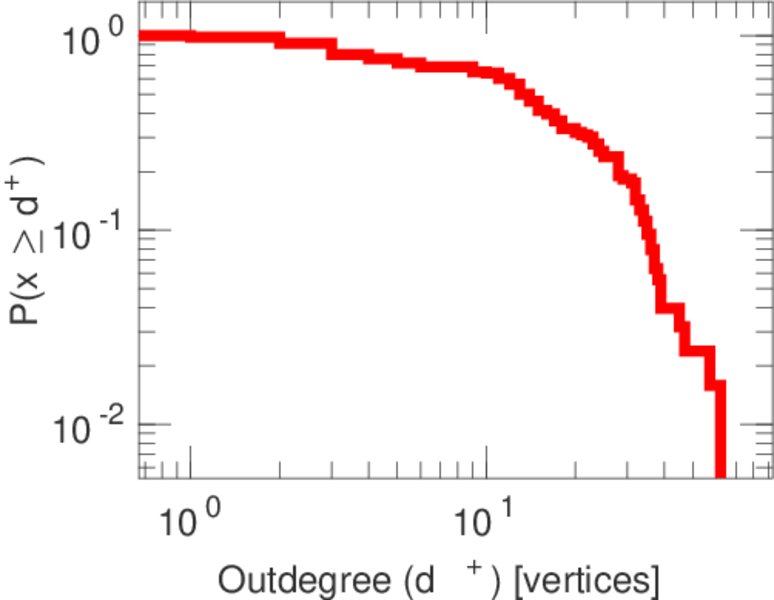
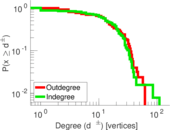
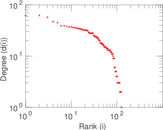
| Maximum outdegree | d+max = | 62
|
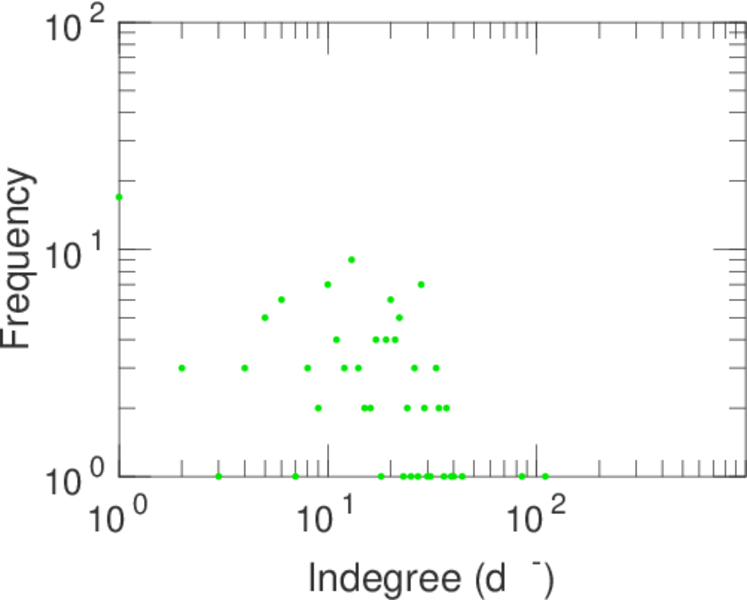
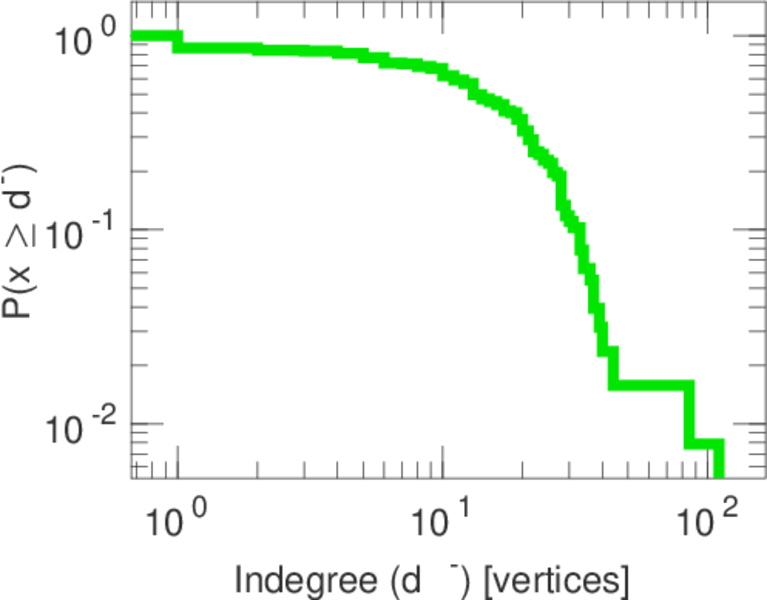
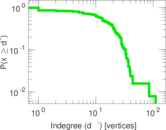
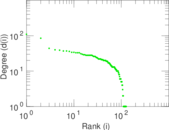
| Maximum indegree | d−max = | 110
|
| Average degree | d = | 32.906 2
|
| Fill | p = | 0.129 552
|
| Size of LCC | N = | 128
|
| Size of LSCC | Ns = | 103
|
| Relative size of LSCC | Nrs = | 0.804 688
|
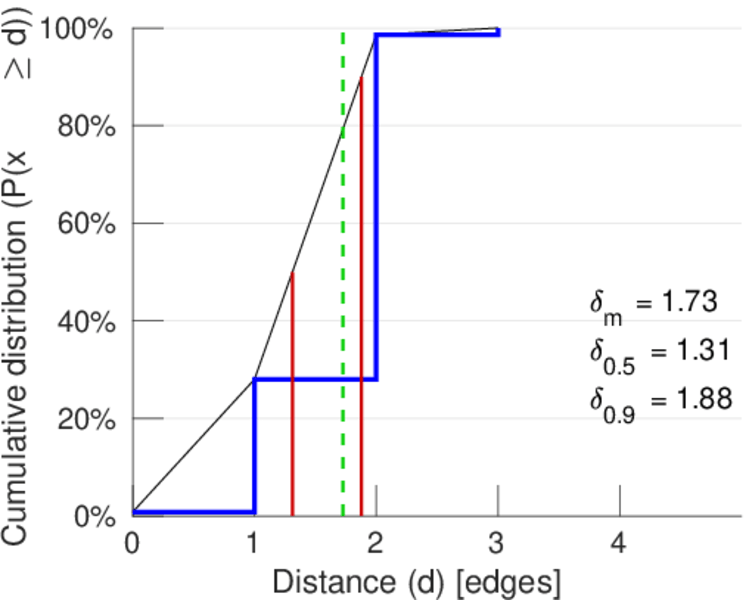
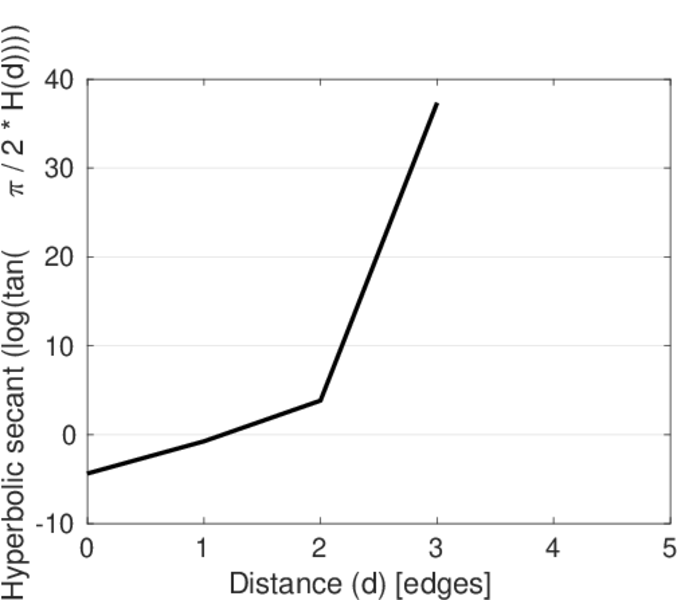
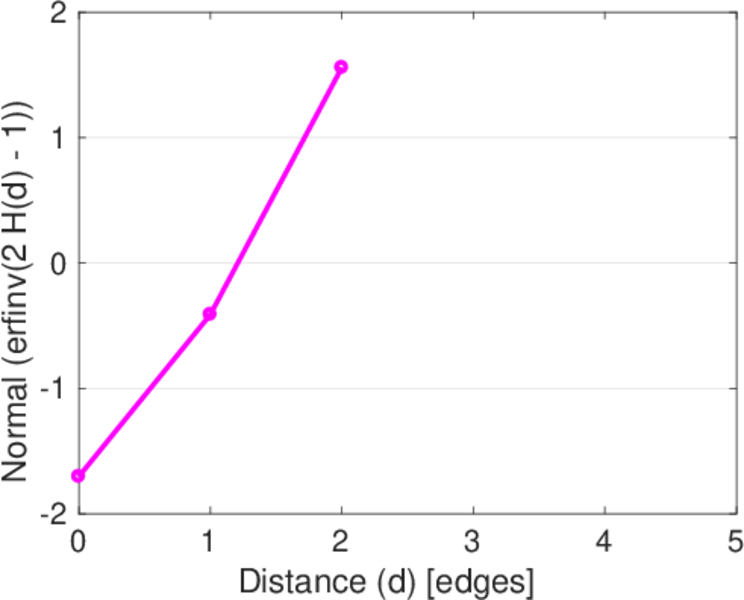
| Diameter | δ = | 3
|
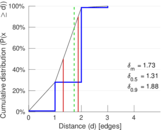
| 50-Percentile effective diameter | δ0.5 = | 1.311 61
|
| 90-Percentile effective diameter | δ0.9 = | 1.877 97
|
| Median distance | δM = | 2
|
| Mean distance | δm = | 1.725 93
|
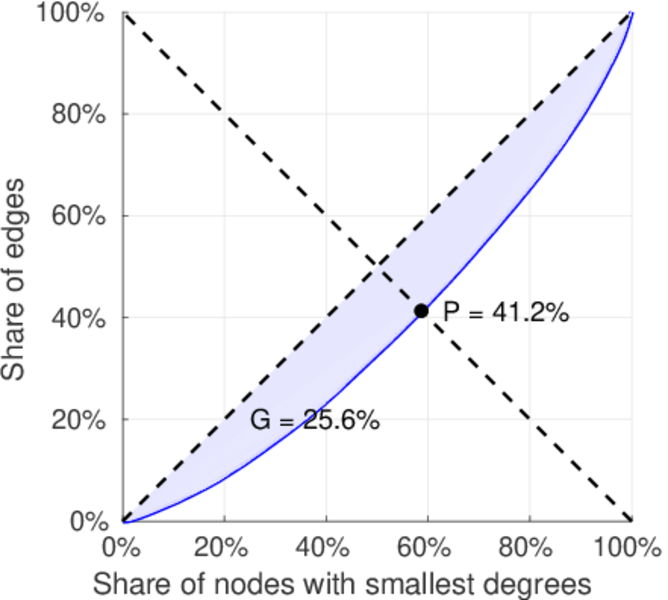
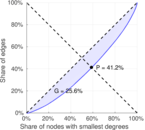
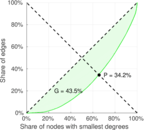
| Gini coefficient | G = | 0.255 832
|
| Balanced inequality ratio | P = | 0.411 681
|
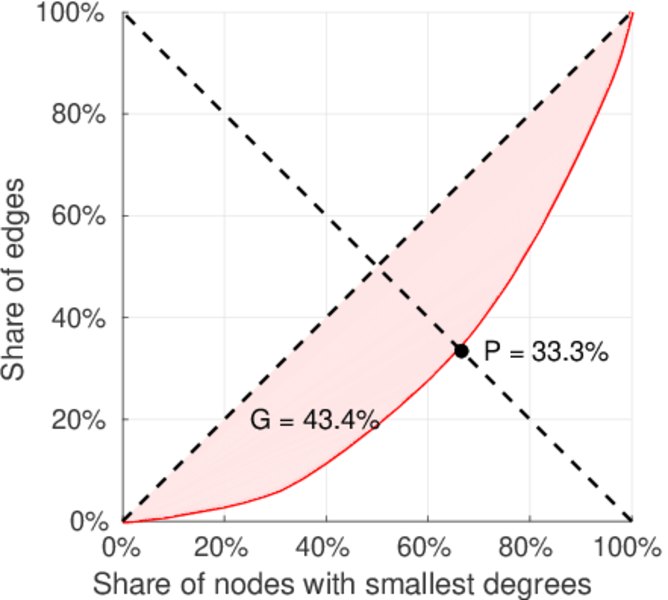
| Outdegree balanced inequality ratio | P+ = | 0.332 858
|
| Indegree balanced inequality ratio | P− = | 0.342 355
|
| Relative edge distribution entropy | Her = | 0.976 754
|
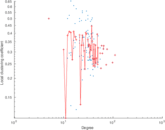
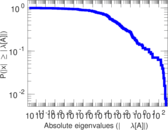
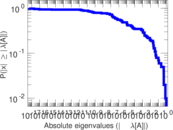
| Power law exponent | γ = | 1.375 34
|
| Tail power law exponent | γt = | 4.871 00
|
| Tail power law exponent with p | γ3 = | 4.871 00
|
| p-value | p = | 0.885 000
|
| Outdegree tail power law exponent with p | γ3,o = | 5.981 00
|
| Outdegree p-value | po = | 0.522 000
|
| Indegree tail power law exponent with p | γ3,i = | 4.551 00
|
| Indegree p-value | pi = | 0.315 000
|
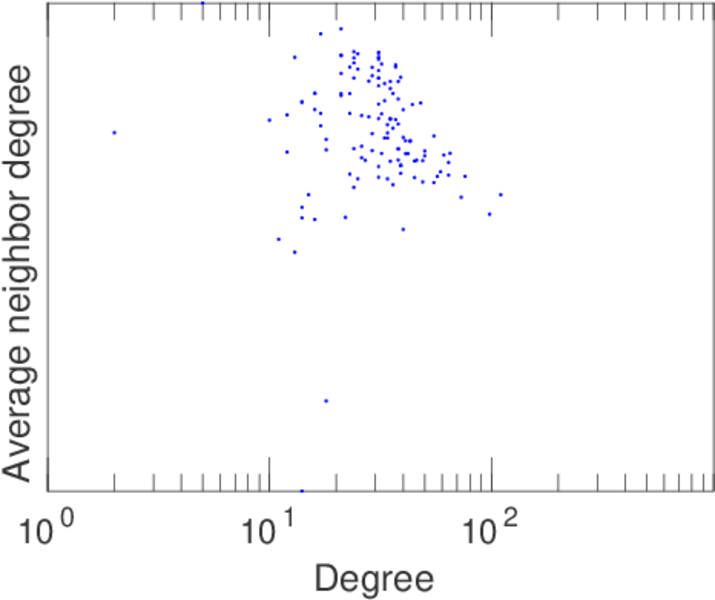
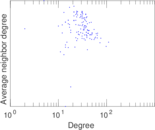
| Degree assortativity | ρ = | −0.111 663
|
| Degree assortativity p-value | pρ = | 5.441 65 × 10−13
|
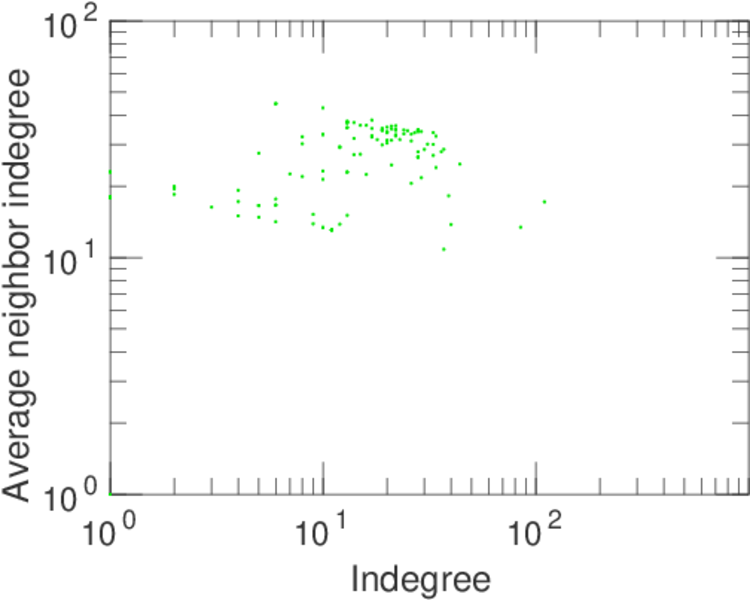
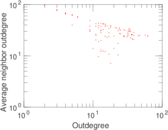
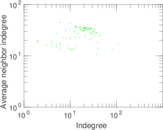
| In/outdegree correlation | ρ± = | −0.388 873
|
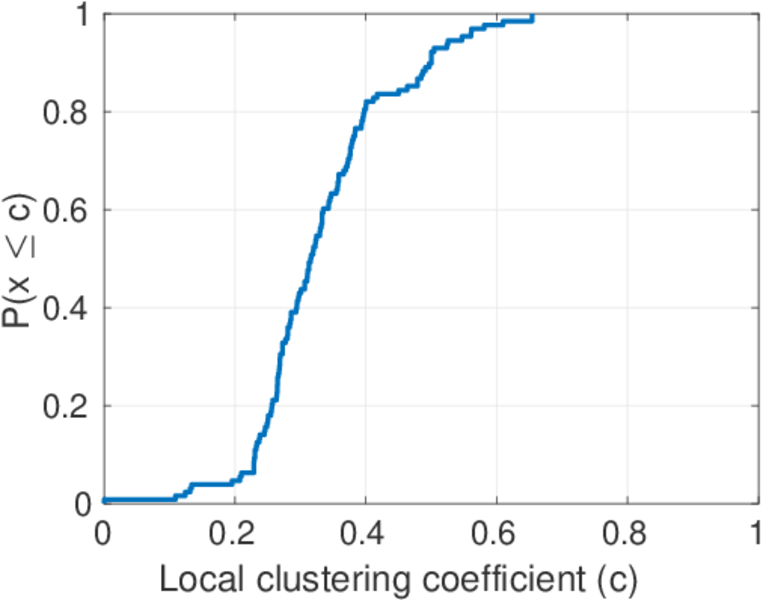
| Clustering coefficient | c = | 0.311 915
|
| Directed clustering coefficient | c± = | 0.336 953
|
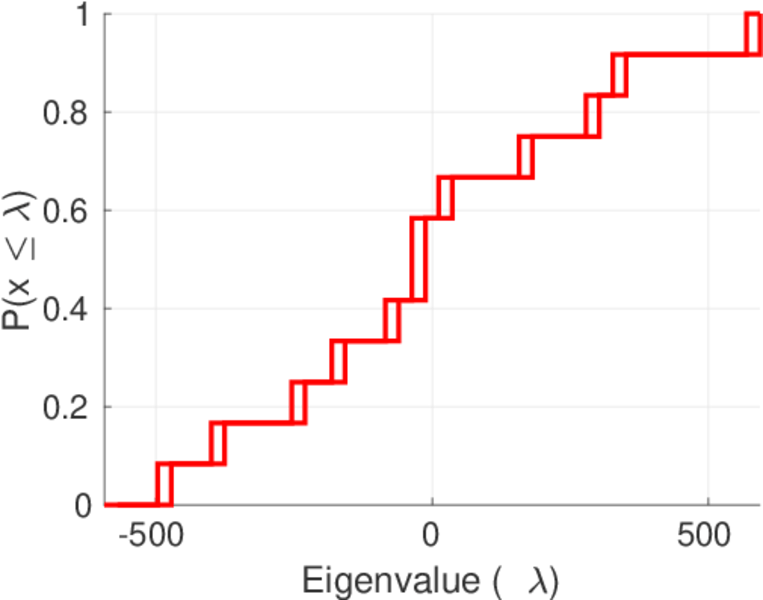
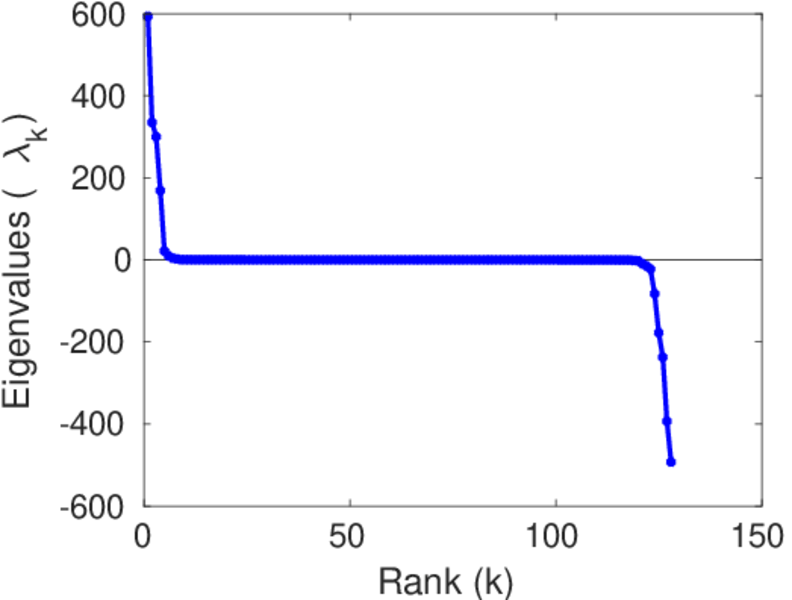
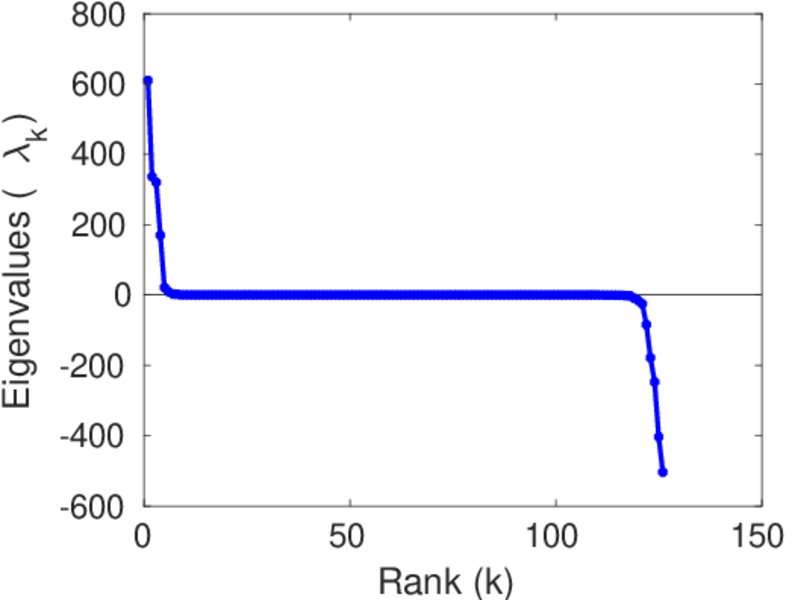
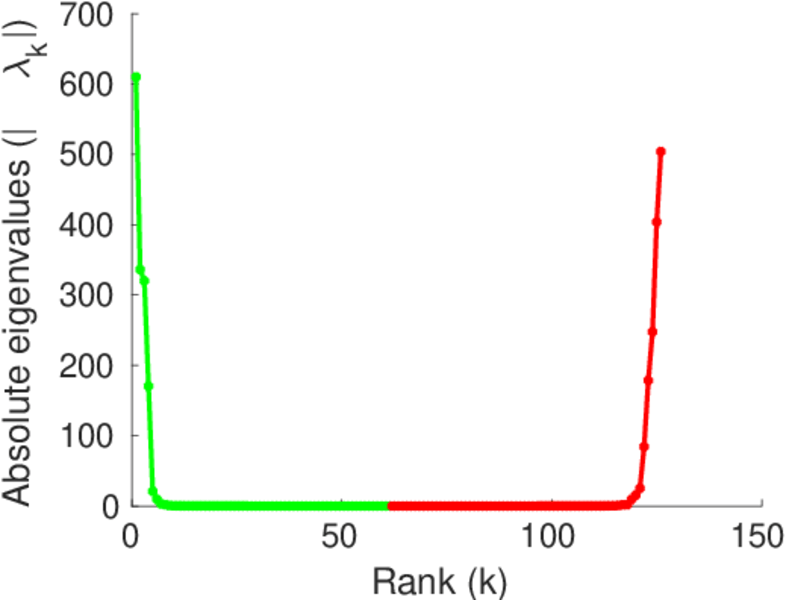
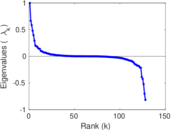
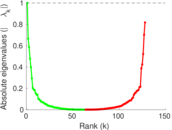
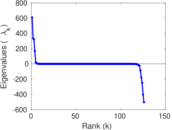
| Spectral norm | α = | 593.416
|
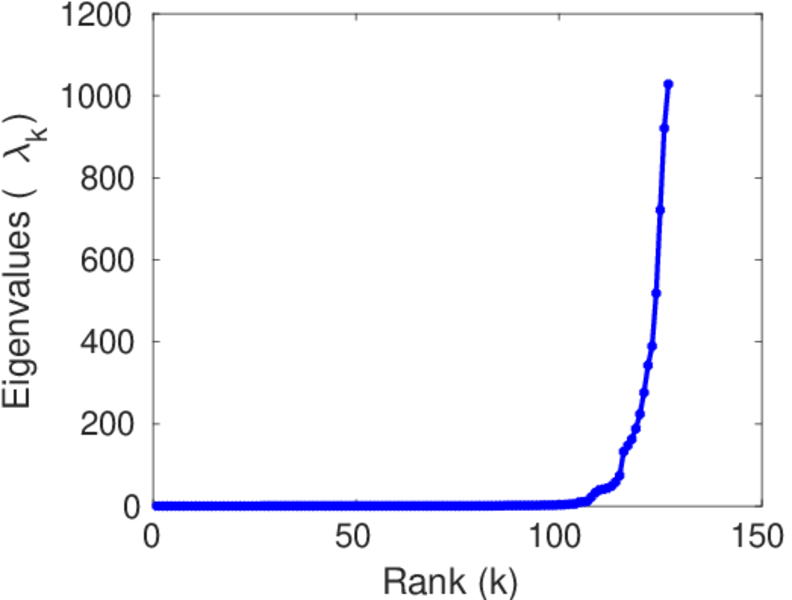
| Operator 2-norm | ν = | 407.812
|
| Cyclic eigenvalue | π = | 164.603
|
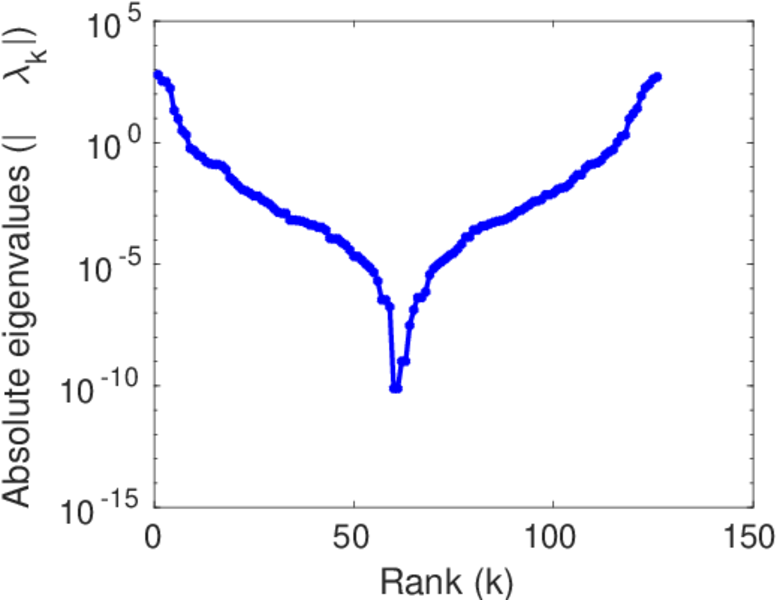
| Algebraic connectivity | a = | 3.042 23 × 10−5
|
| Spectral separation | |λ1[A] / λ2[A]| = | 1.204 30
|
| Reciprocity | y = | 0.029 439 7
|
| Non-bipartivity | bA = | 0.494 702
|
| Normalized non-bipartivity | bN = | 0.446 582
|
| Algebraic non-bipartivity | χ = | 1.907 39
|
| Spectral bipartite frustration | bK = | 0.014 707 6
|
| Controllability | C = | 30
|
| Relative controllability | Cr = | 0.234 375
|
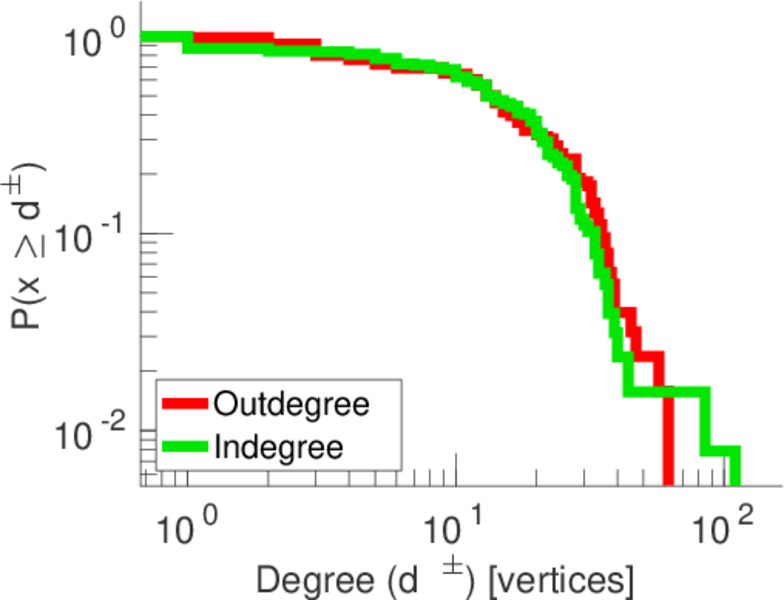
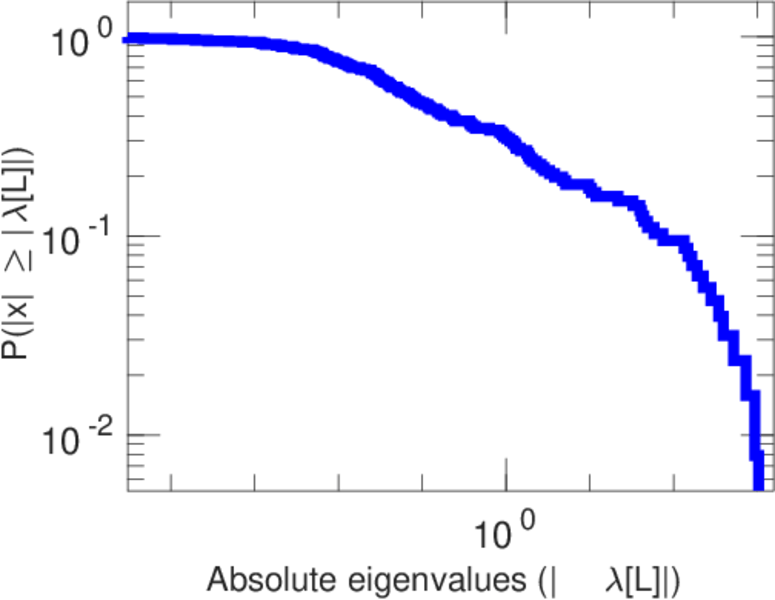
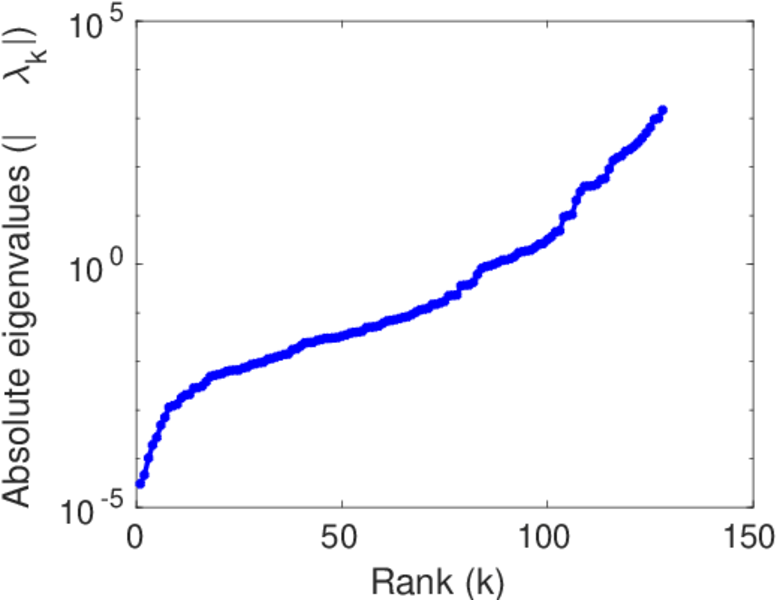
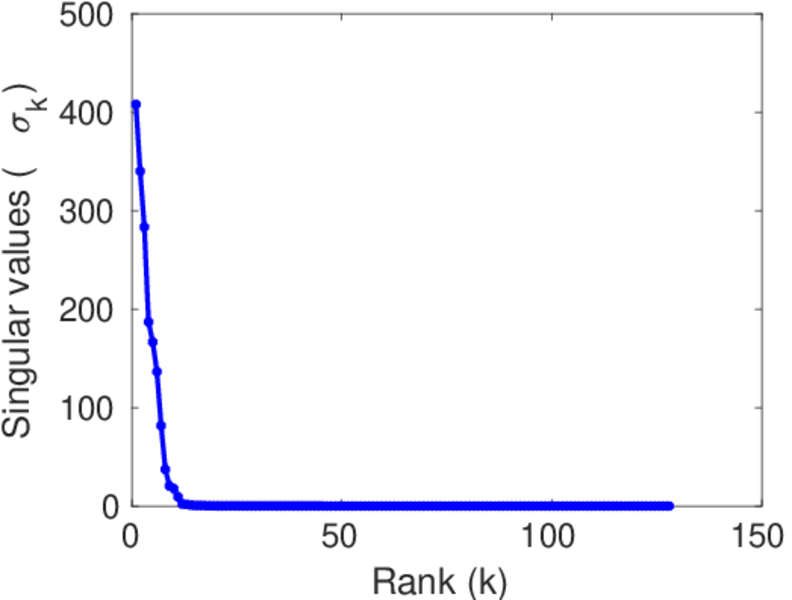
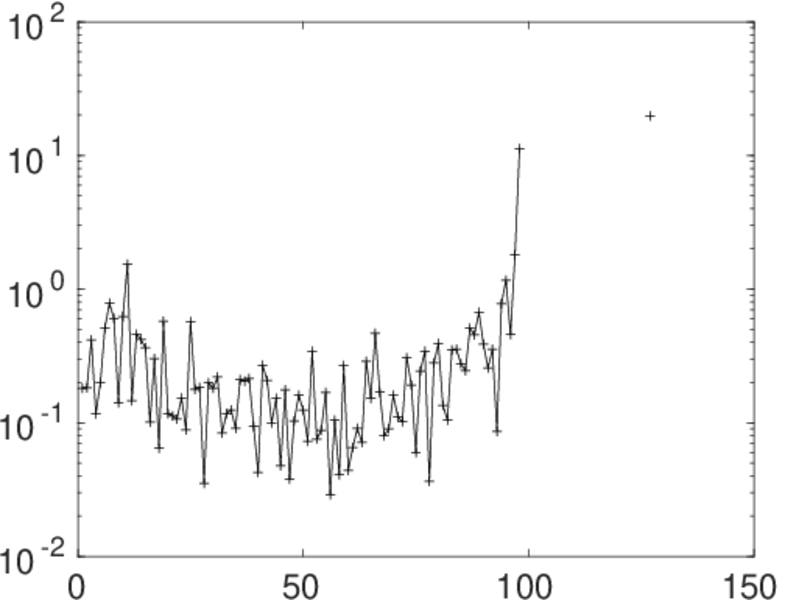
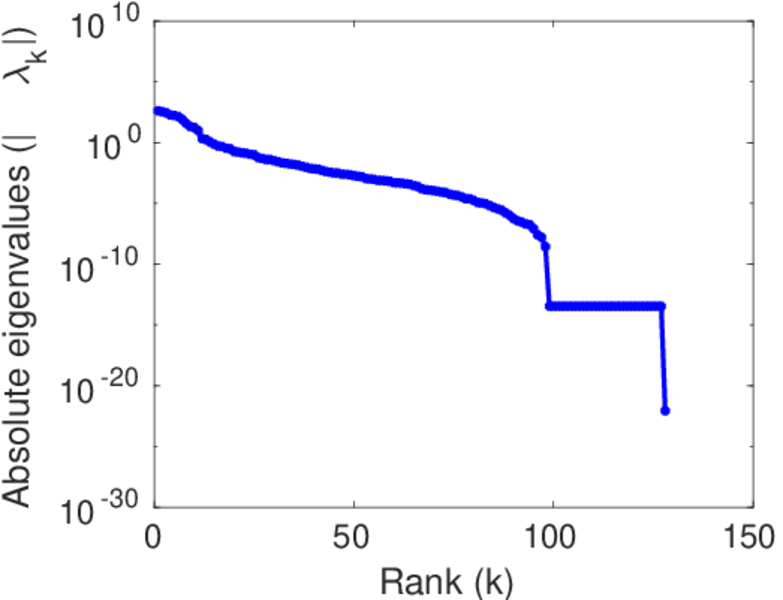
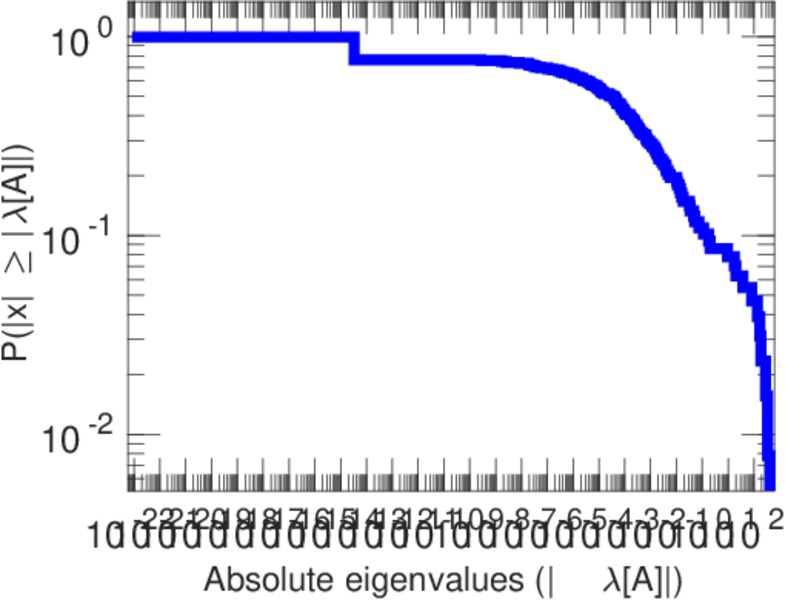
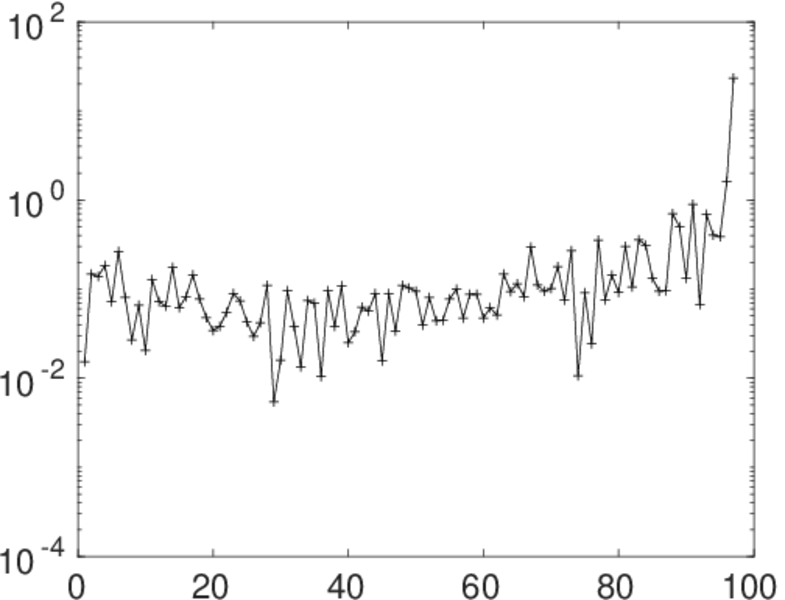
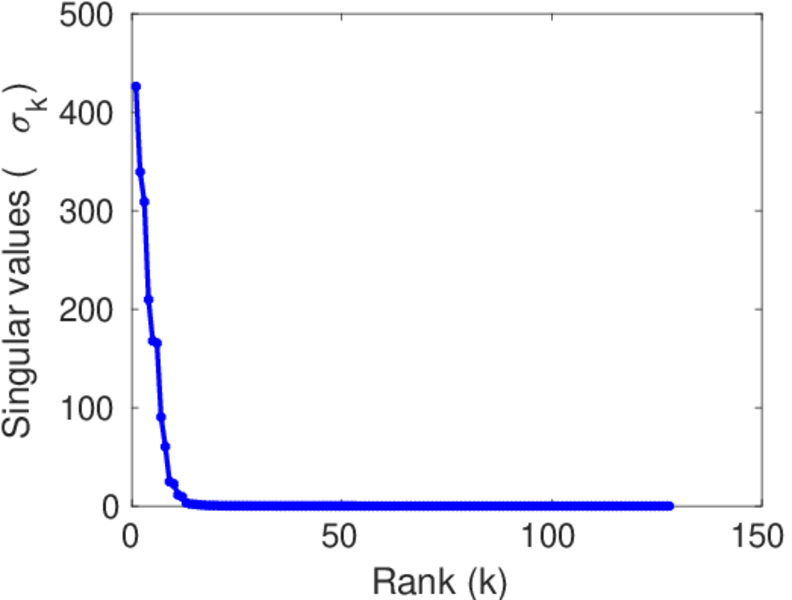
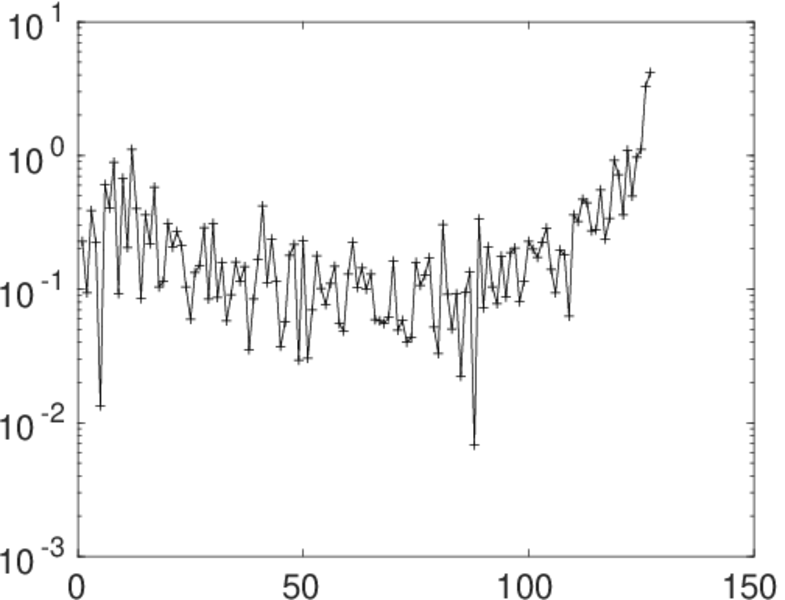
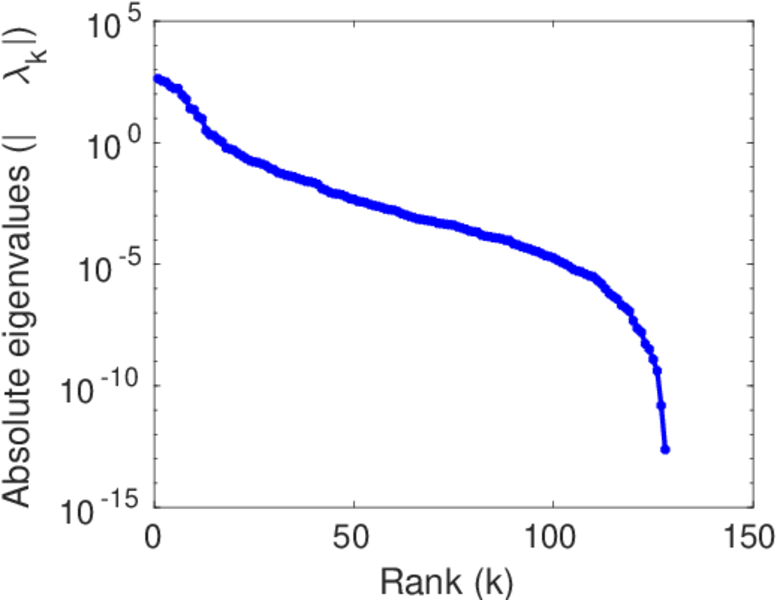
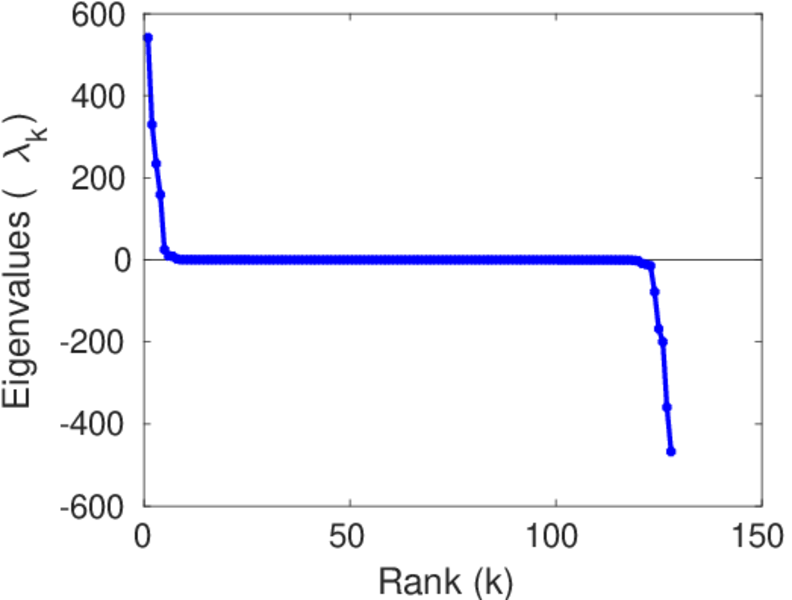
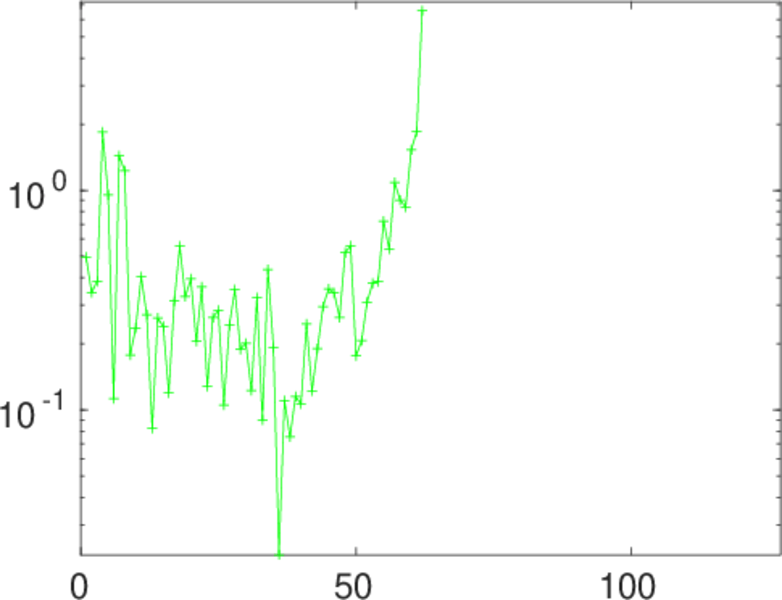
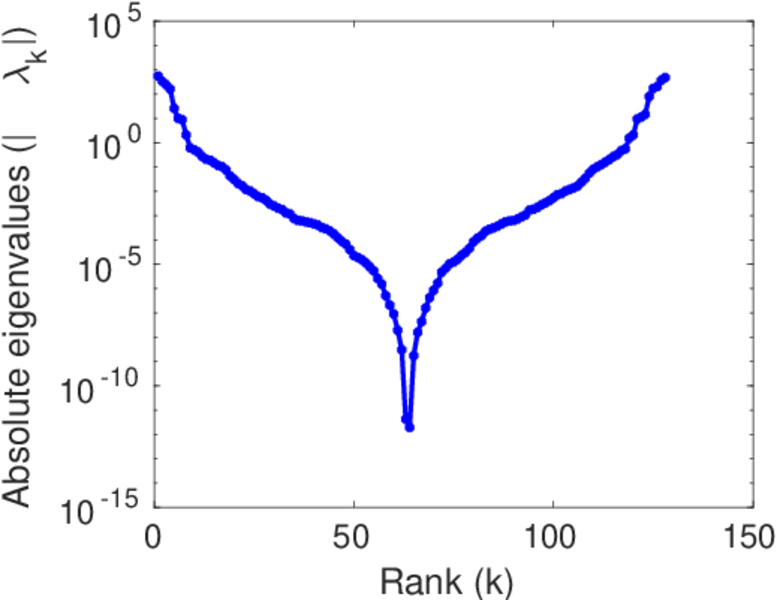
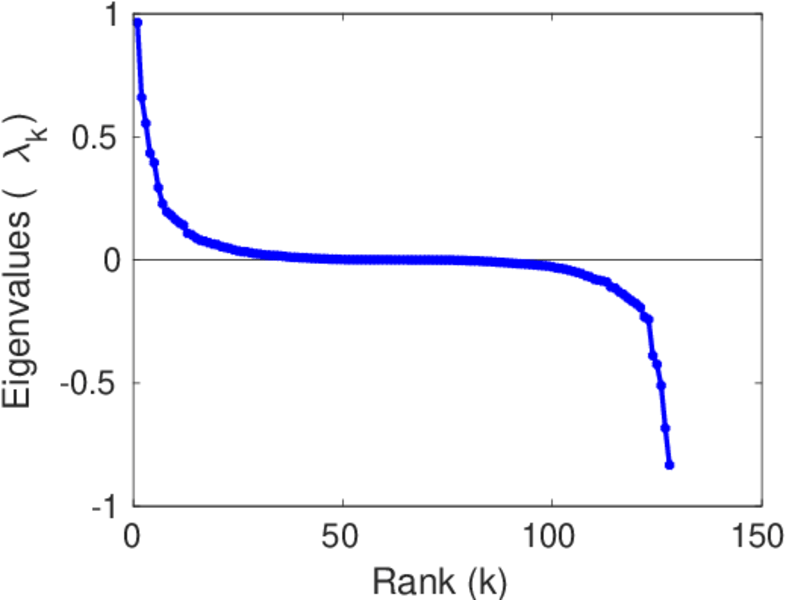
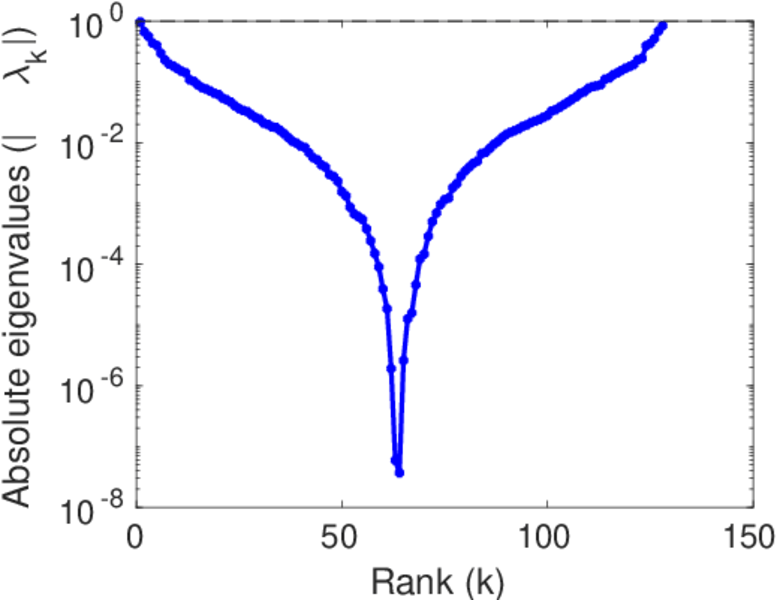
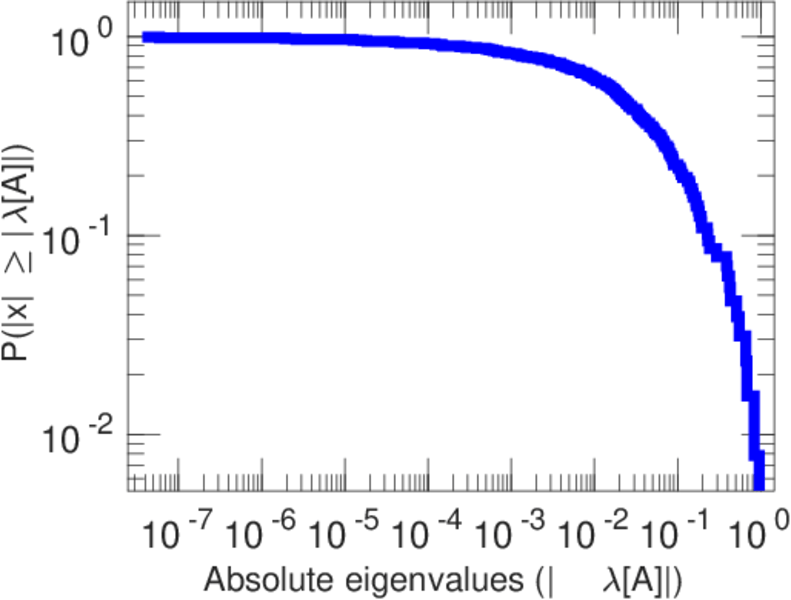
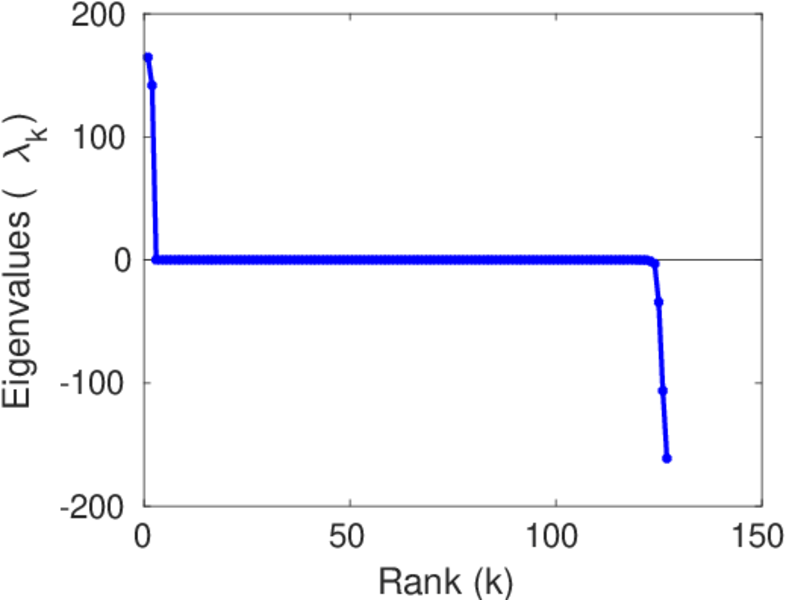
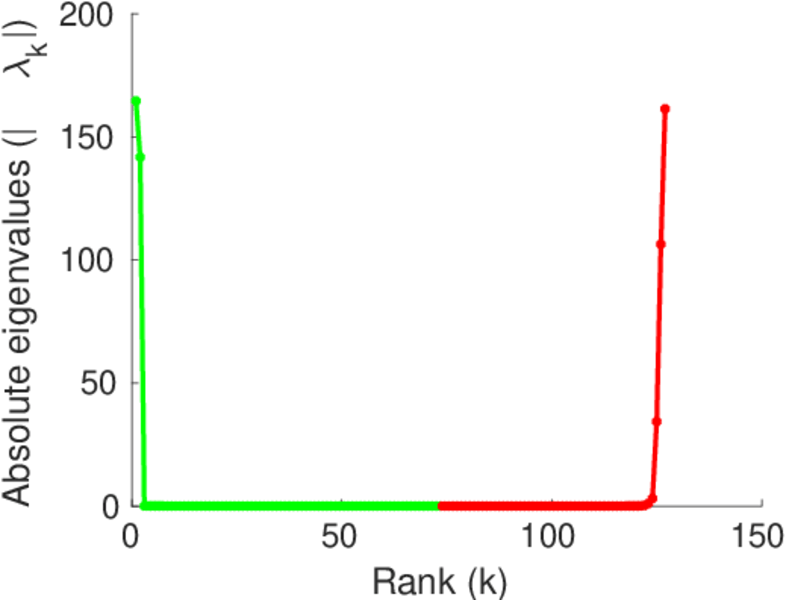
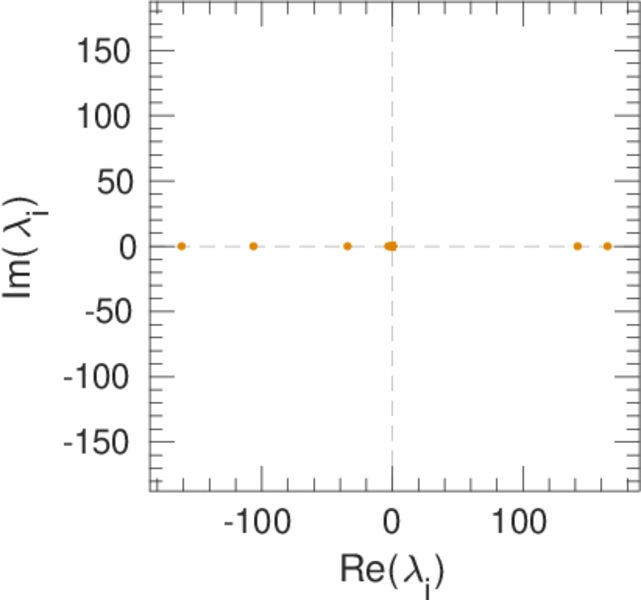
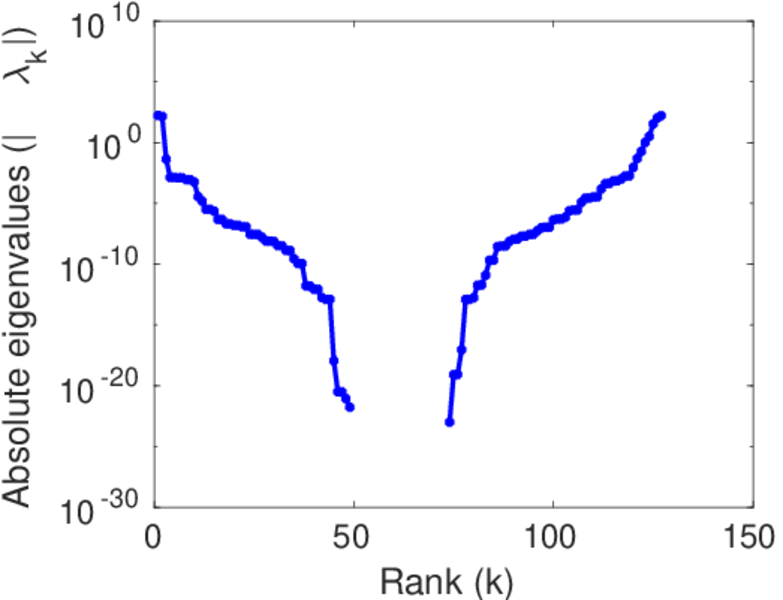
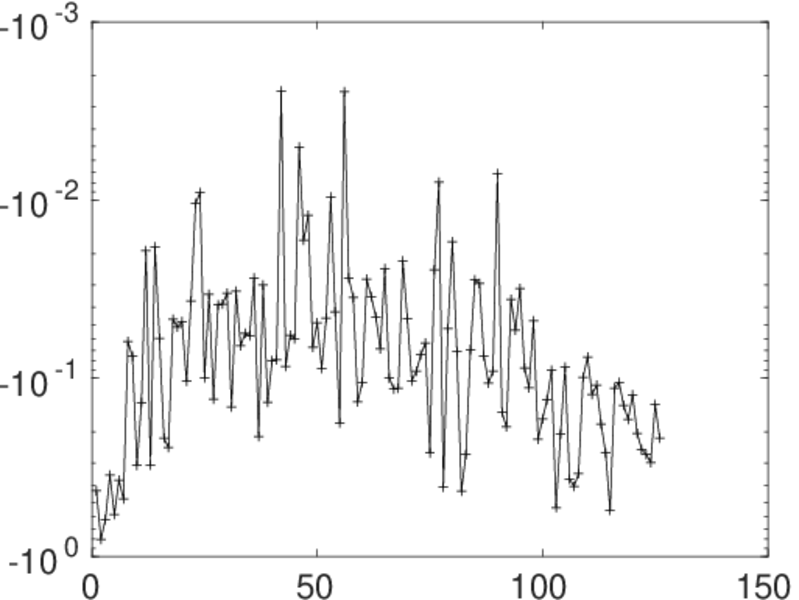
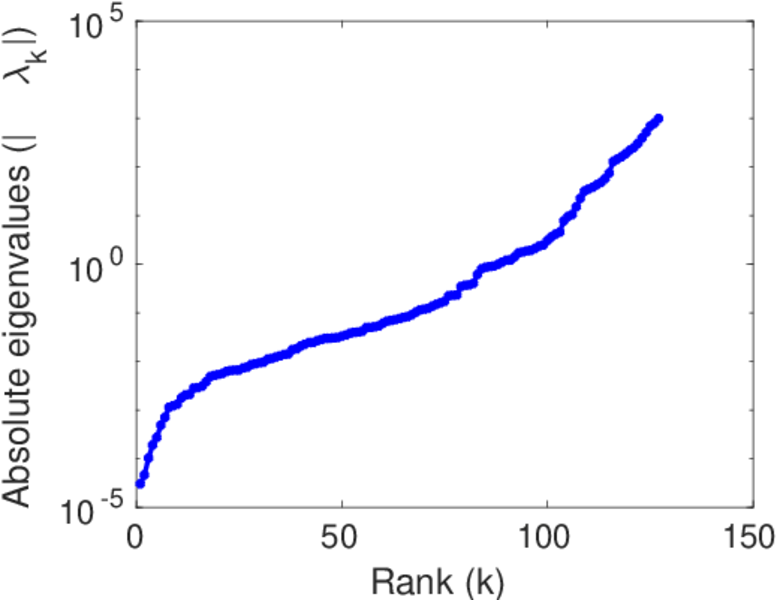
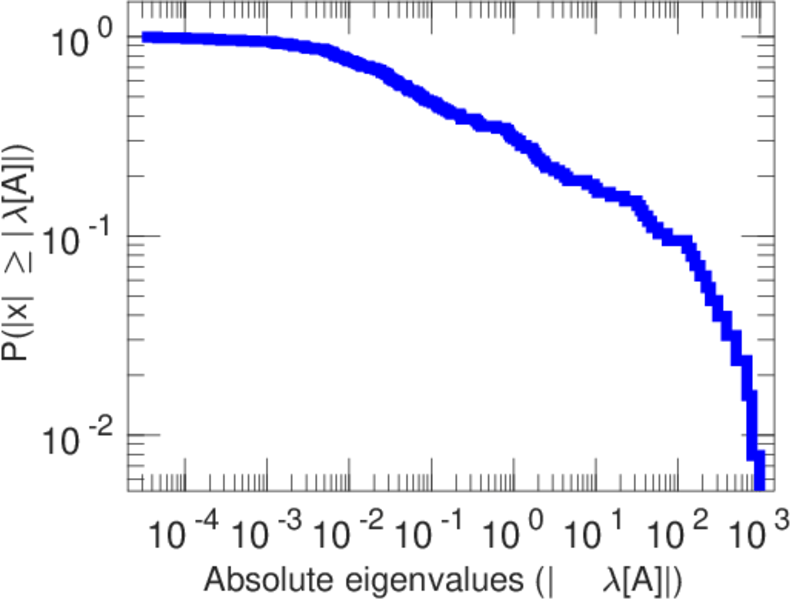
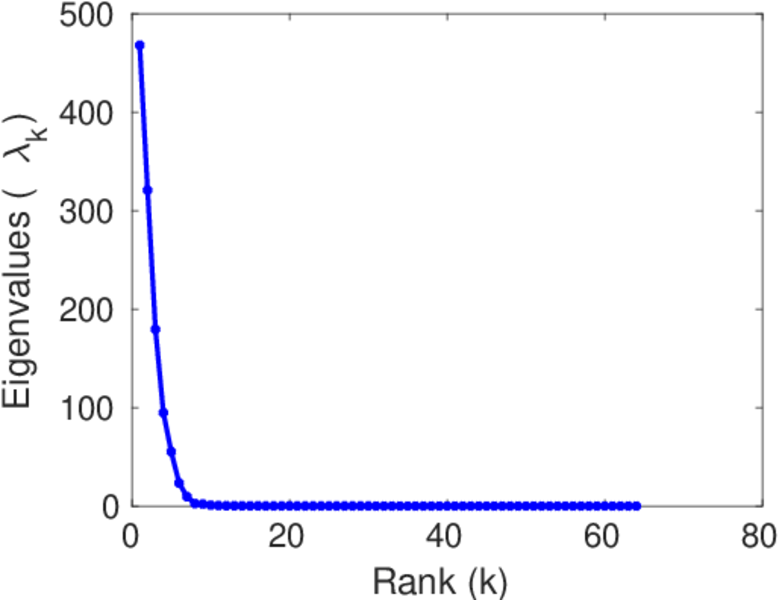
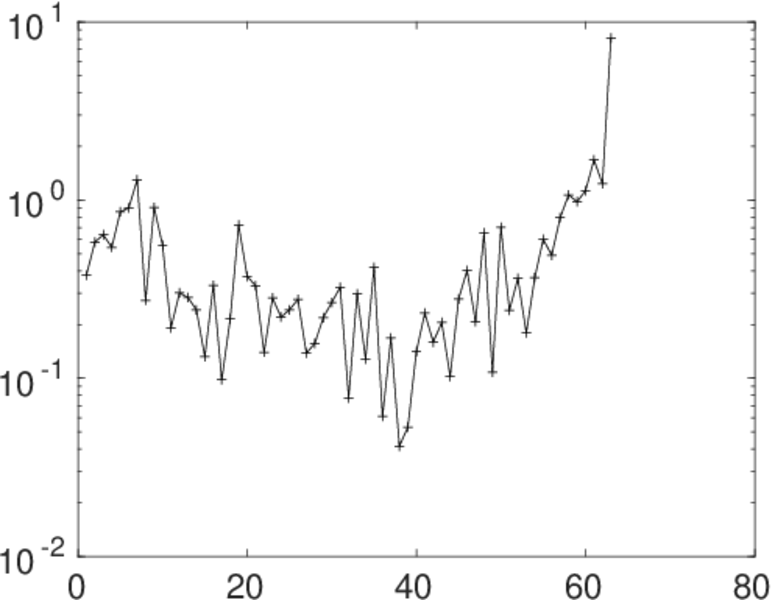
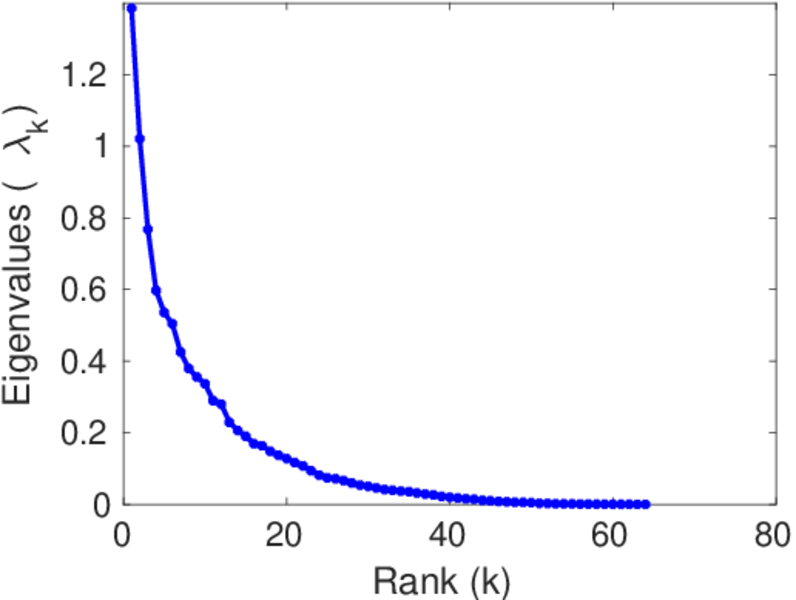
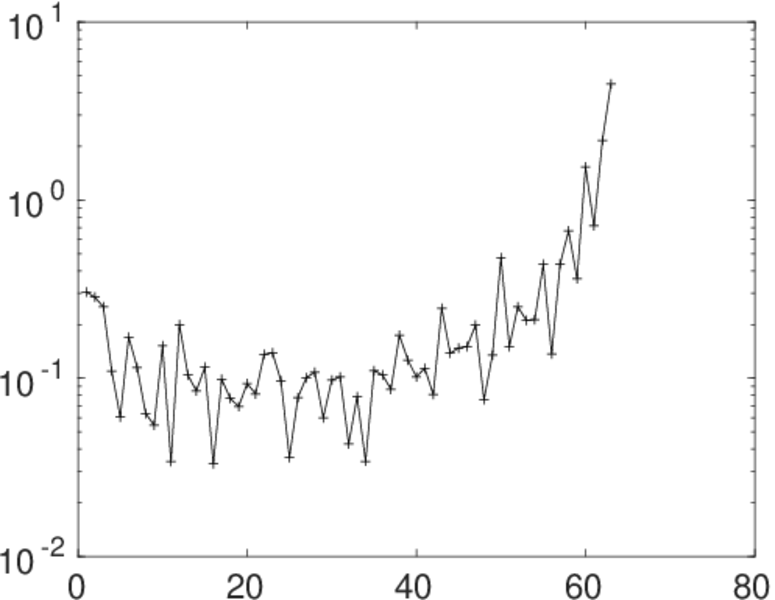
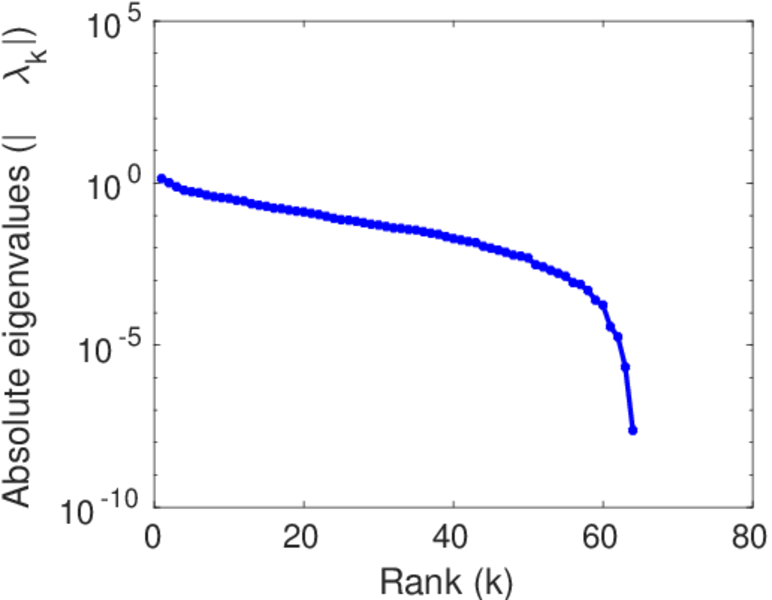
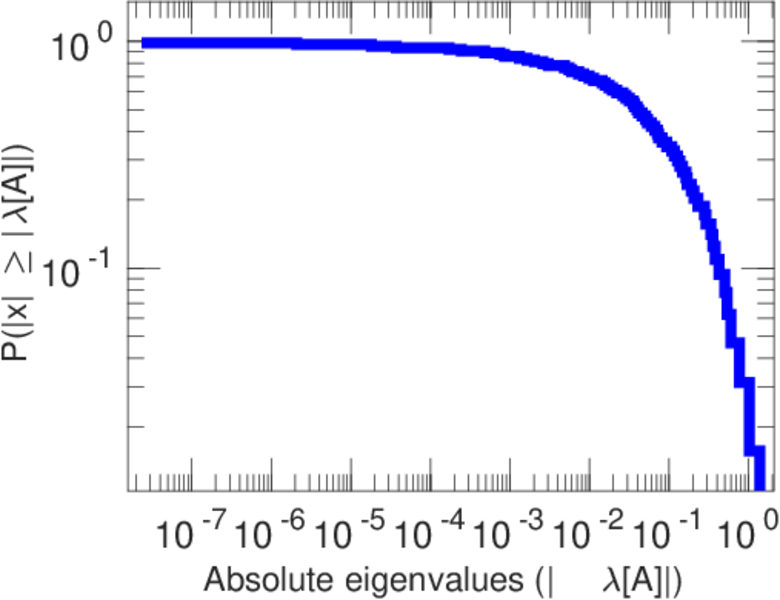
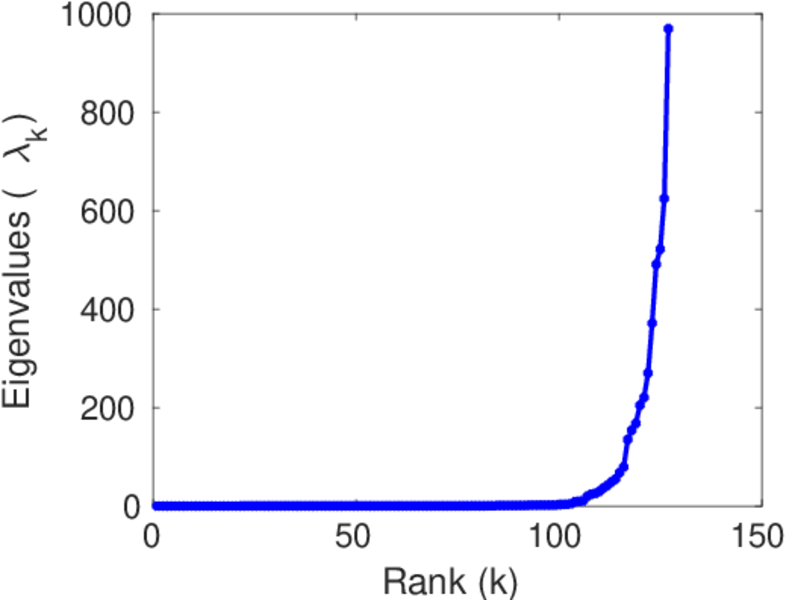
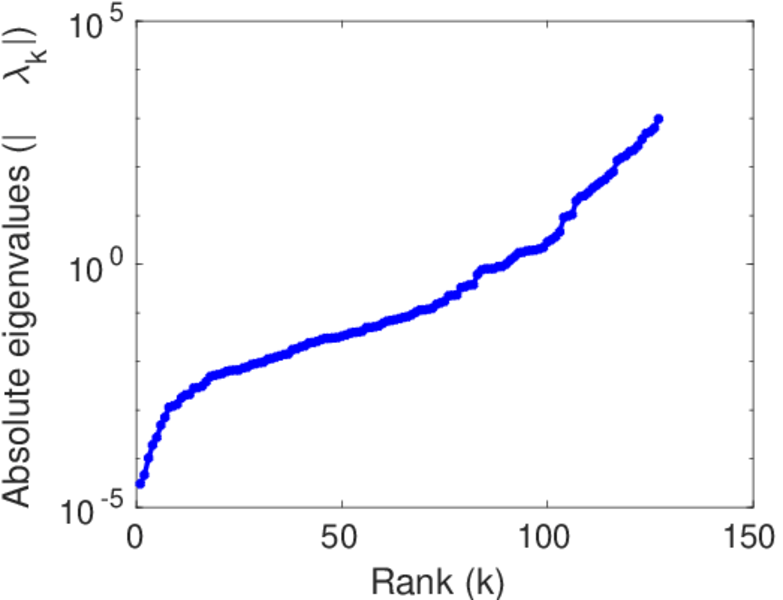
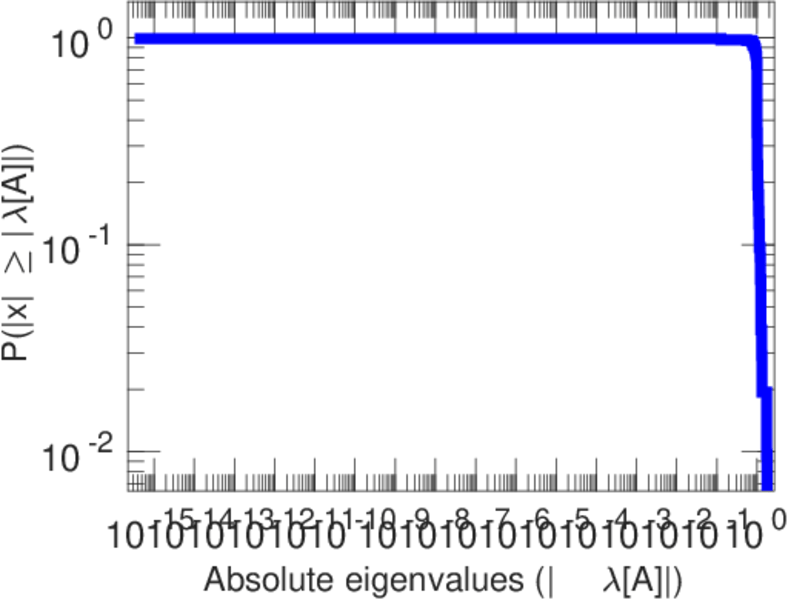
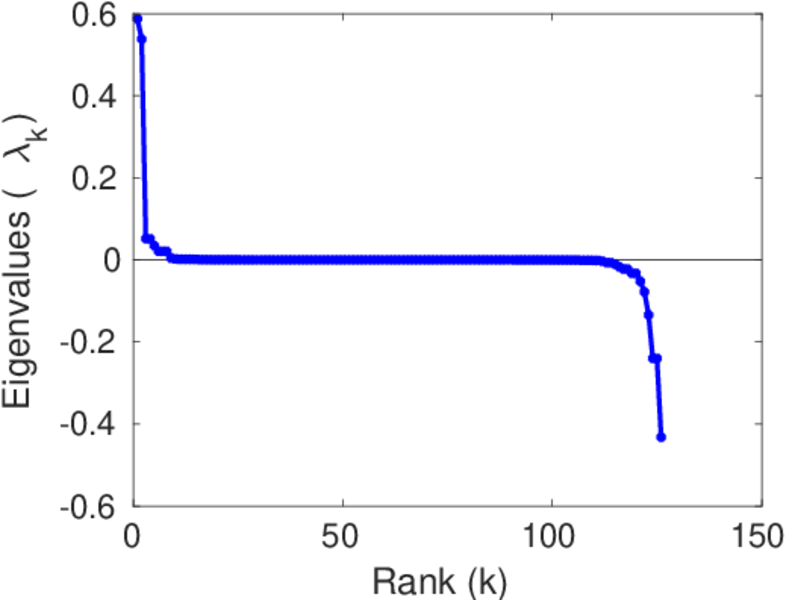
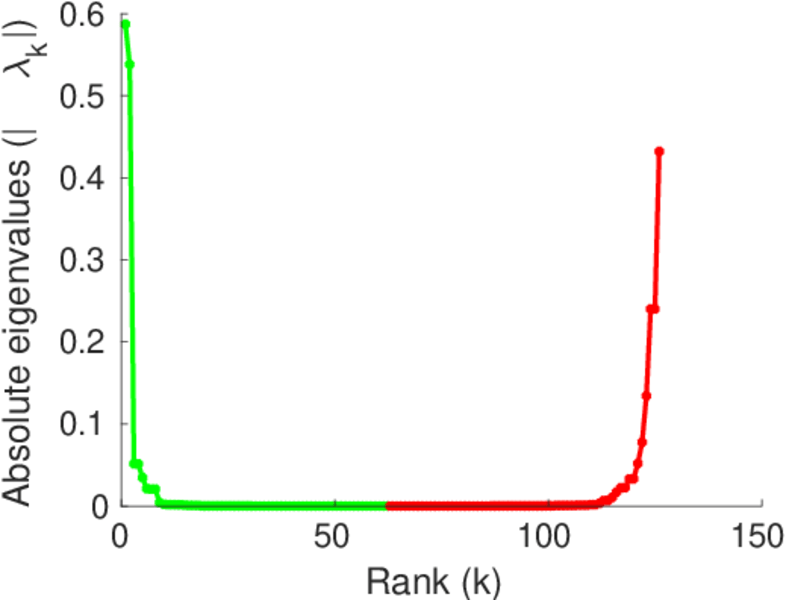
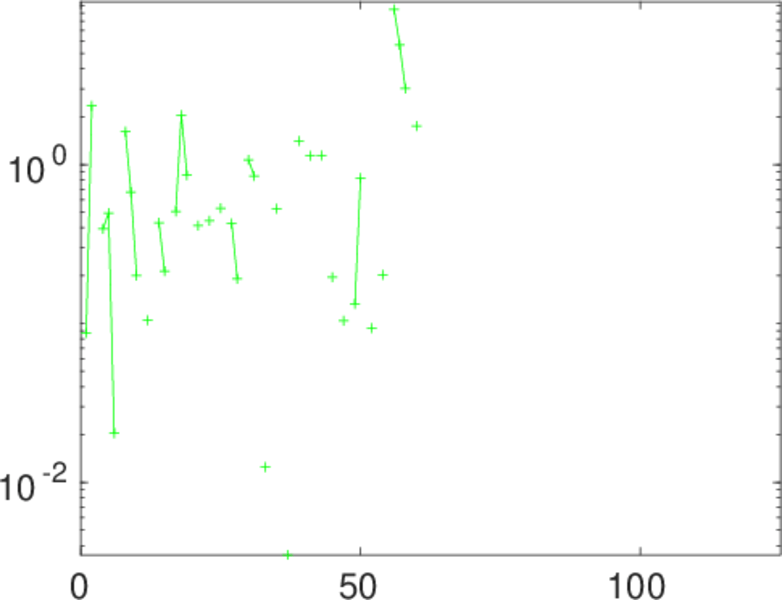
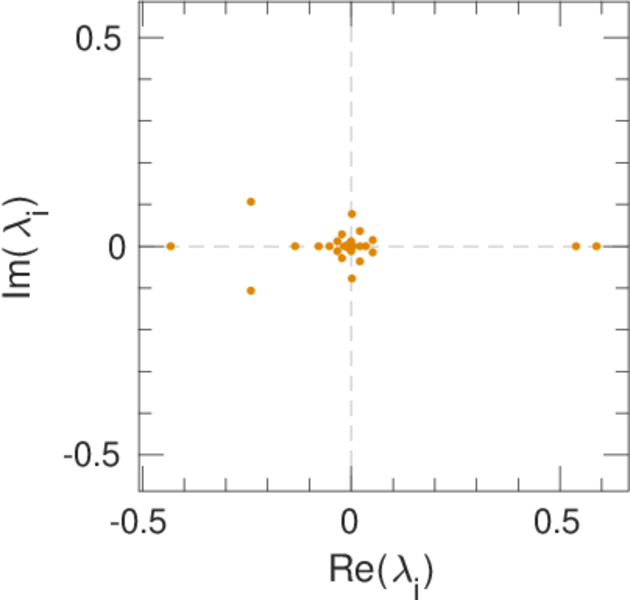
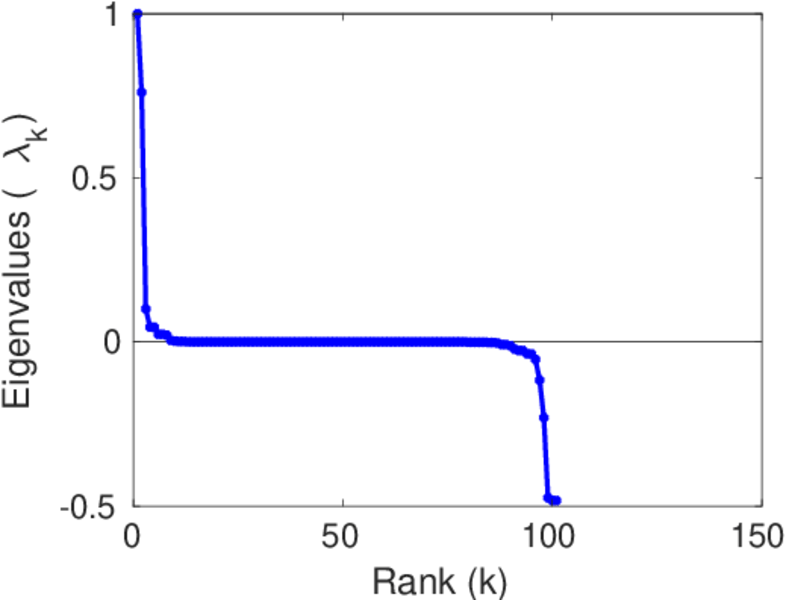
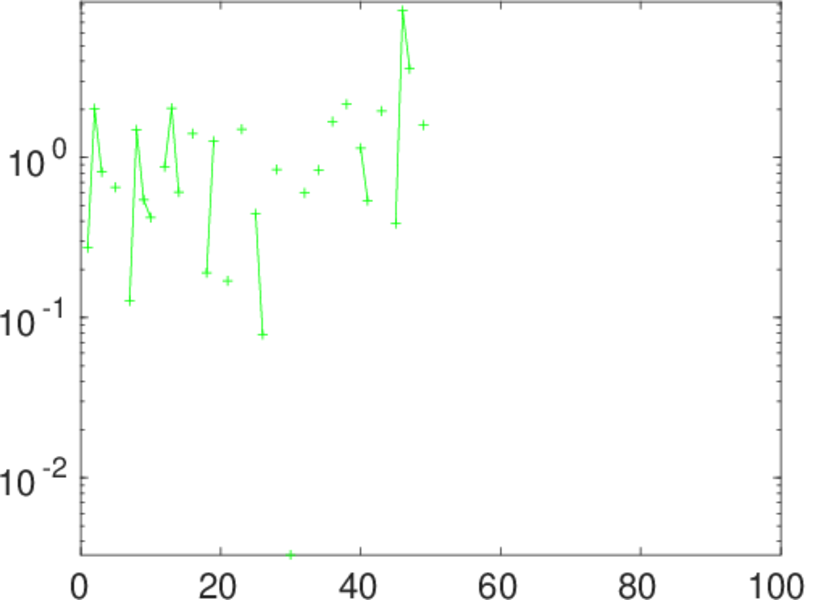
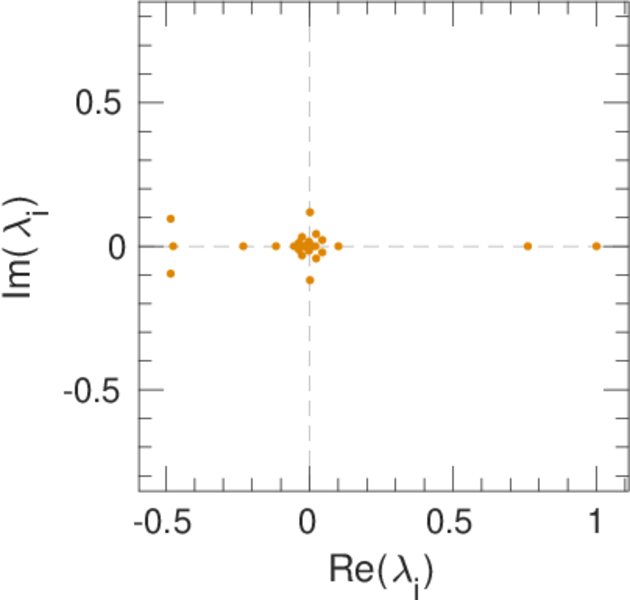
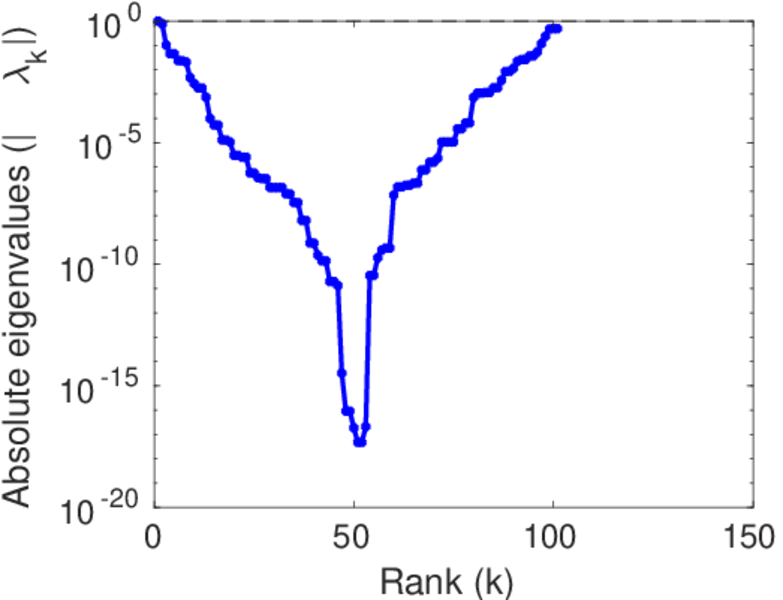
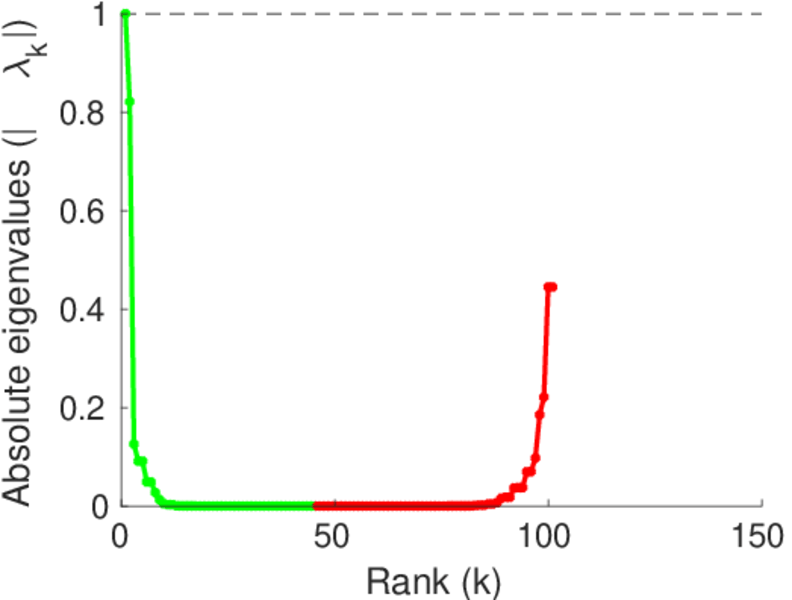
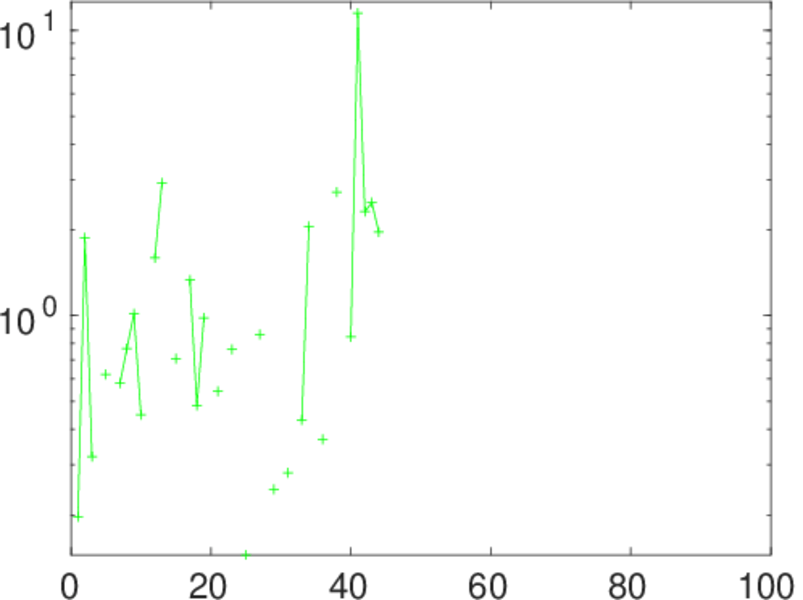
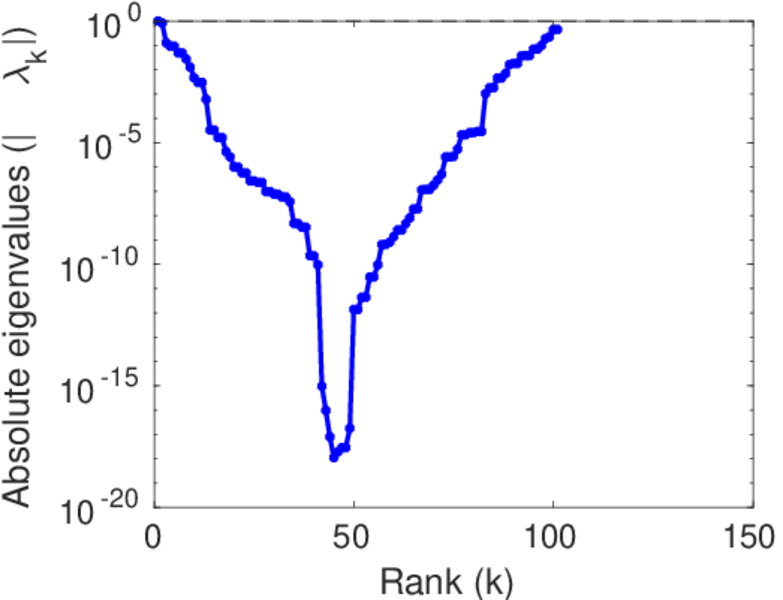
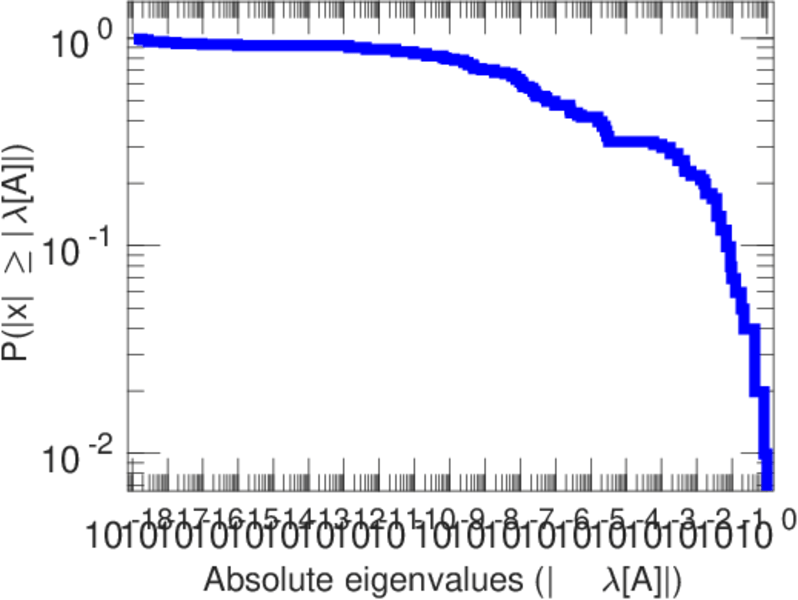
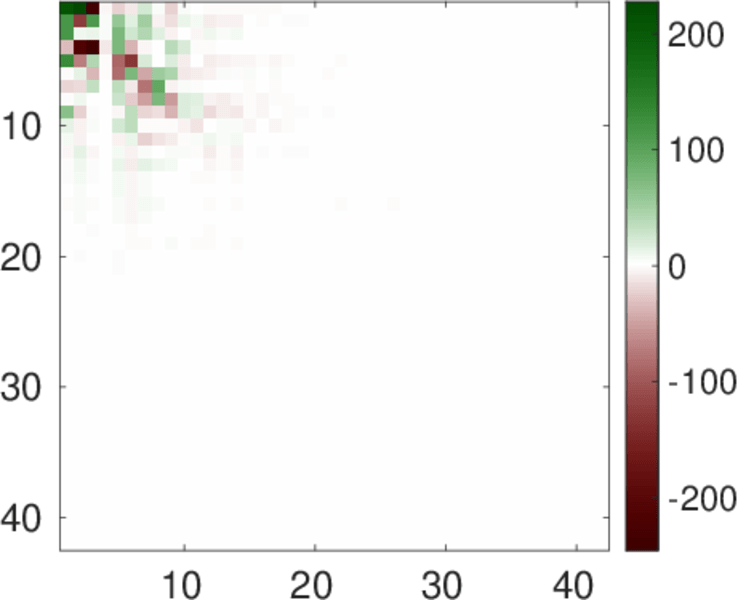
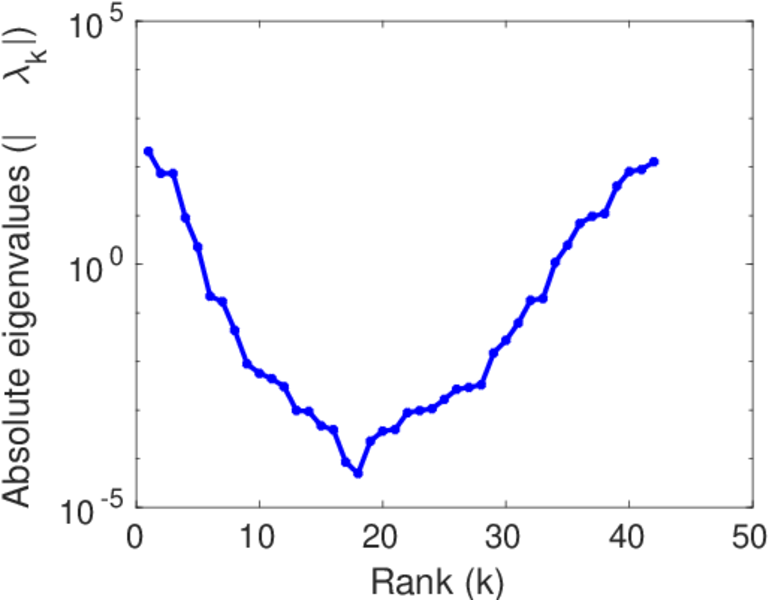
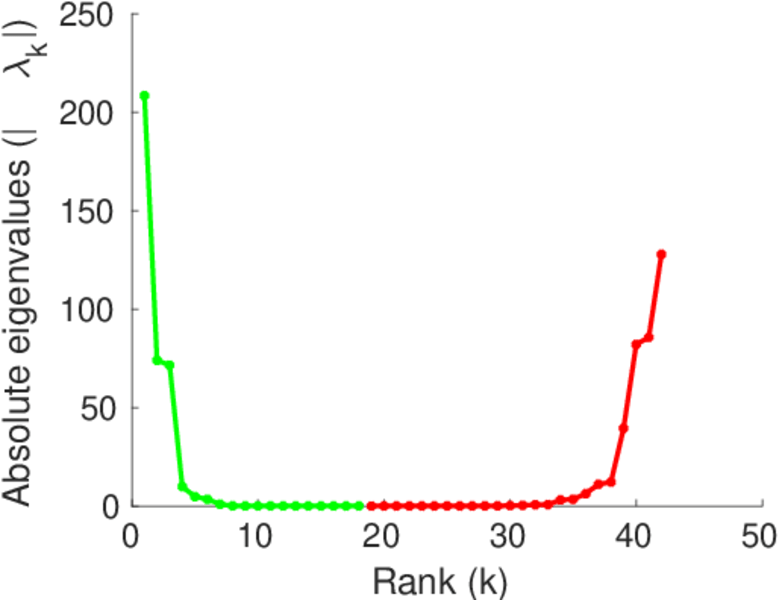
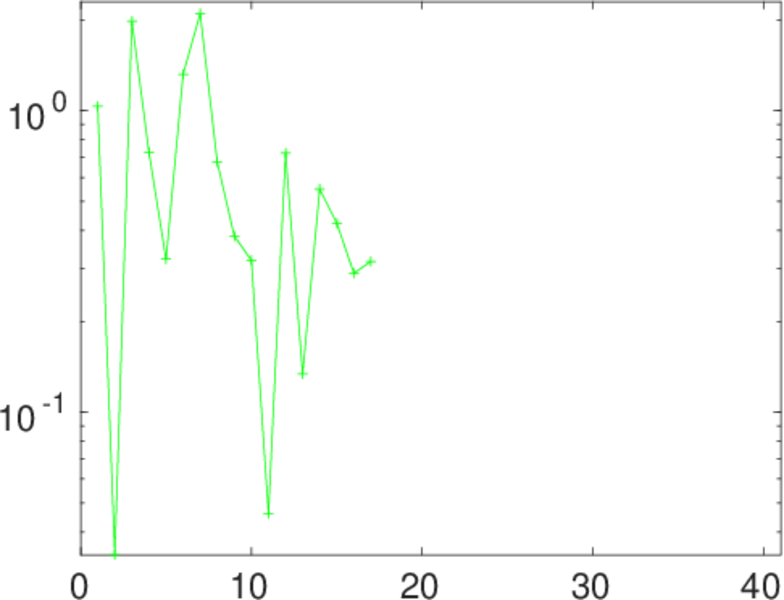
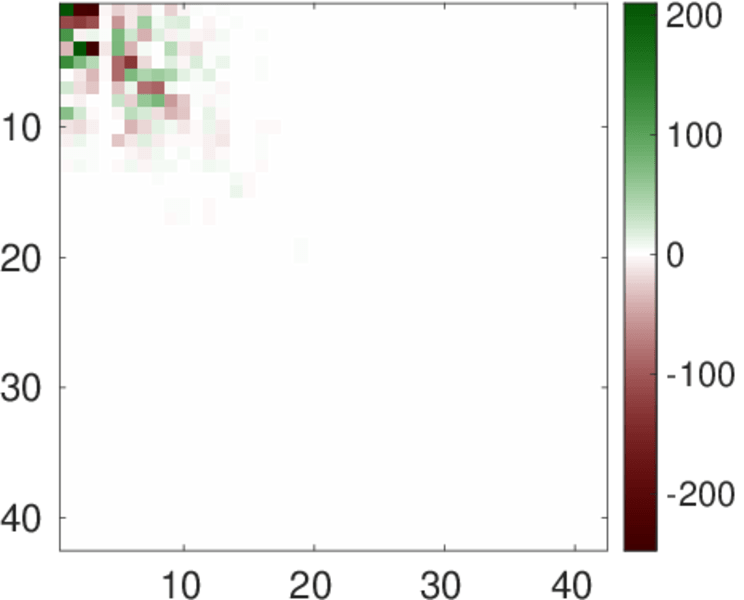
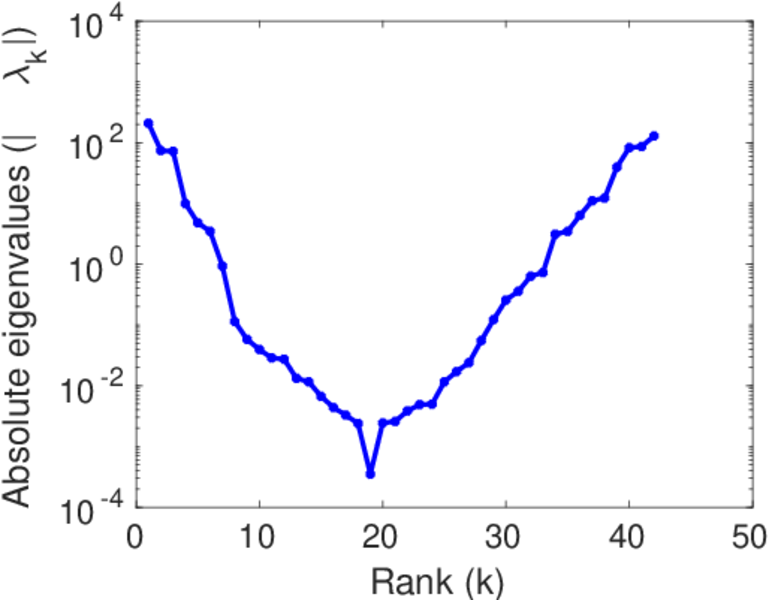
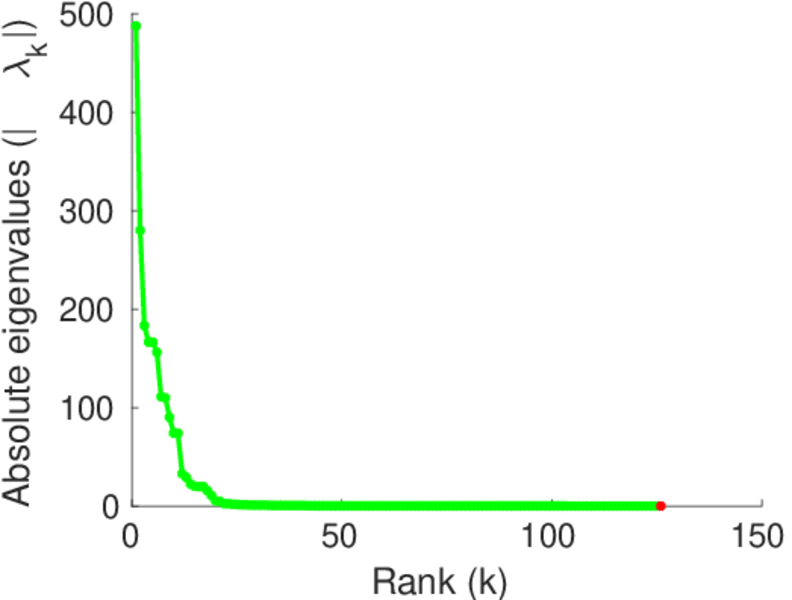
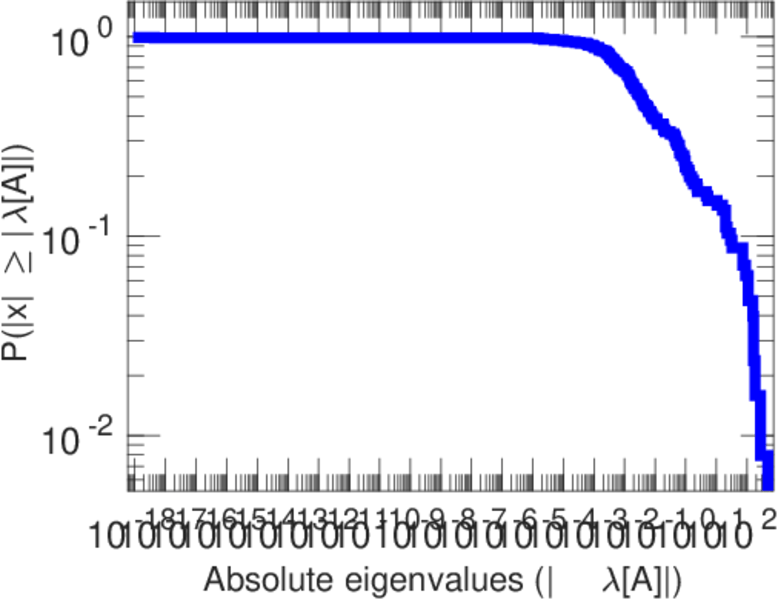
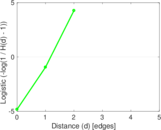
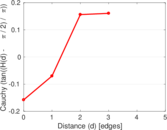
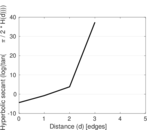
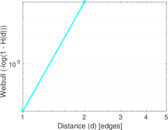
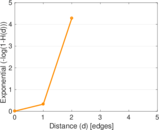
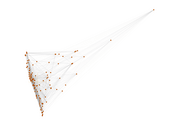
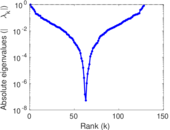
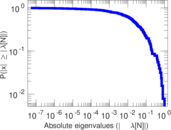
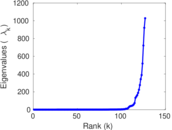
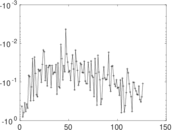
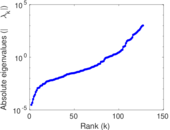
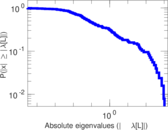
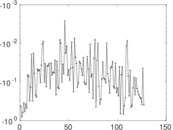
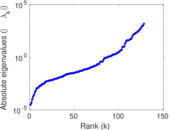
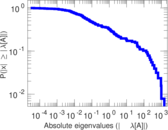
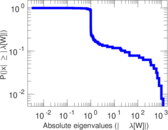
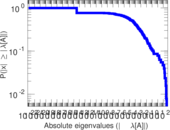
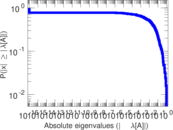
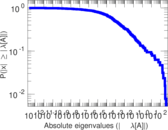
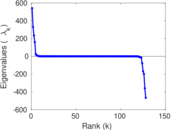
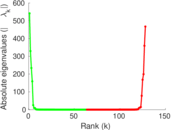
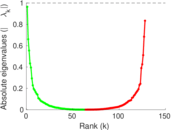
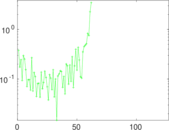
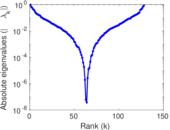
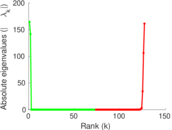
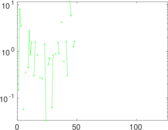
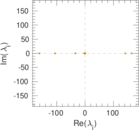
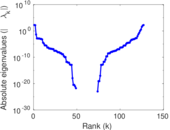
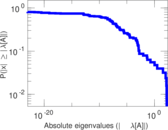
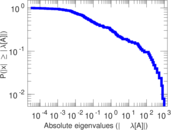
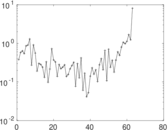
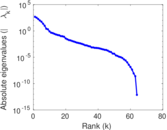
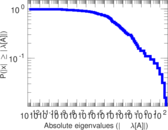
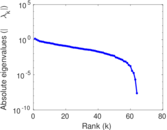
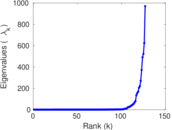
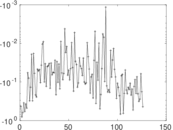
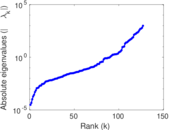
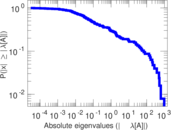
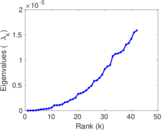
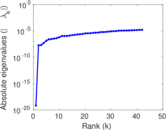
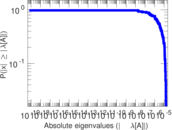
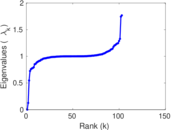
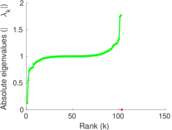
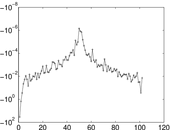
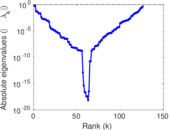
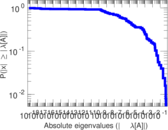
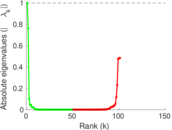
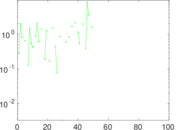
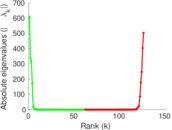
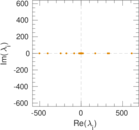
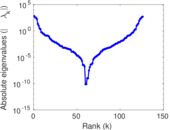
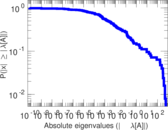
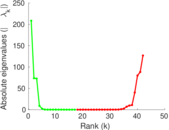
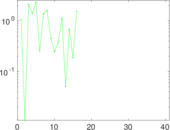
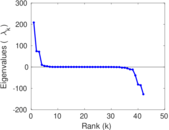
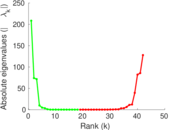
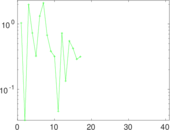
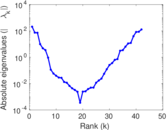
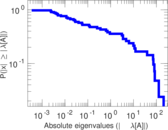
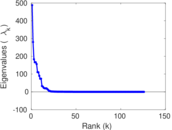
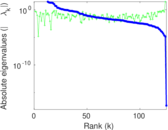
Plots


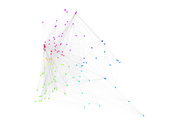
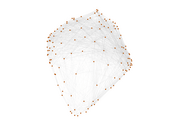


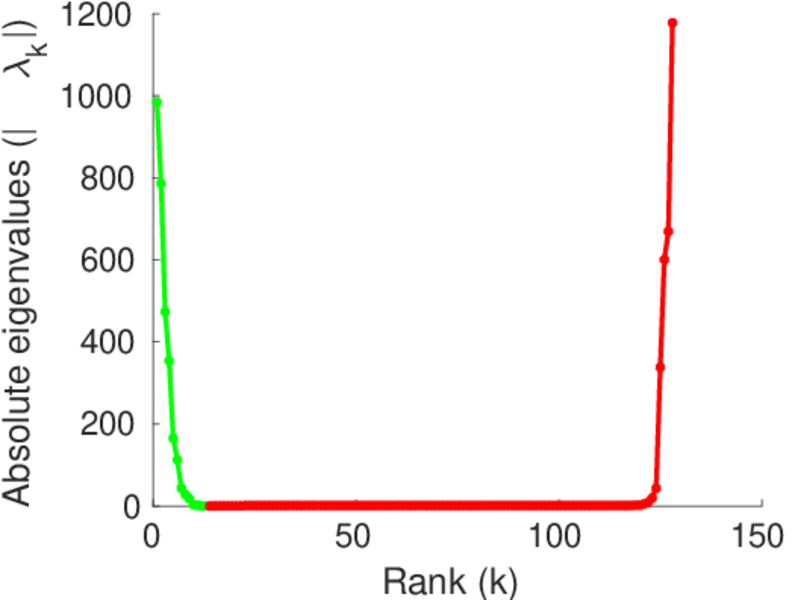
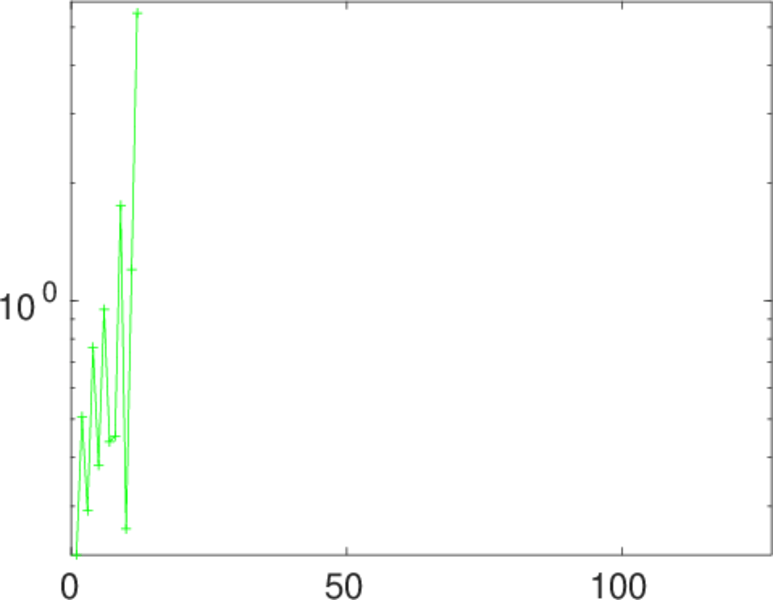
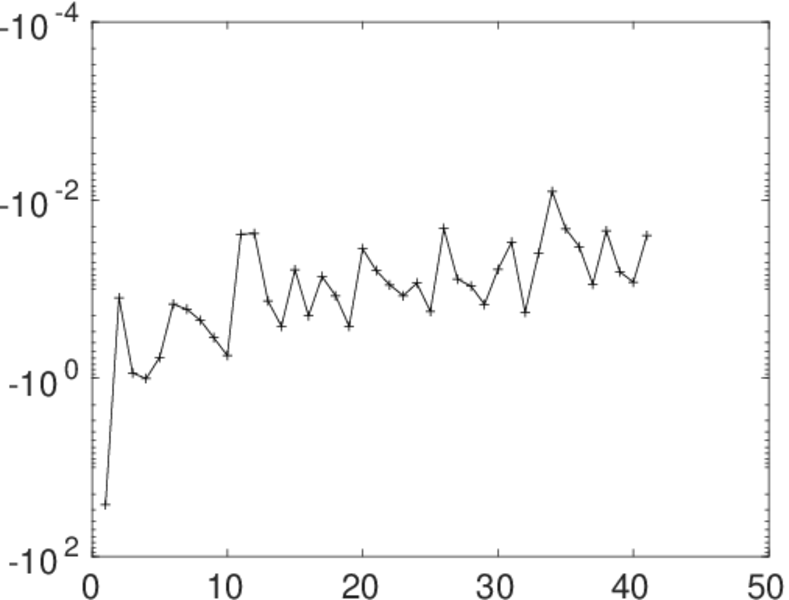
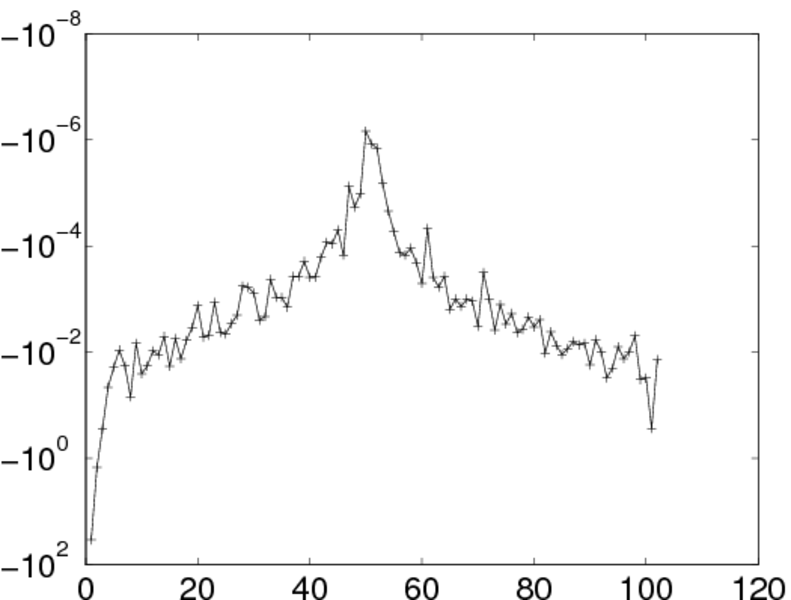
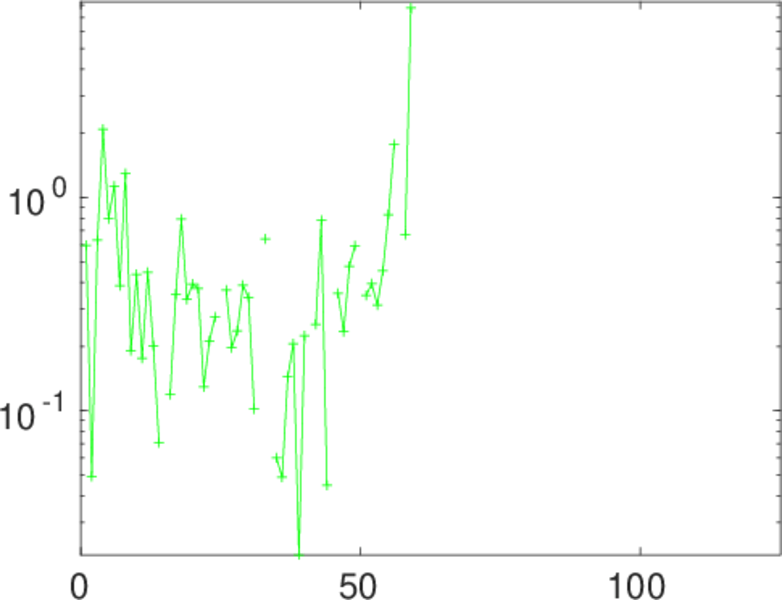
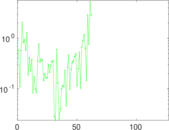
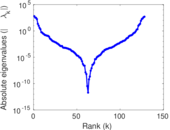
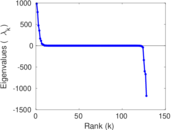
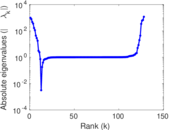
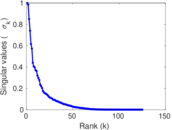
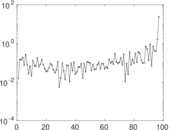
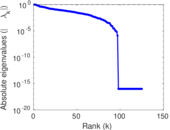
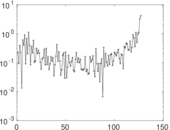
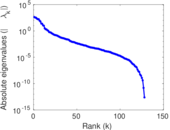
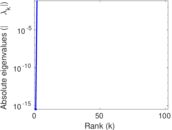
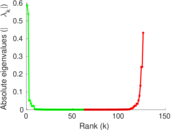
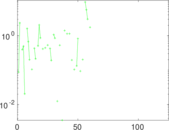
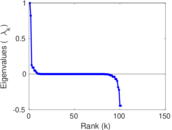
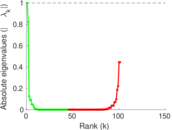
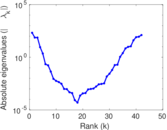
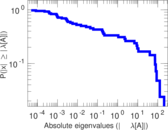
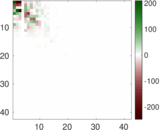
Matrix decompositions plots


Downloads
References
|
[1]
|
Jérôme Kunegis.
KONECT – The Koblenz Network Collection.
In Proc. Int. Conf. on World Wide Web Companion, pages
1343–1350, 2013.
[ http ]
|
|
[2]
|
Robert E. Ulanowicz, Johanna J. Heymans, and Michael S. Egnotovich.
Network analysis of trophic dynamics in South Florida ecosystems,
FY 99: The graminoid ecosystem.
Ann. Report to the United States Geological Service Biol.
Resources Division Ref. No.[UMCES] CBL 00-0176, Chesapeake Biological
Laboratory, Univ. of Maryland, 2000.
|
 KONECT ‣ Networks ‣
Buy Me a Coffee
KONECT ‣ Networks ‣
Buy Me a Coffee