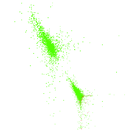
Wikipedia words (en)
This is the bipartite network of excellent articles in the English Wikipedia,
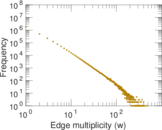
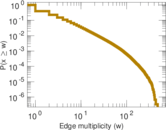
and the words they contain. The edge multiplicities represent the word count
for each article–word pair.
Metadata
Statistics
| Size | n = | 276,739
|
| Left size | n1 = | 2,780
|
| Right size | n2 = | 273,959
|
| Volume | m = | 7,846,807
|
| Unique edge count | m̿ = | 2,941,902
|
| Wedge count | s = | 2,707,057,869
|
| Claw count | z = | 1,273,176,127,252
|
| Square count | q = | 113,573,615,622
|
| 4-Tour count | T4 = | 919,423,043,352
|
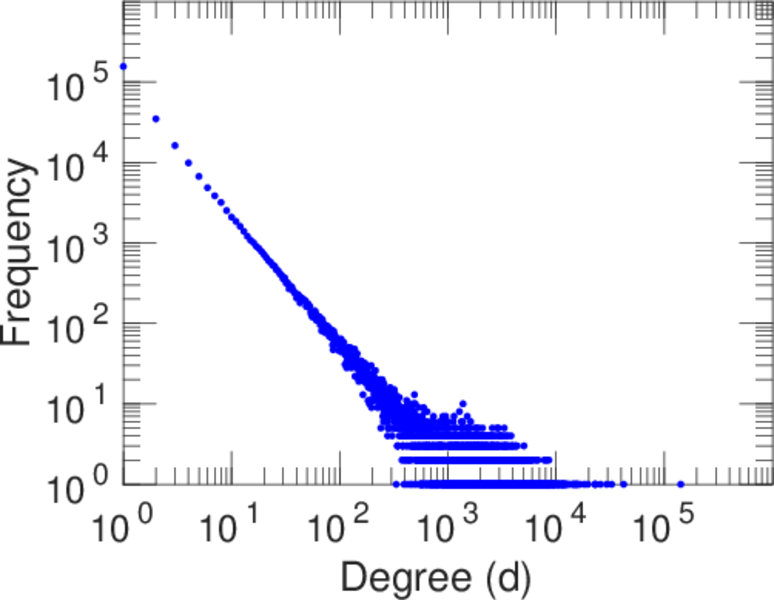
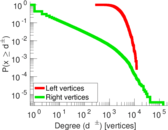
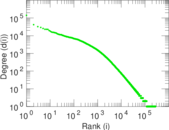
| Maximum degree | dmax = | 3,410
|
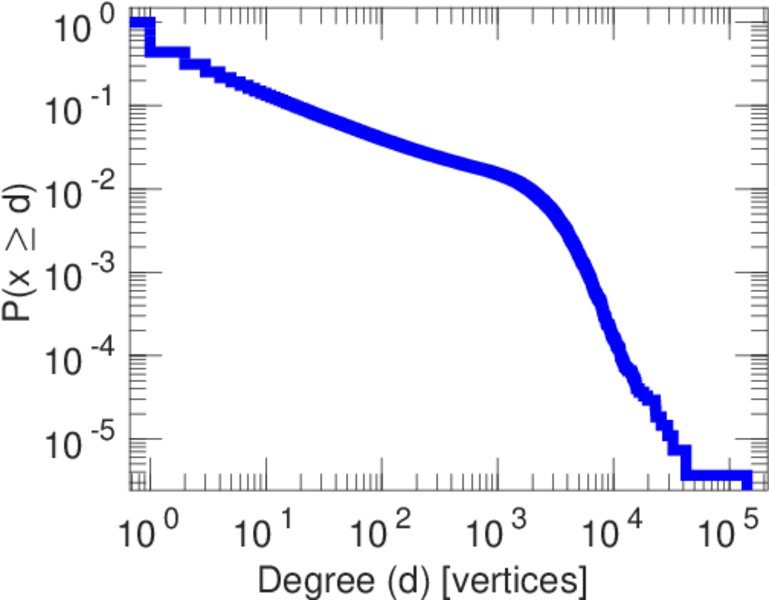
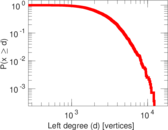
| Maximum left degree | d1max = | 3,410
|
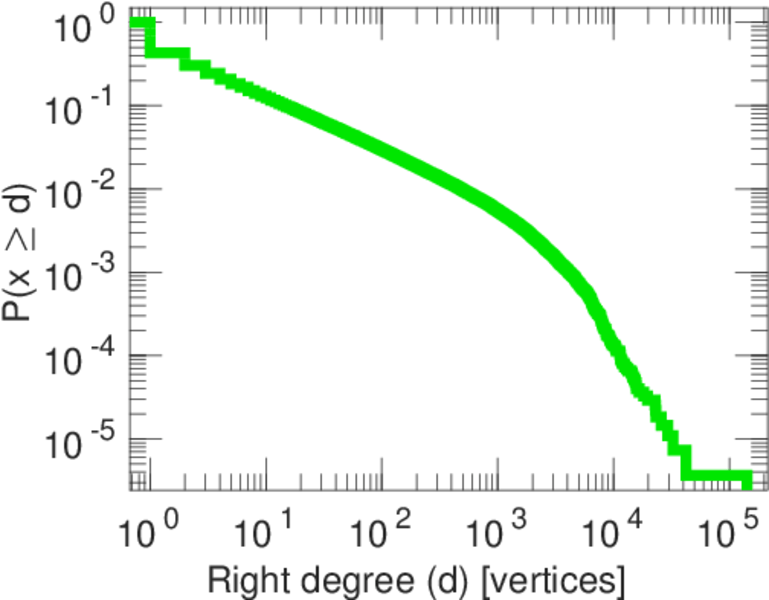
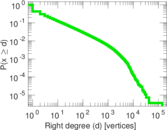
| Maximum right degree | d2max = | 2,780
|
| Average degree | d = | 56.709 1
|
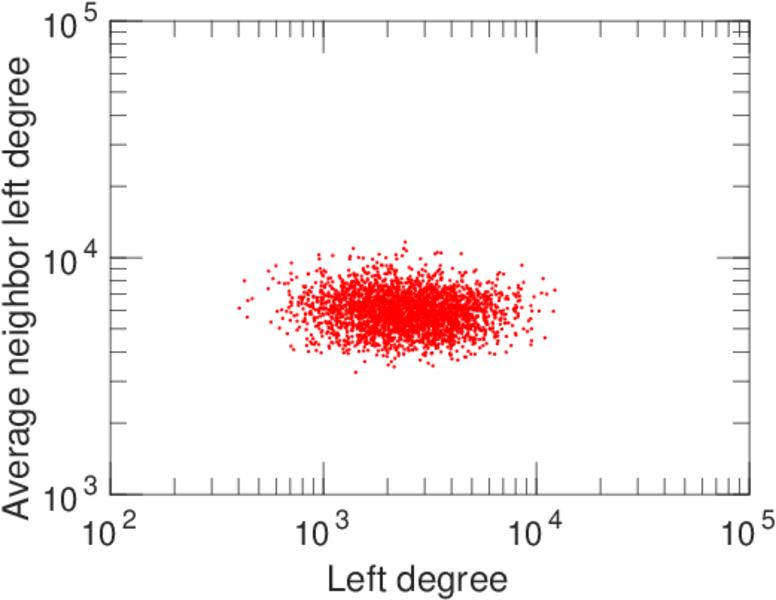
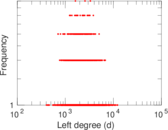
| Average left degree | d1 = | 2,822.59
|
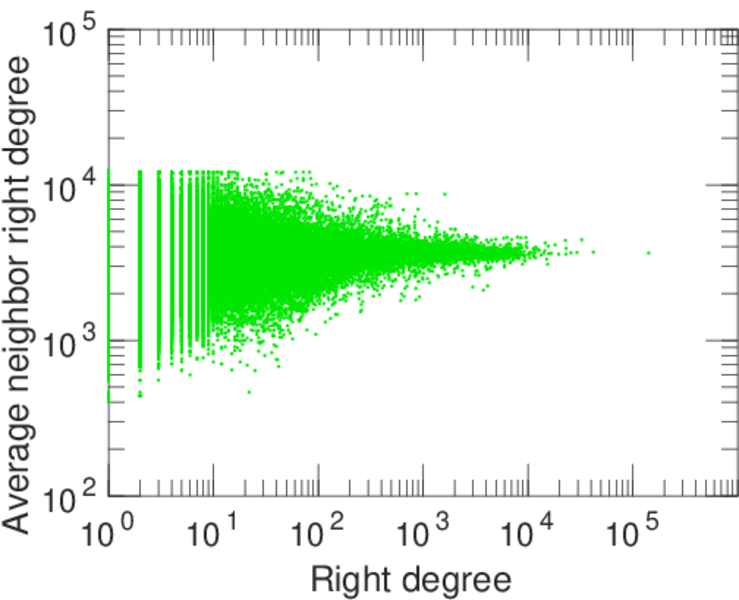
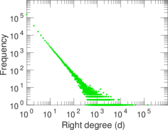
| Average right degree | d2 = | 28.642 3
|
| Fill | p = | 0.003 862 76
|
| Average edge multiplicity | m̃ = | 2.667 26
|
| Size of LCC | N = | 276,739
|
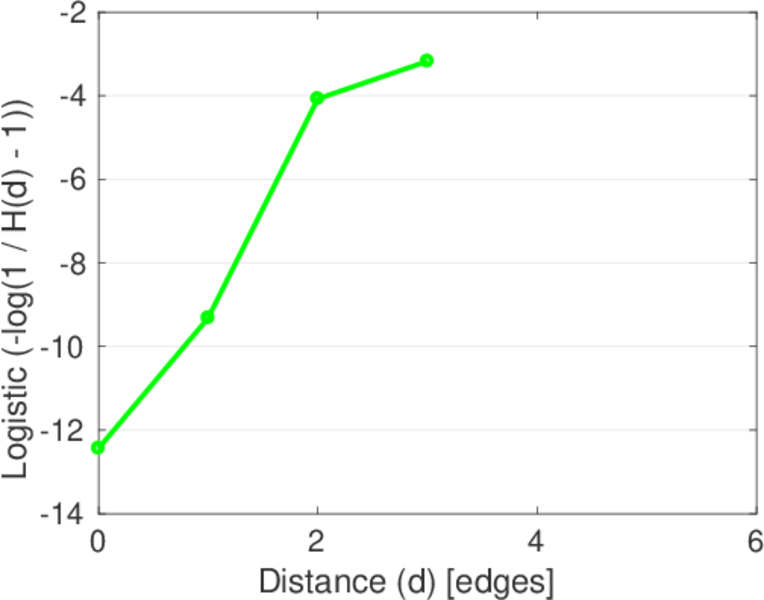
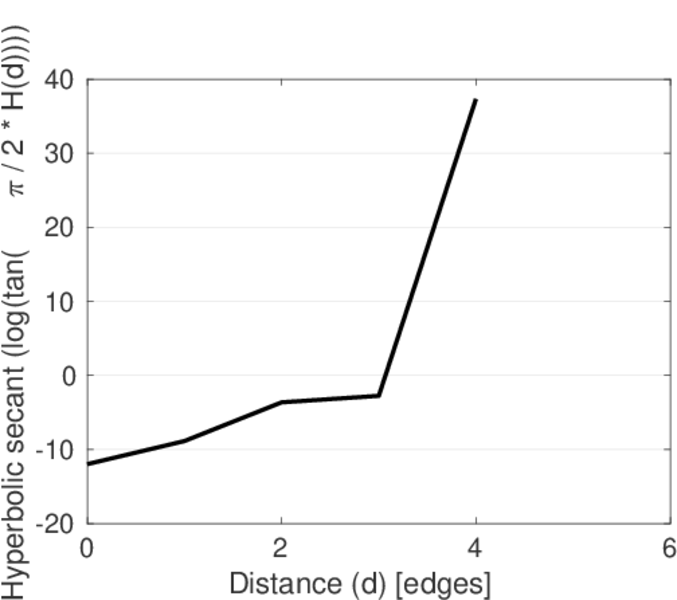
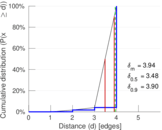
| Diameter | δ = | 4
|
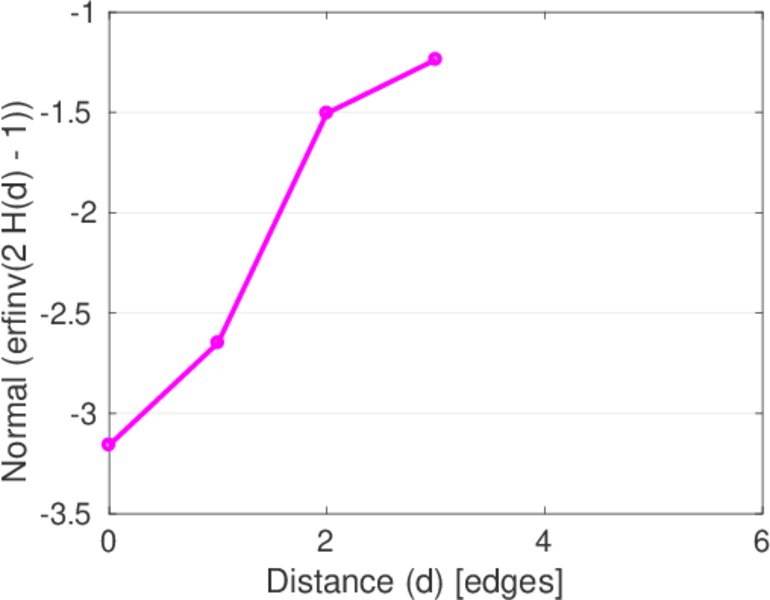
| 50-Percentile effective diameter | δ0.5 = | 3.479 11
|
| 90-Percentile effective diameter | δ0.9 = | 3.895 82
|
| Median distance | δM = | 4
|
| Mean distance | δm = | 3.943 10
|
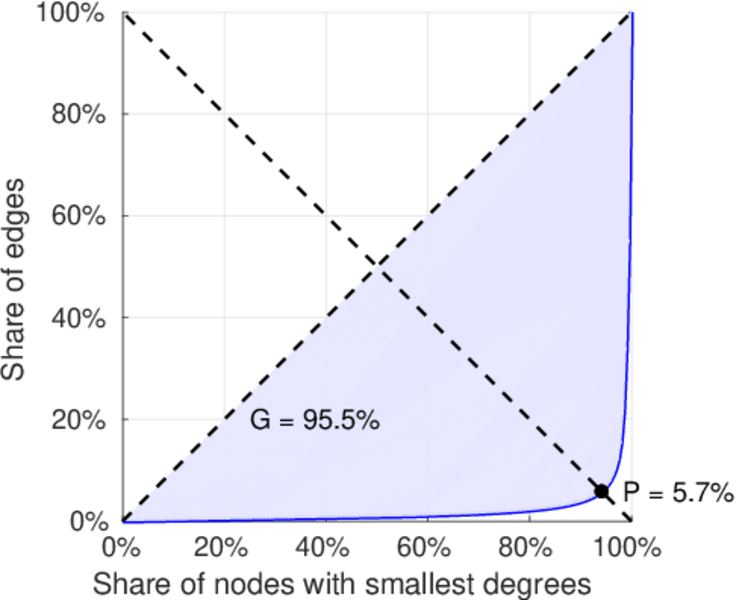
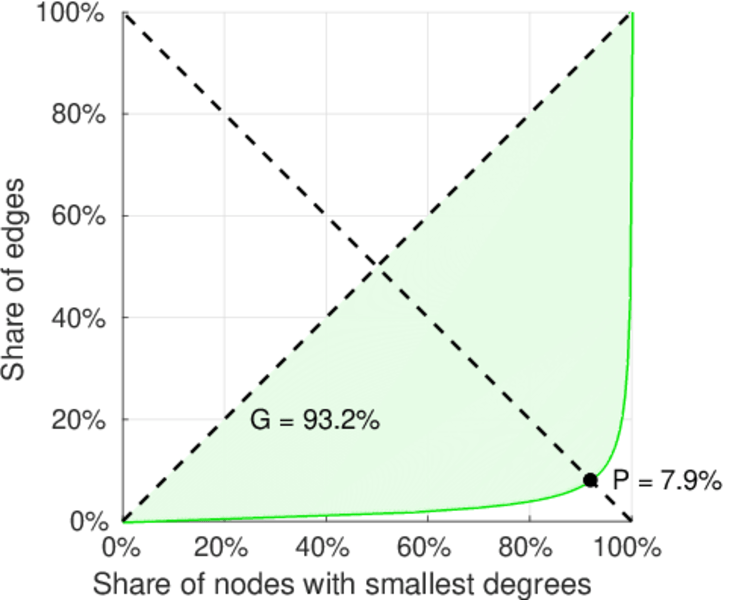
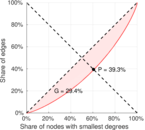
| Gini coefficient | G = | 0.955 005
|
| Balanced inequality ratio | P = | 0.057 292 0
|
| Left balanced inequality ratio | P1 = | 0.392 762
|
| Right balanced inequality ratio | P2 = | 0.079 323 3
|
| Relative edge distribution entropy | Her = | 0.757 306
|
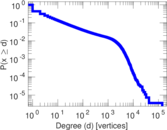
| Power law exponent | γ = | 2.611 96
|
| Tail power law exponent | γt = | 1.591 00
|
| Degree assortativity | ρ = | −0.114 424
|
| Degree assortativity p-value | pρ = | 0.000 00
|
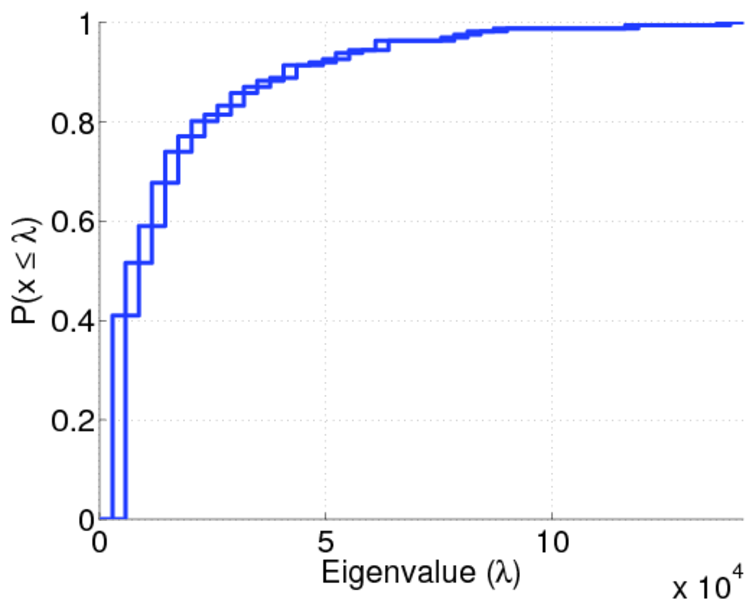
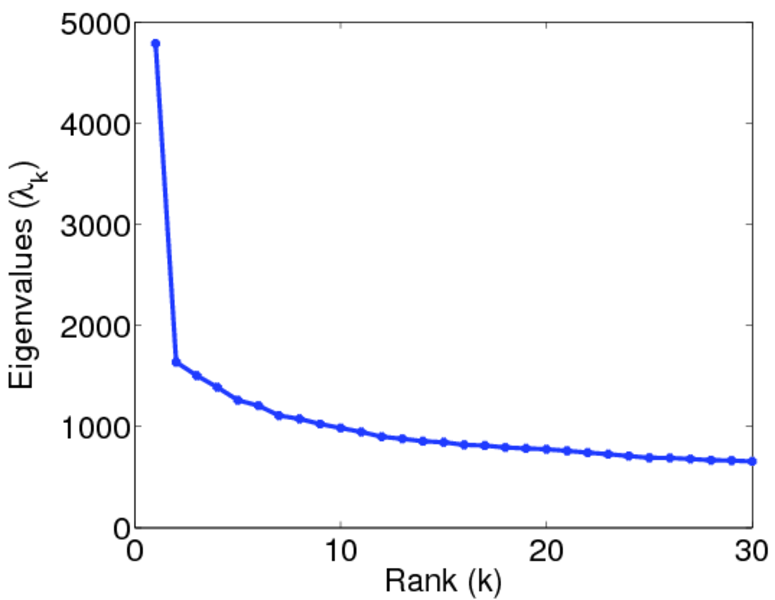
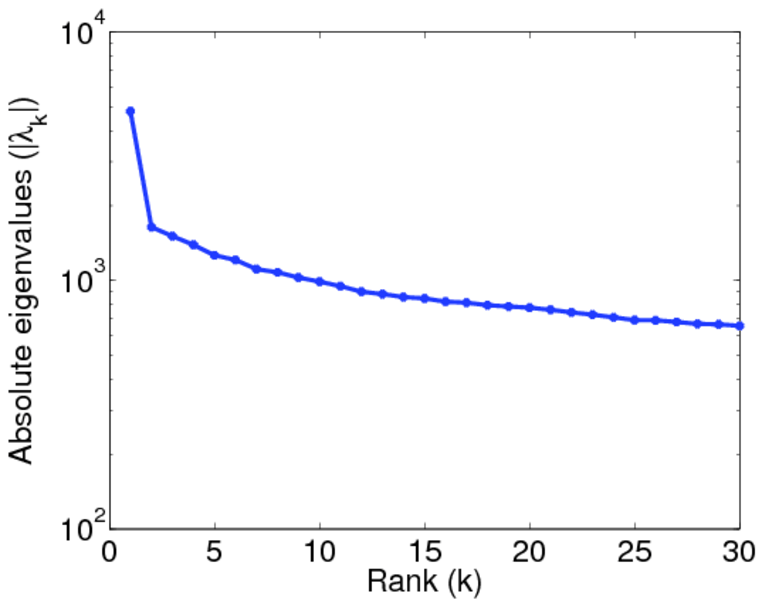
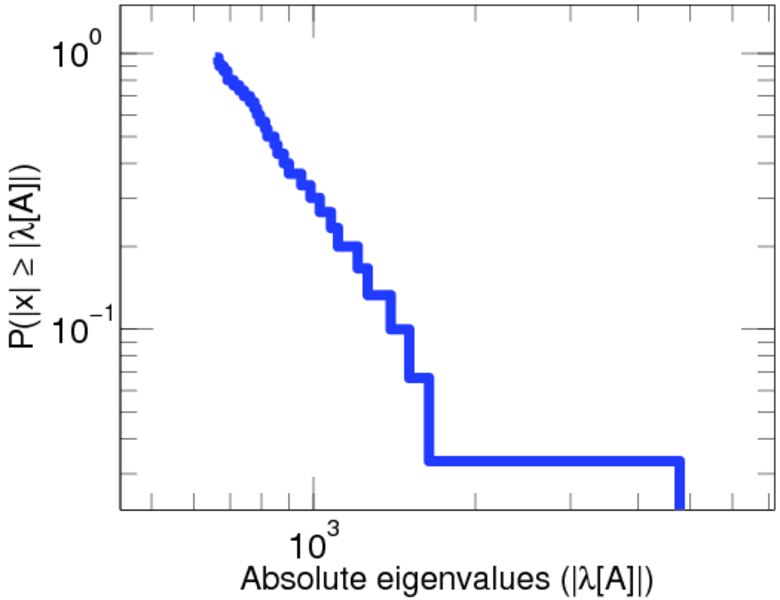
| Spectral norm | α = | 4,788.82
|
| Algebraic connectivity | a = | 0.882 279
|
| Spectral separation | |λ1[A] / λ2[A]| = | 2.922 42
|
| Controllability | C = | 271,179
|
| Relative controllability | Cr = | 0.979 909
|
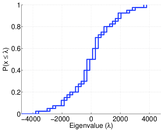
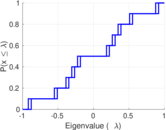
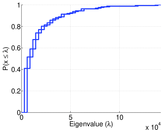
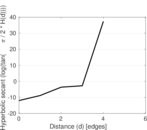
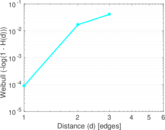
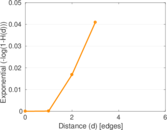
Plots


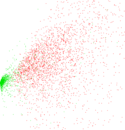


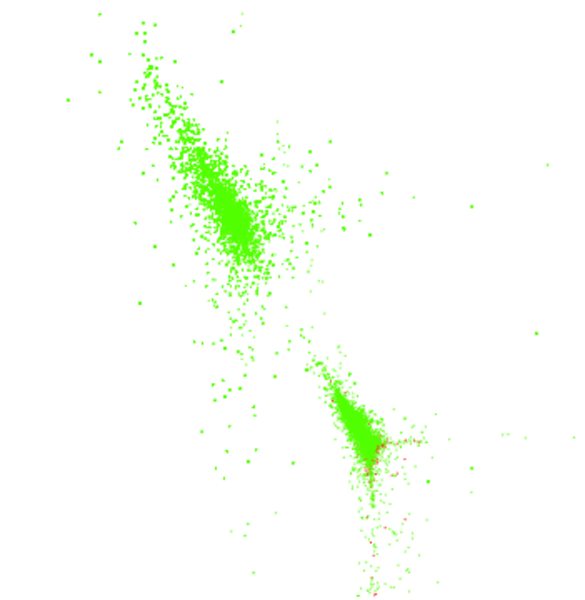
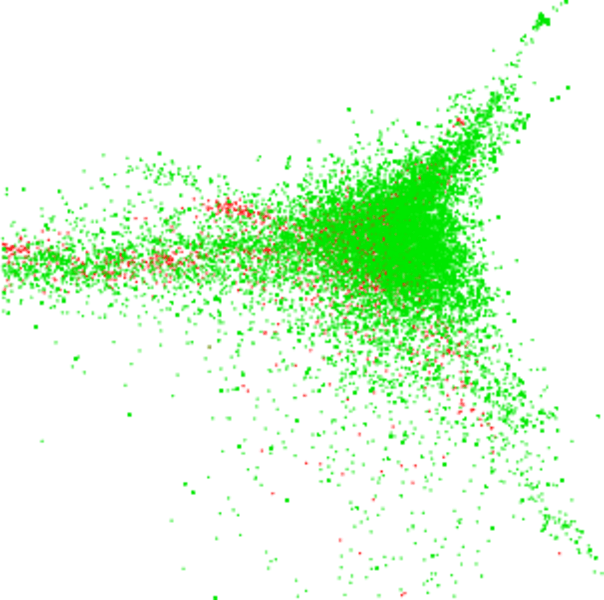
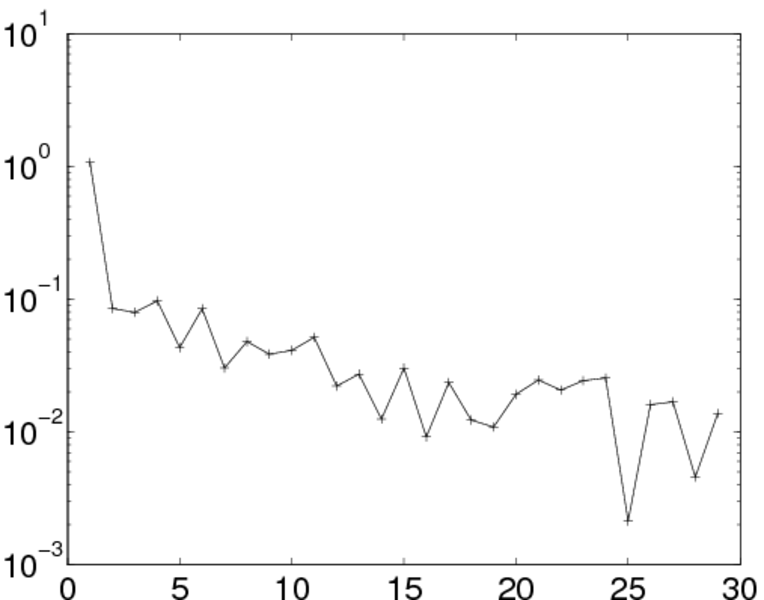
Matrix decompositions plots

Downloads
References
|
[1]
|
Jérôme Kunegis.
KONECT – The Koblenz Network Collection.
In Proc. Int. Conf. on World Wide Web Companion, pages
1343–1350, 2013.
[ http ]
|
|
[2]
|
Wikimedia Foundation.
Wikimedia downloads.
http://dumps.wikimedia.org/, January 2010.
|
 KONECT ‣ Networks ‣
Buy Me a Coffee
KONECT ‣ Networks ‣
Buy Me a Coffee