Reuters-21578
This is the bipartite network of article–word inclusions in documents that
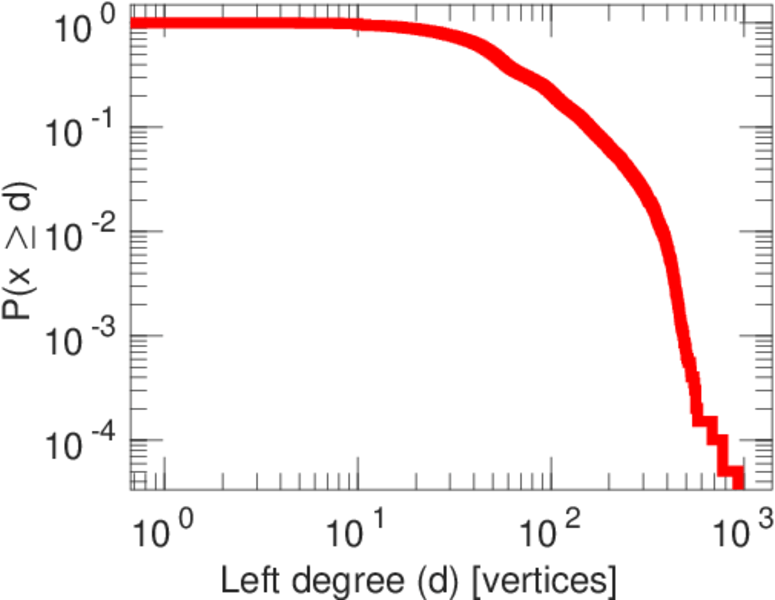
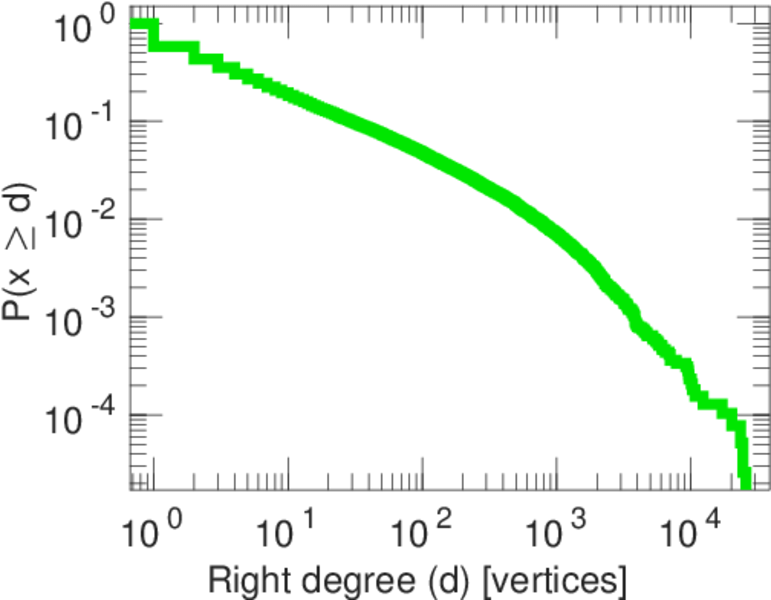
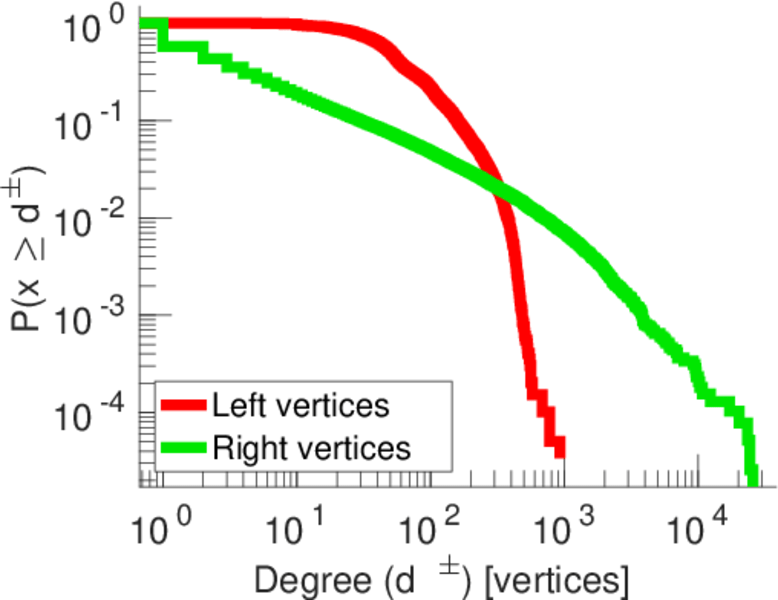
appeared on Reuters newswire in 1987. Left nodes represent articles and right
nodes represent words. An edge represents an article–word inclusion.
Metadata
Statistics
| Size | n = | 60,234
|
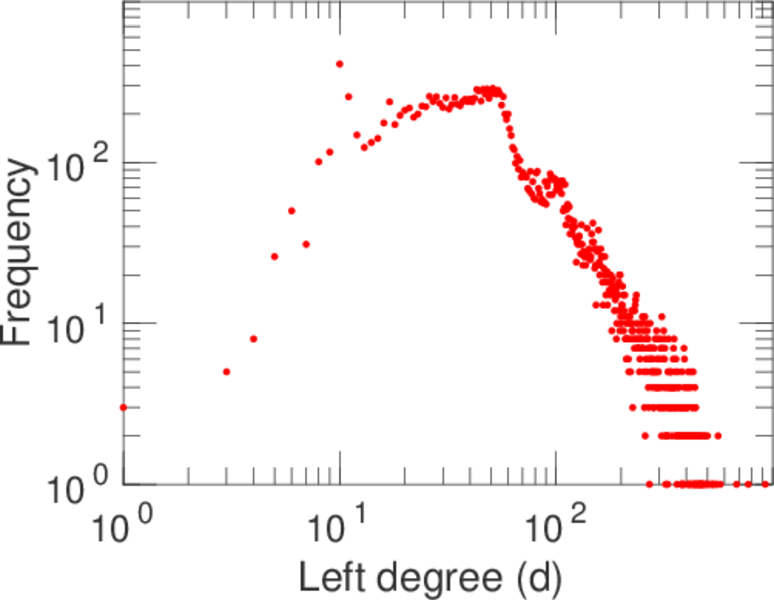
| Left size | n1 = | 21,557
|
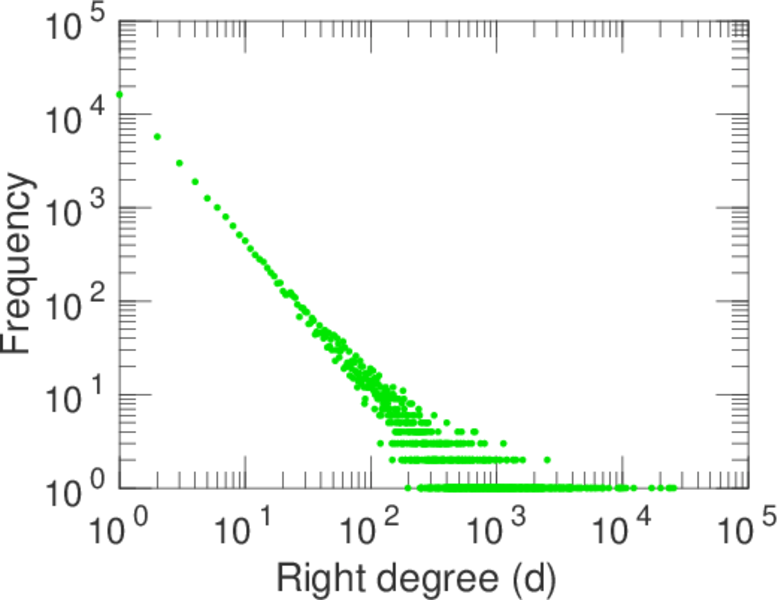
| Right size | n2 = | 38,677
|
| Volume | m = | 1,464,182
|
| Unique edge count | m̿ = | 978,446
|
| Wedge count | s = | 821,566,836
|
| Claw count | z = | 1,978,784,882,823
|
| Cross count | x = | 6,916,709,380,031,432
|
| Square count | q = | 2,502,669,891
|
| 4-Tour count | T4 = | 23,309,665,440
|
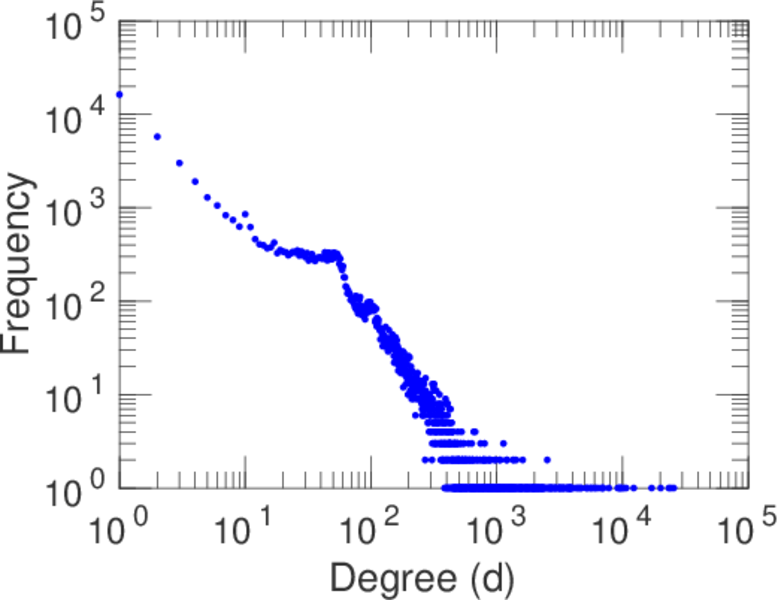
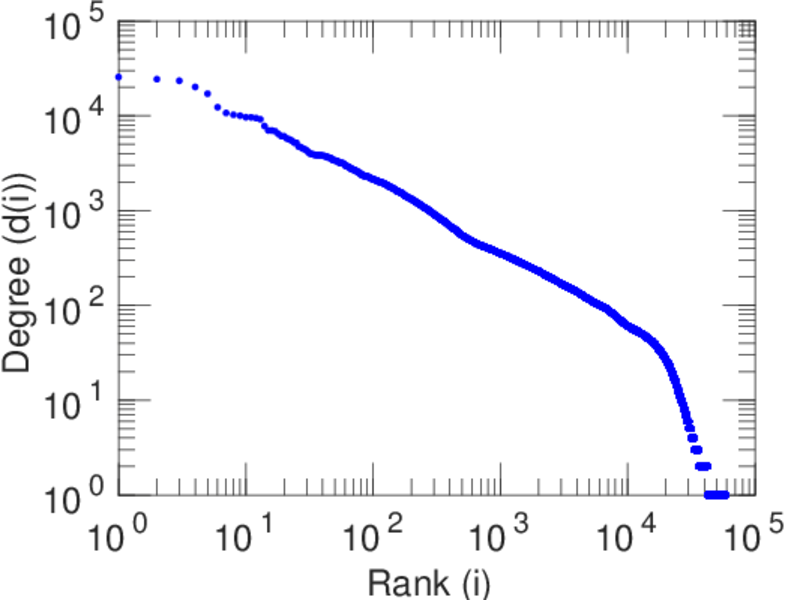
| Maximum degree | dmax = | 19,044
|
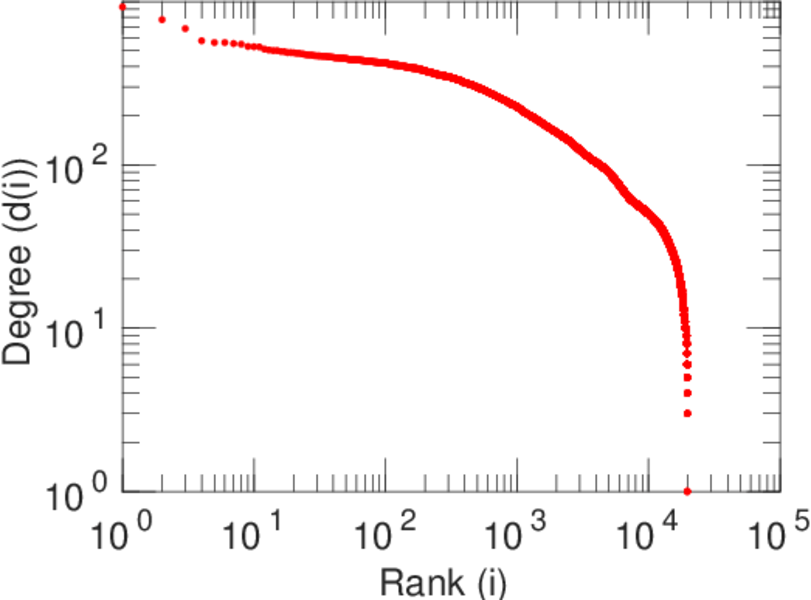
| Maximum left degree | d1max = | 380
|
| Maximum right degree | d2max = | 19,044
|
| Average degree | d = | 48.616 5
|
| Average left degree | d1 = | 67.921 4
|
| Average right degree | d2 = | 37.856 7
|
| Fill | p = | 0.001 173 53
|
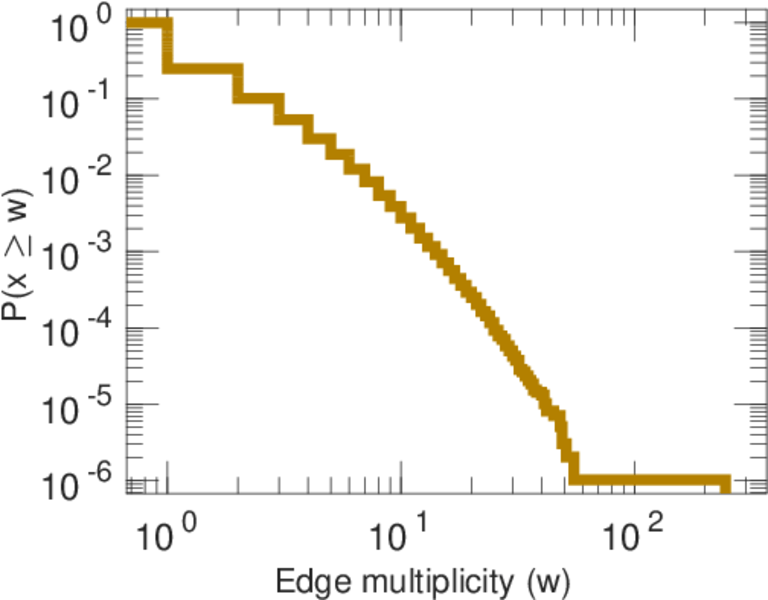
| Average edge multiplicity | m̃ = | 1.496 44
|
| Size of LCC | N = | 58,433
|
| Diameter | δ = | 7
|
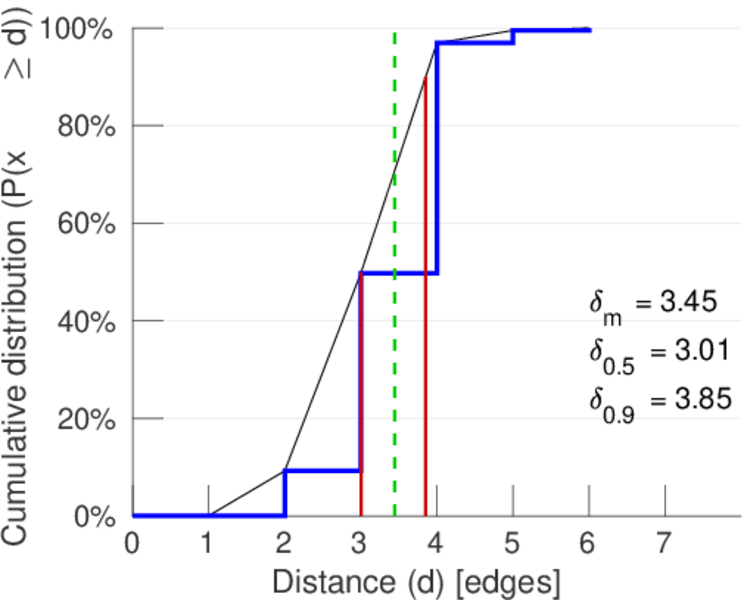
| 50-Percentile effective diameter | δ0.5 = | 3.005 57
|
| 90-Percentile effective diameter | δ0.9 = | 3.853 43
|
| Median distance | δM = | 4
|
| Mean distance | δm = | 3.445 74
|
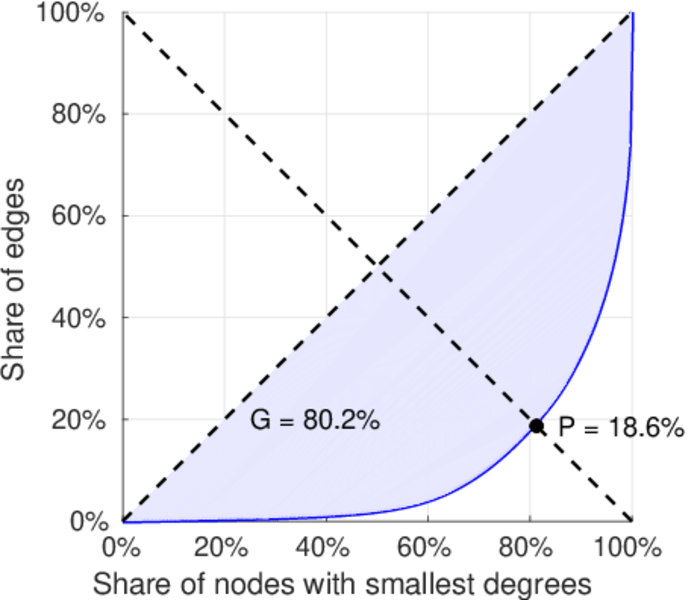
| Gini coefficient | G = | 0.754 152
|
| Balanced inequality ratio | P = | 0.213 382
|
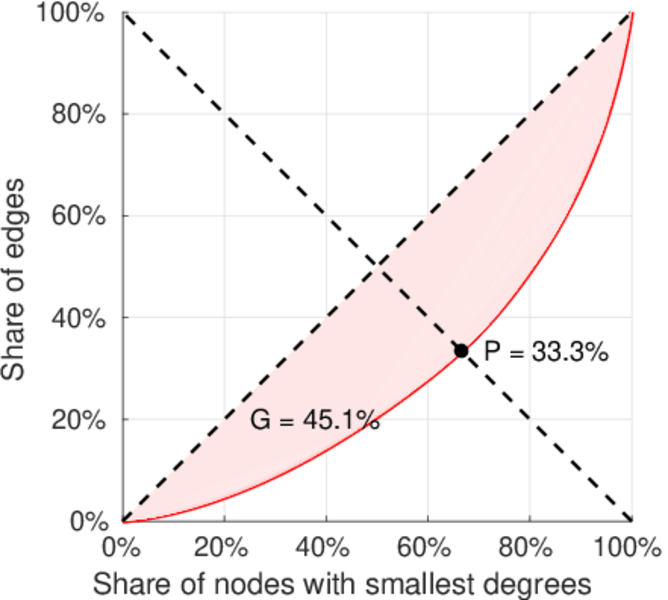
| Left balanced inequality ratio | P1 = | 0.333 062
|
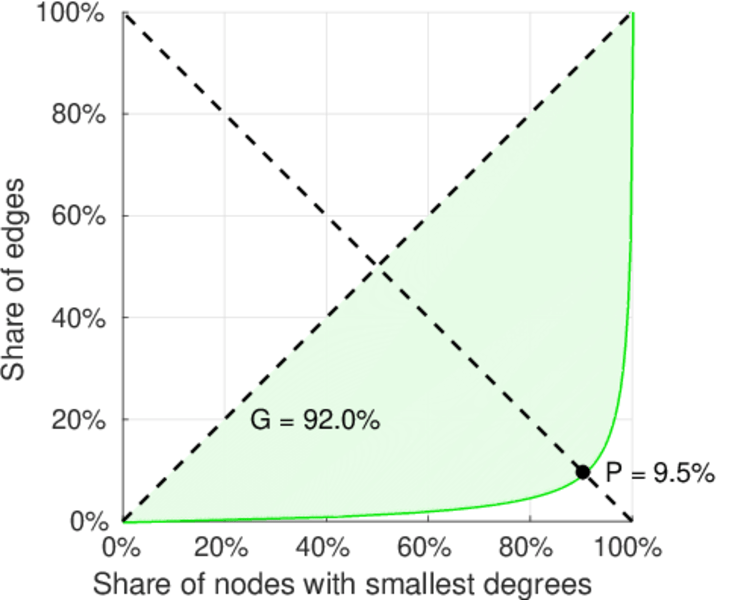
| Right balanced inequality ratio | P2 = | 0.094 919 9
|
| Power law exponent | γ = | 1.532 15
|
| Tail power law exponent | γt = | 2.291 00
|
| Degree assortativity | ρ = | −0.147 873
|
| Degree assortativity p-value | pρ = | 0.000 00
|
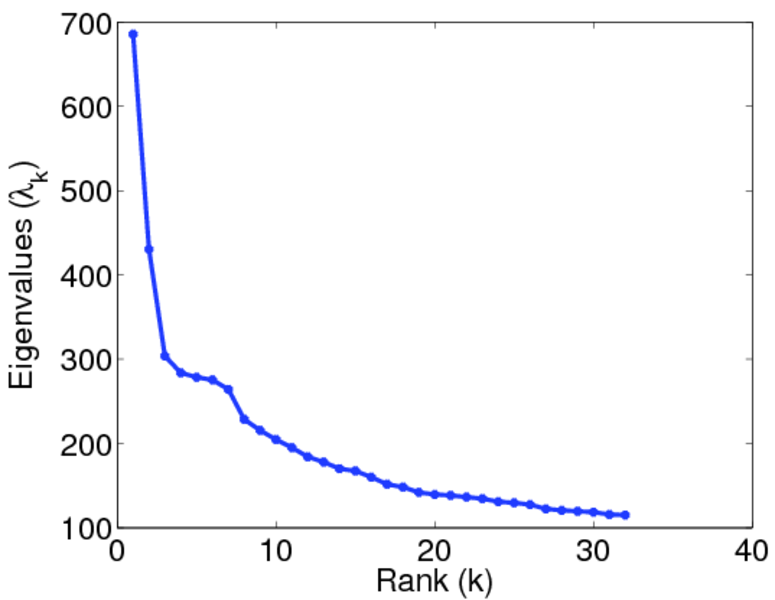
| Spectral norm | α = | 685.707
|
| Algebraic connectivity | a = | 0.218 874
|
| Spectral separation | |λ1[A] / λ2[A]| = | 1.592 83
|
| Controllability | C = | 23,631
|
| Relative controllability | Cr = | 0.404 405
|
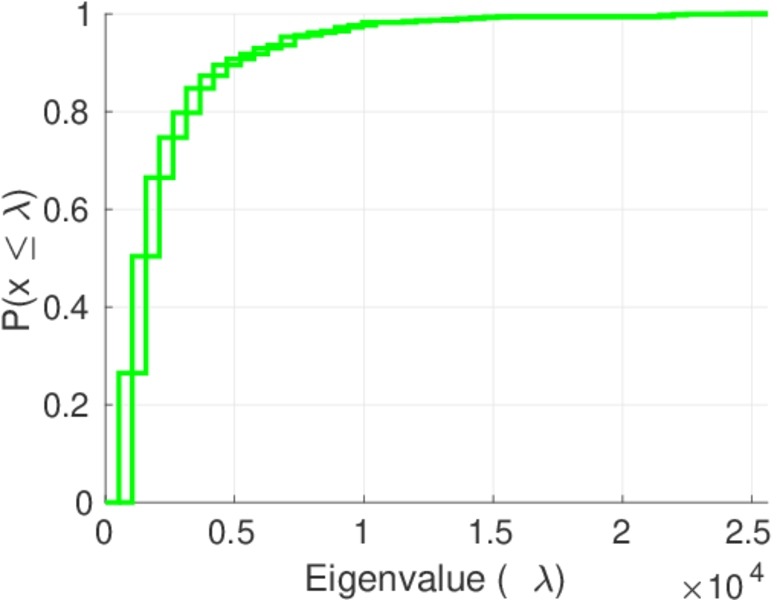
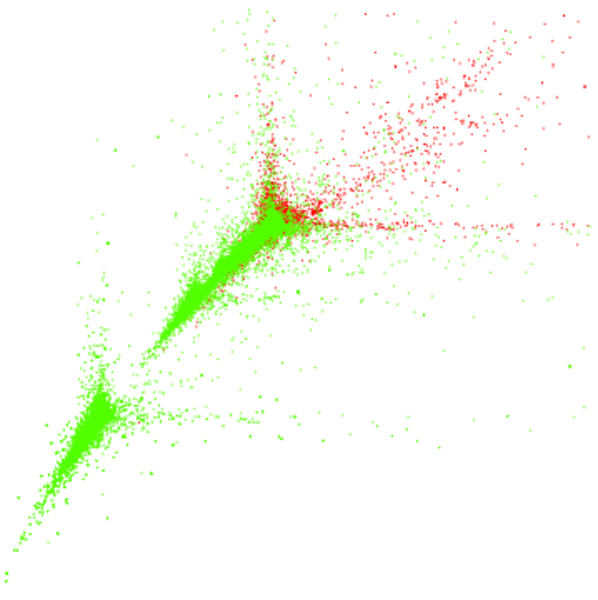
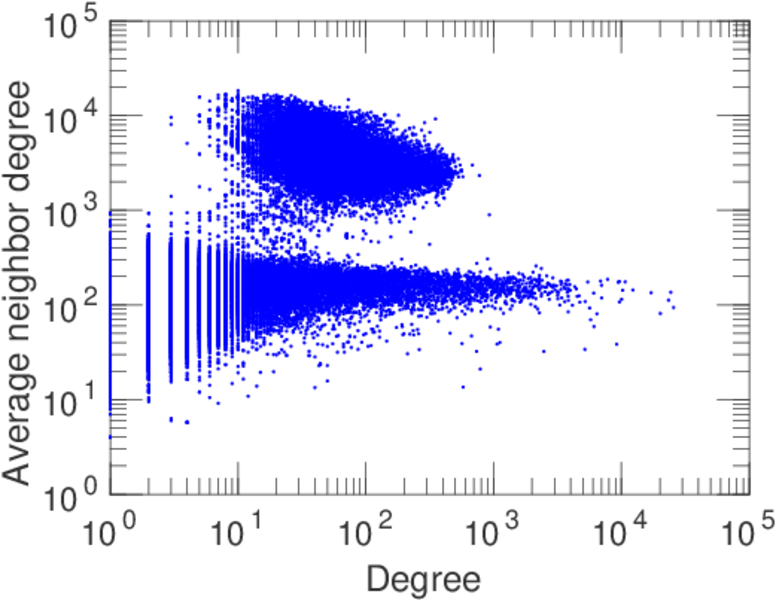
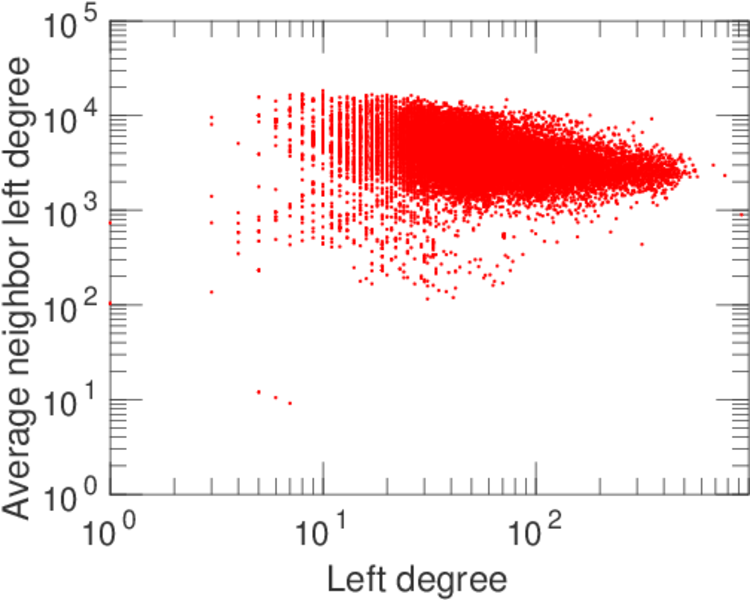
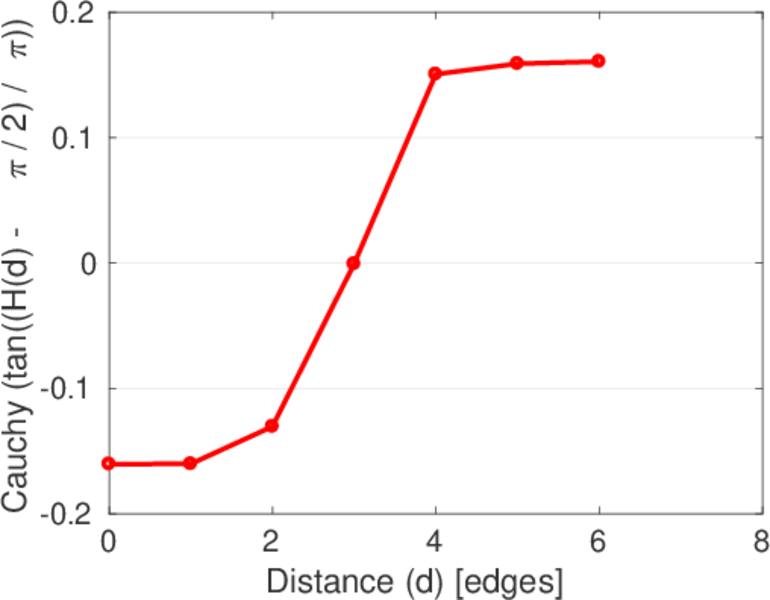
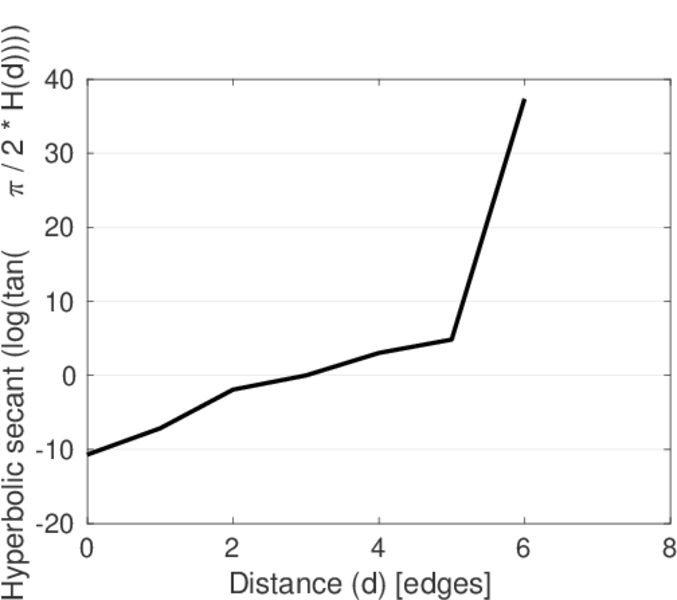
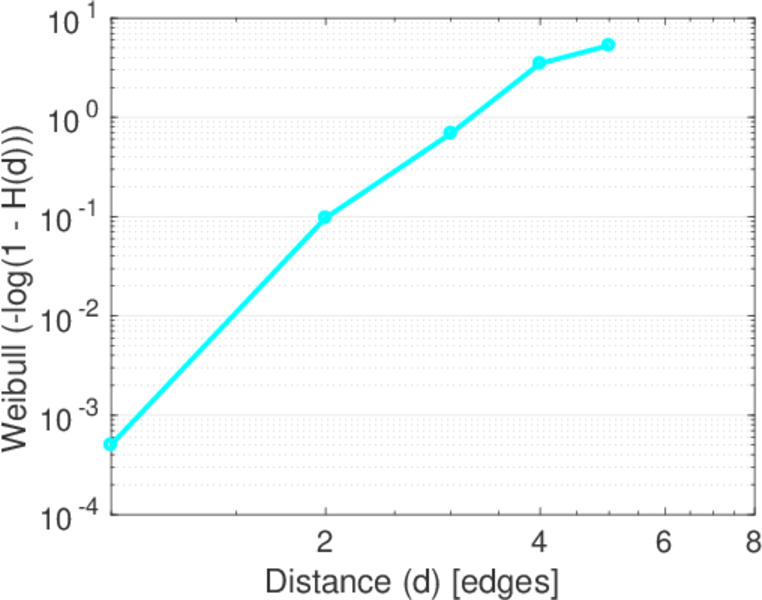
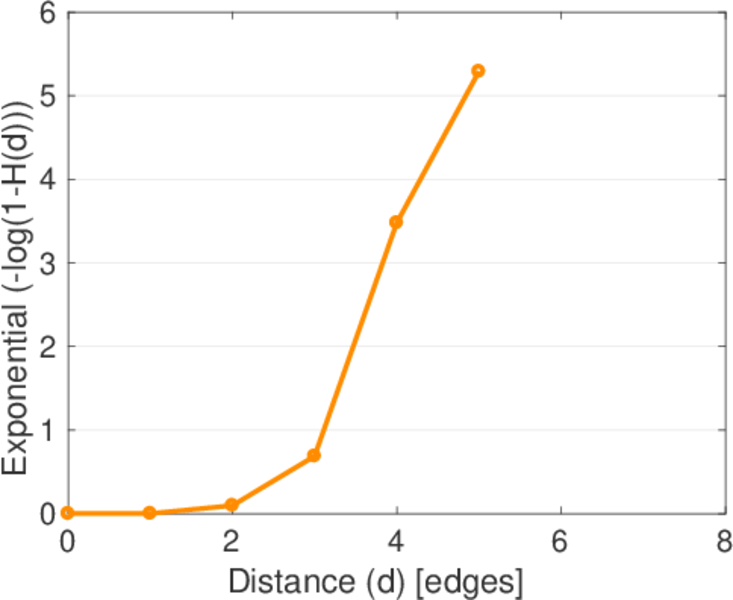
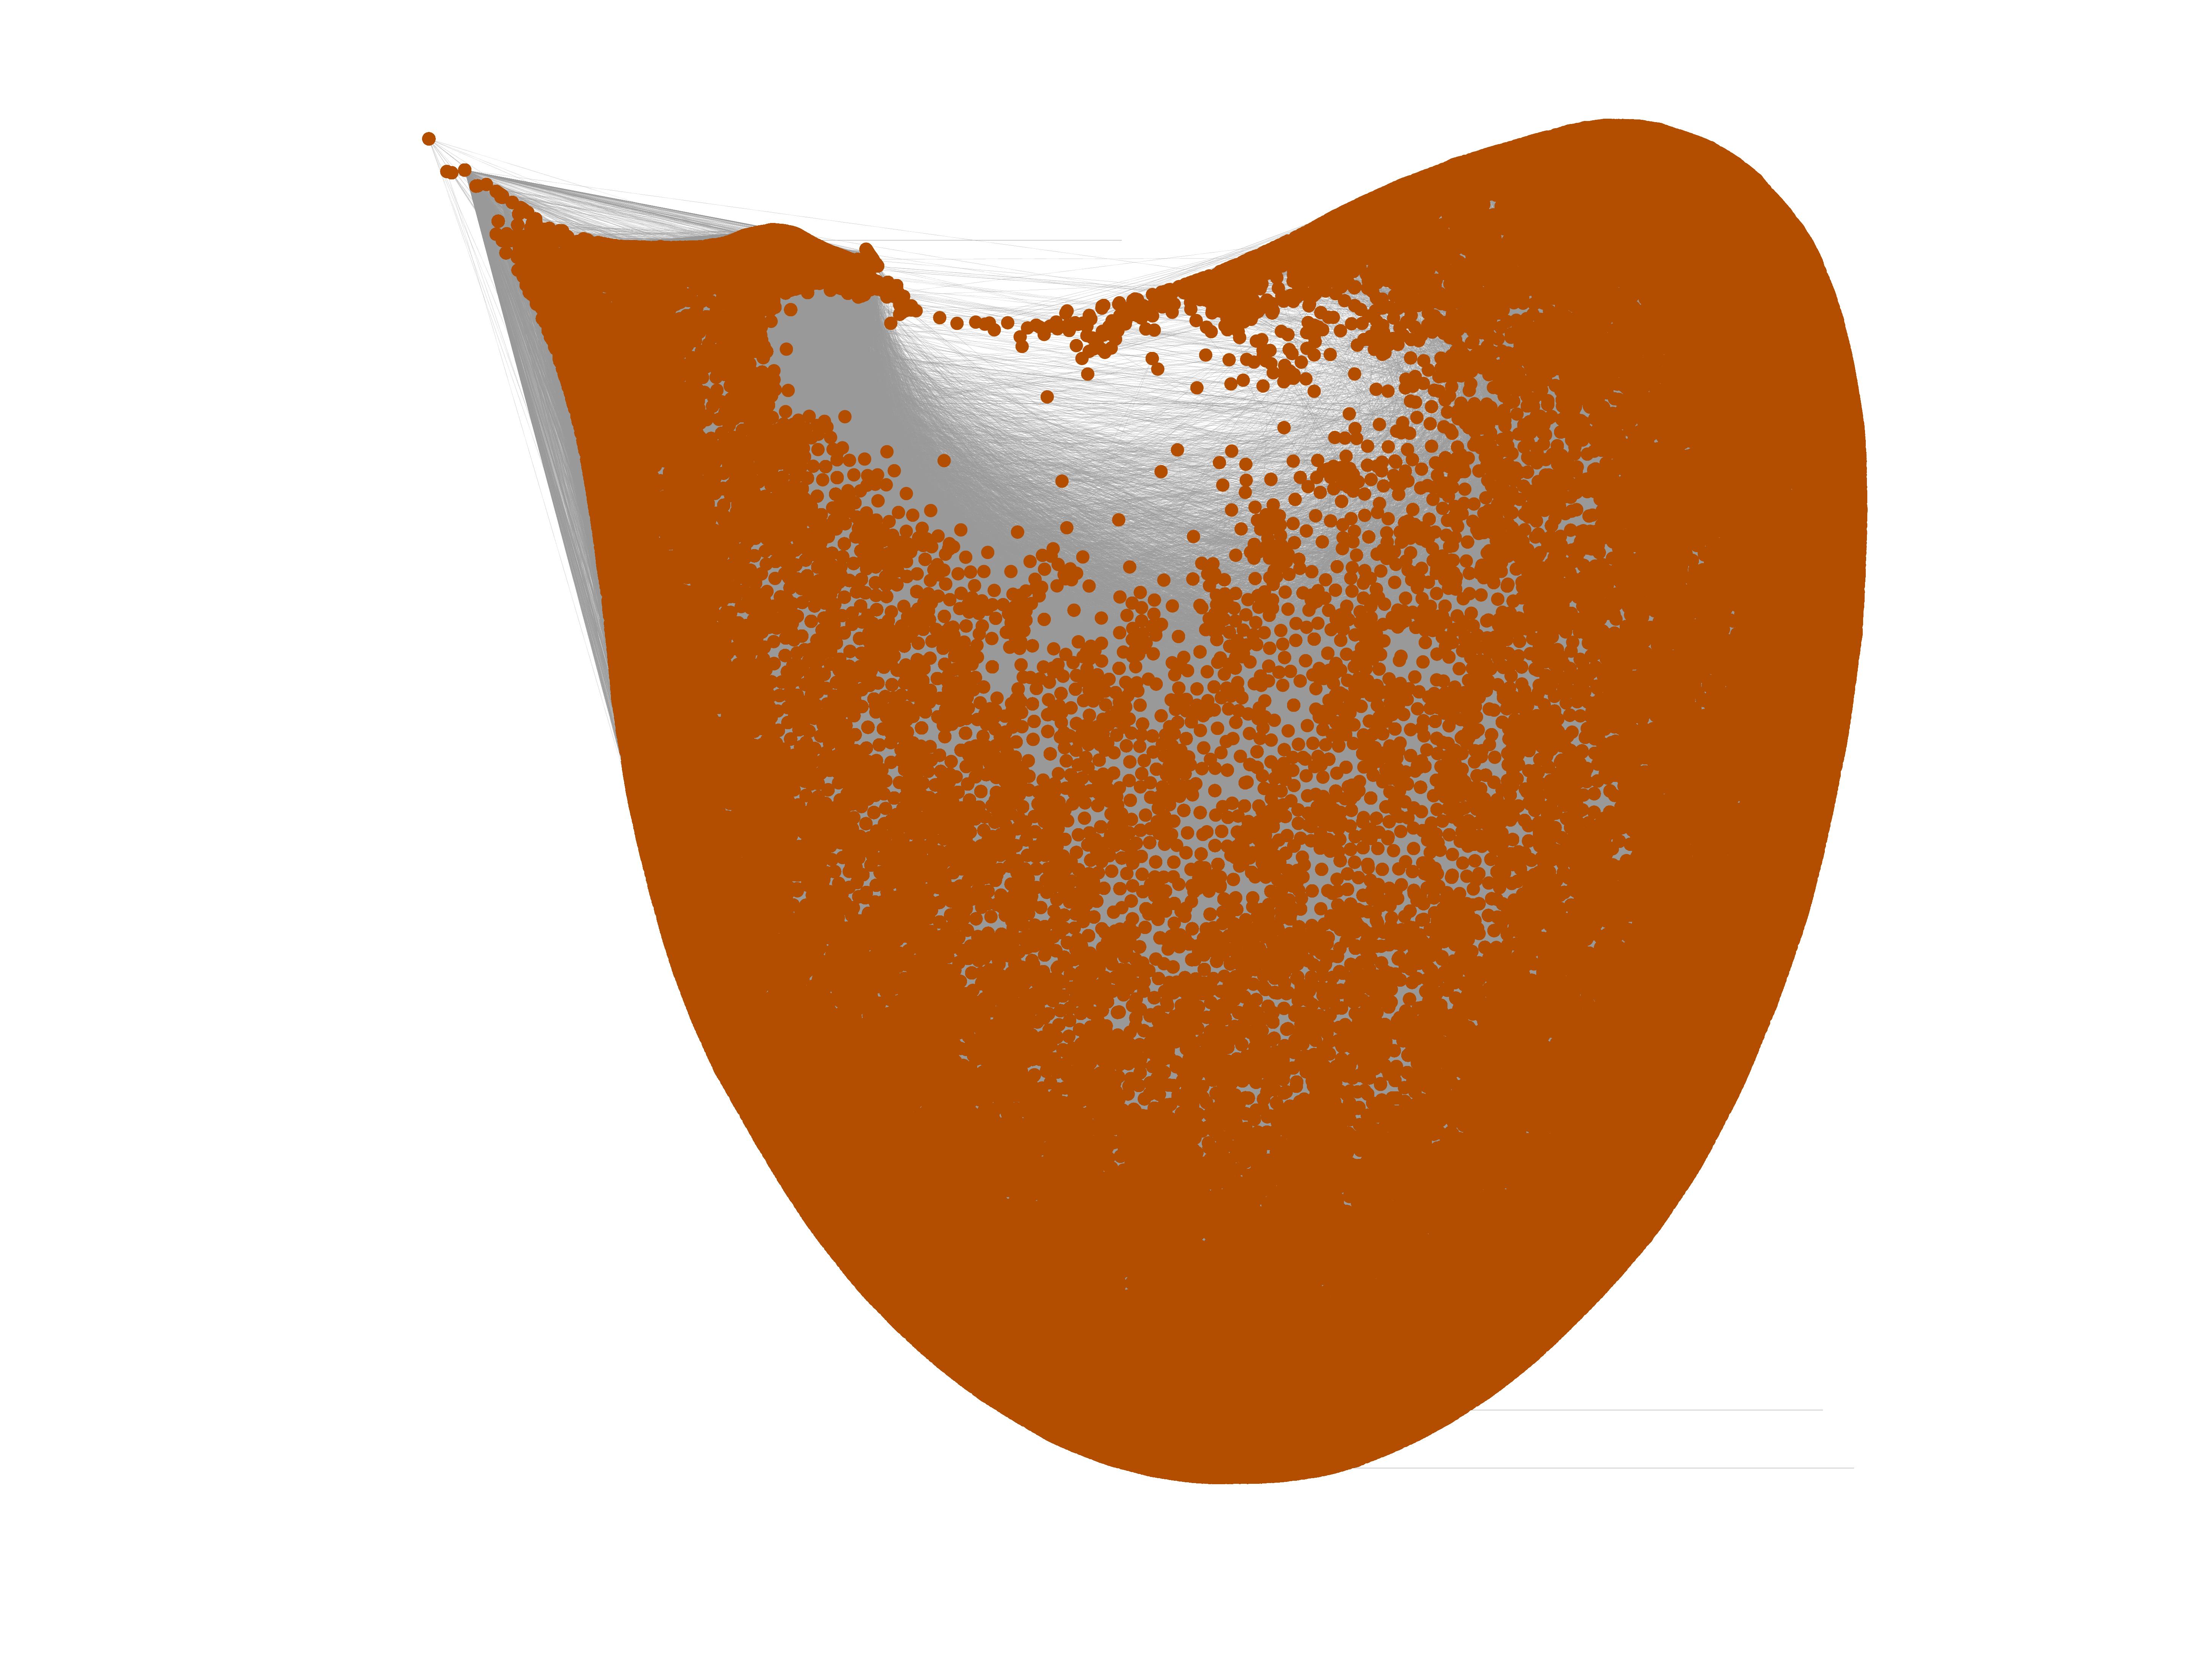
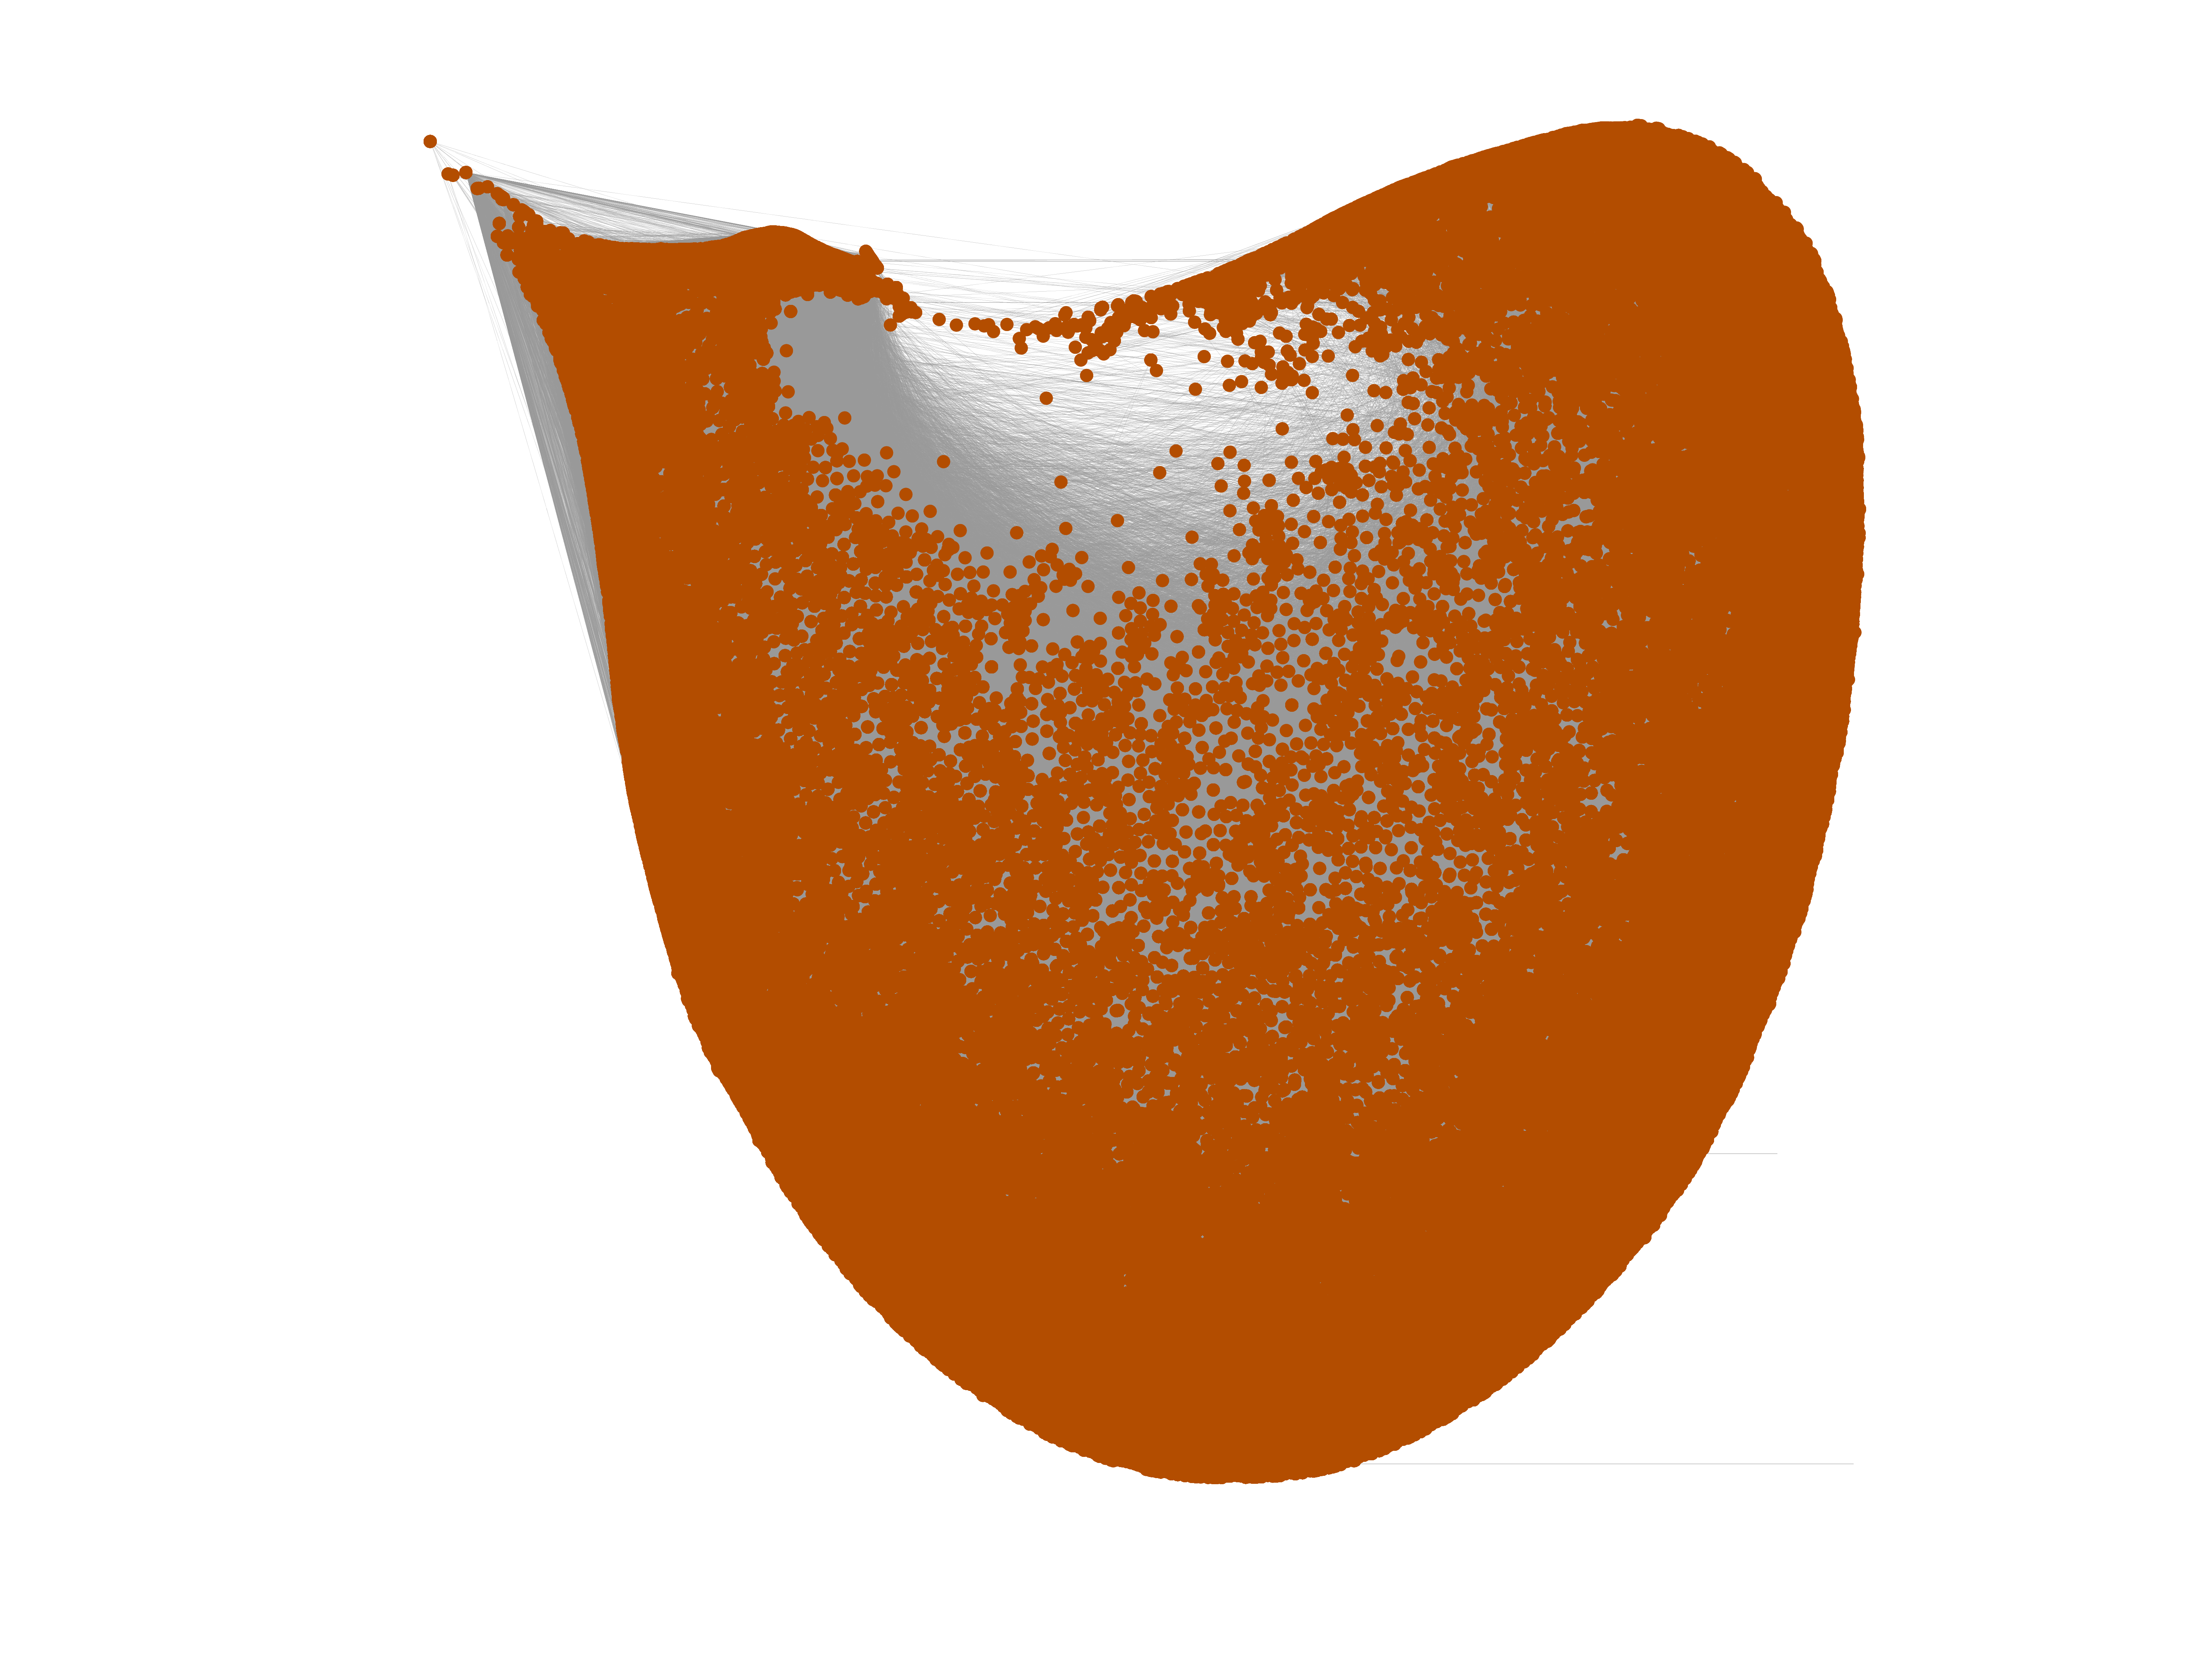
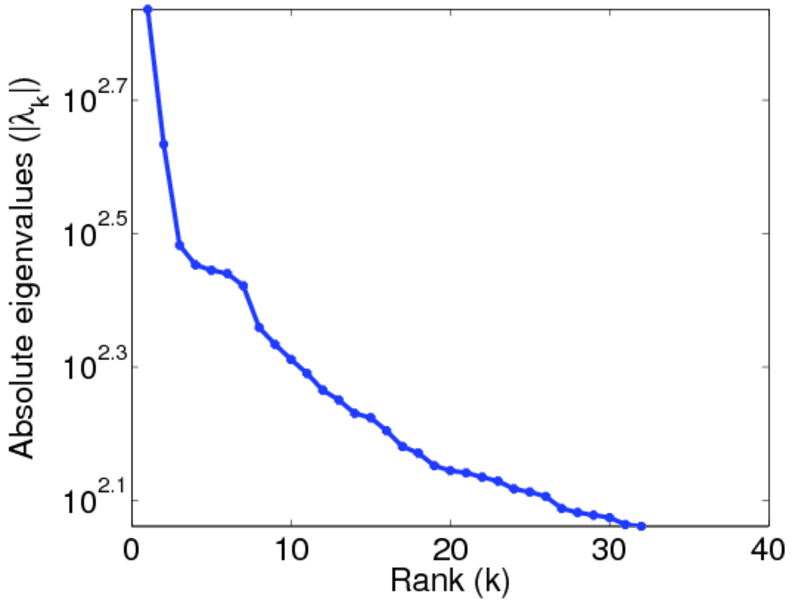
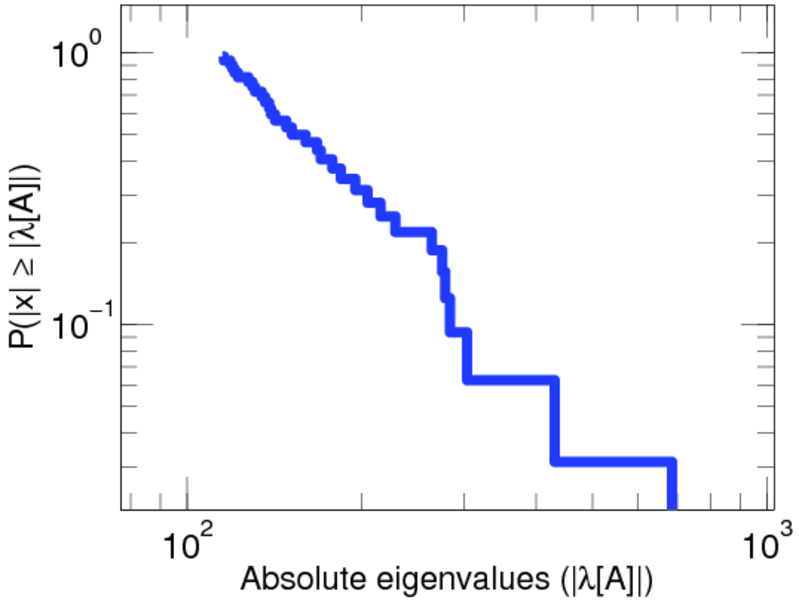
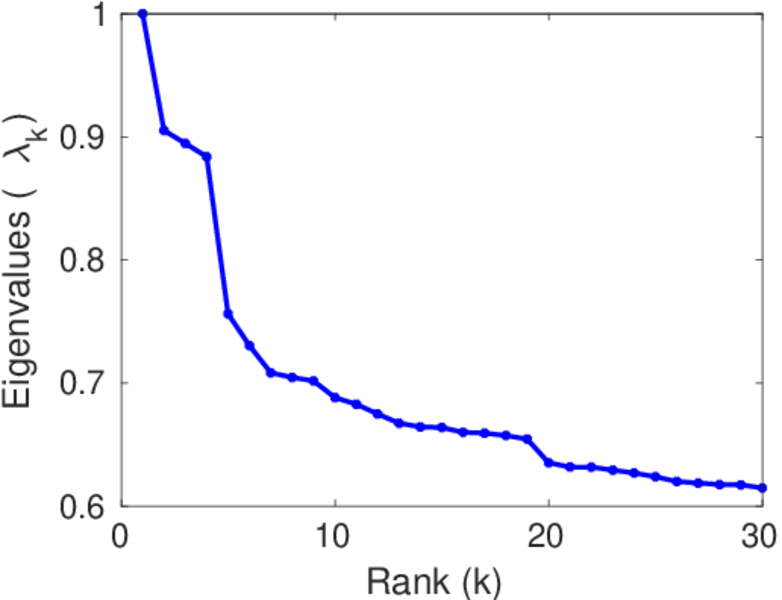
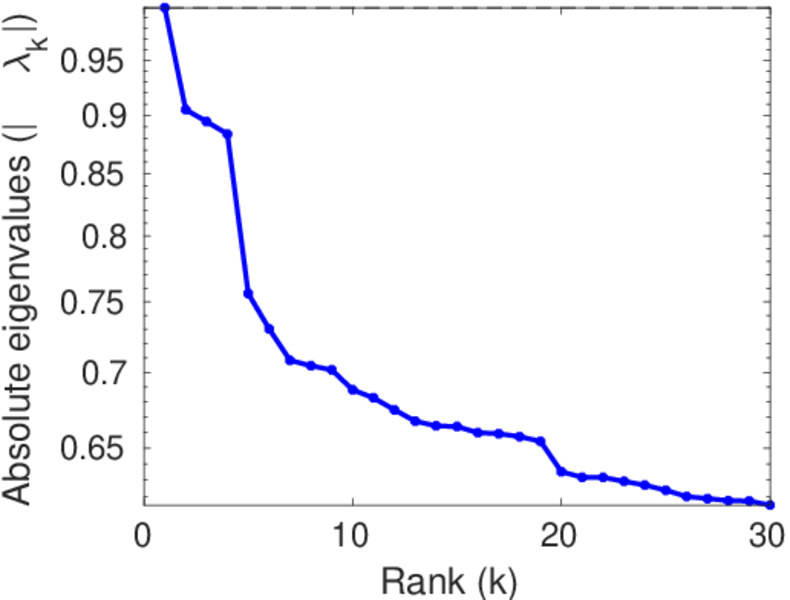
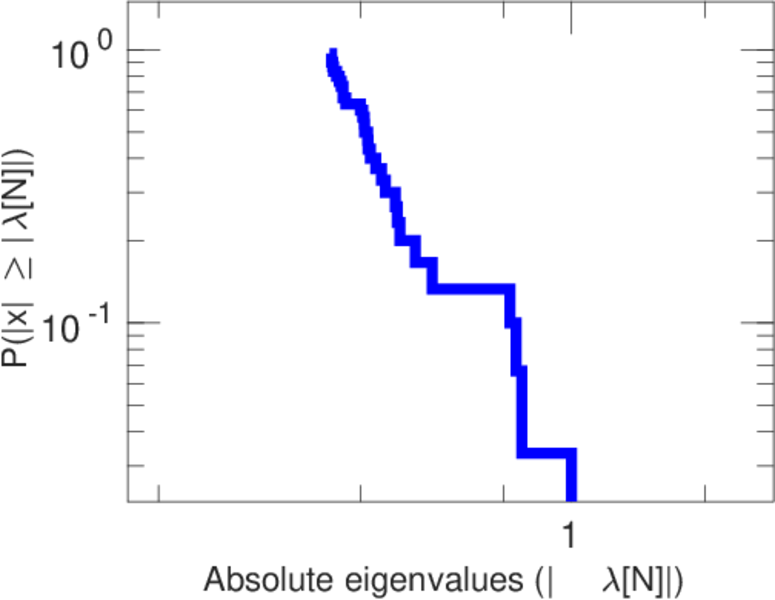
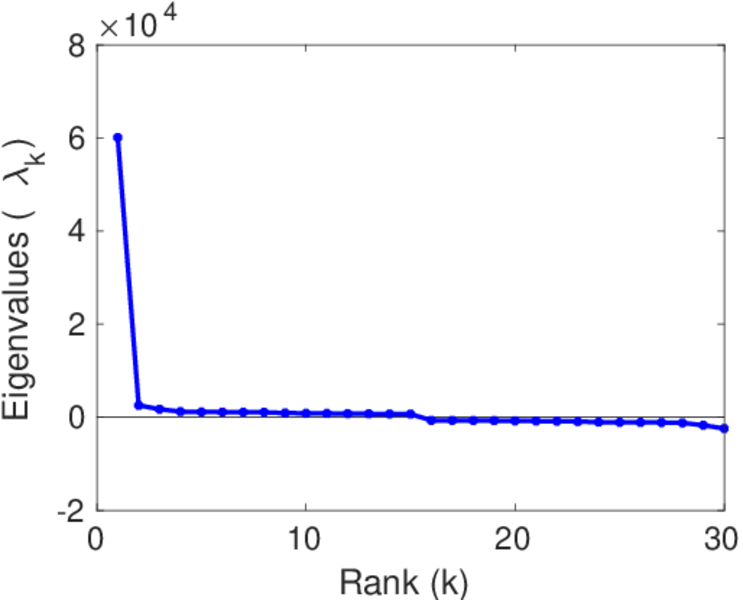
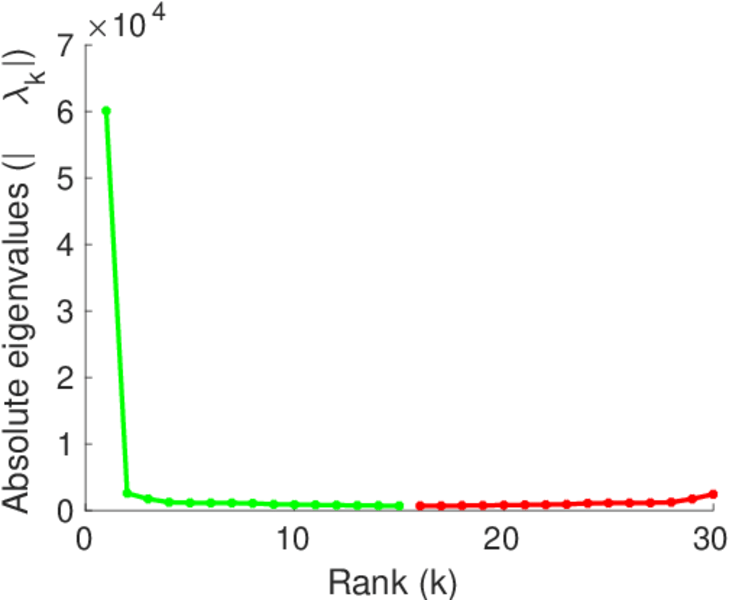
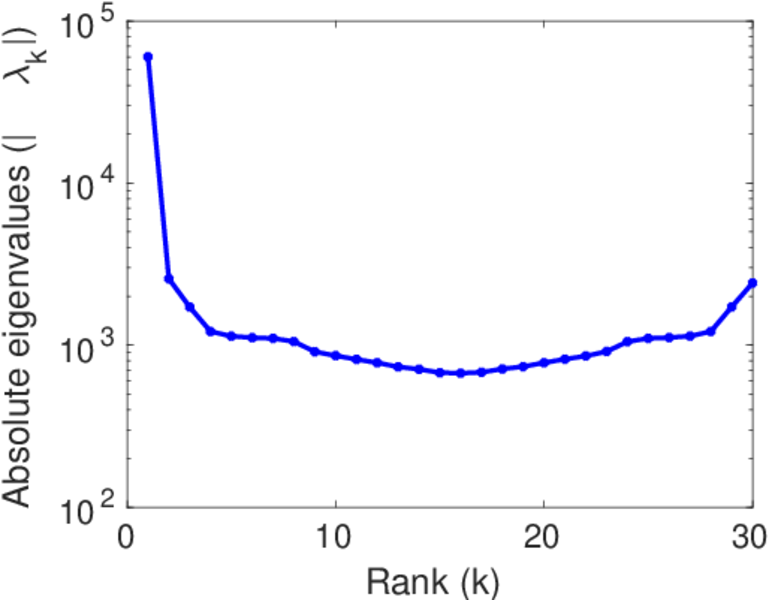
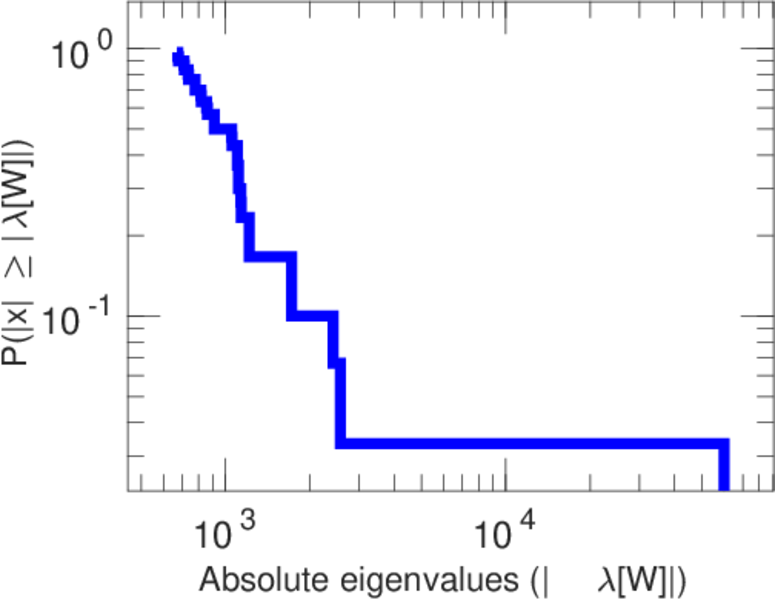
Plots


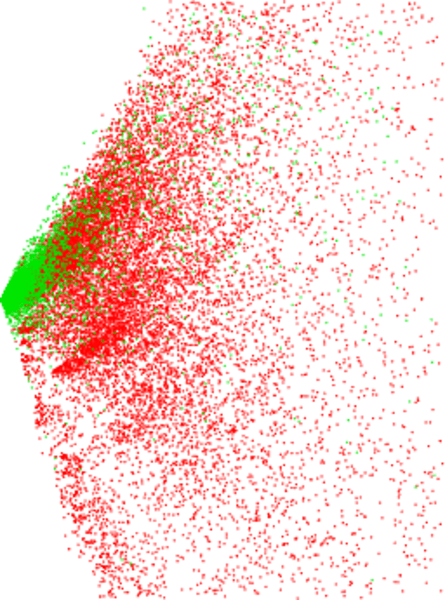
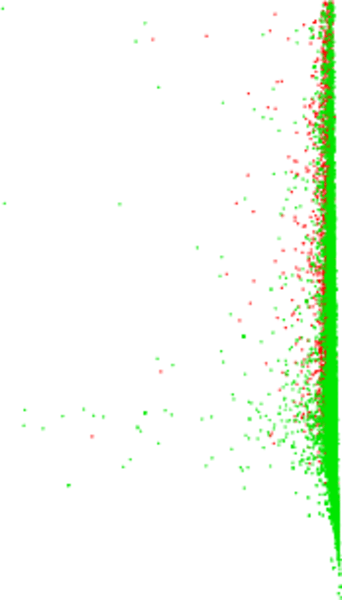
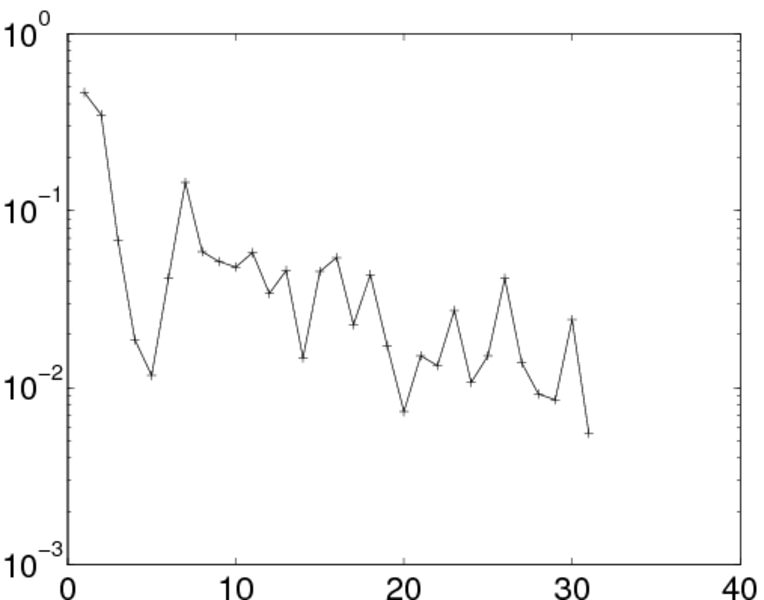
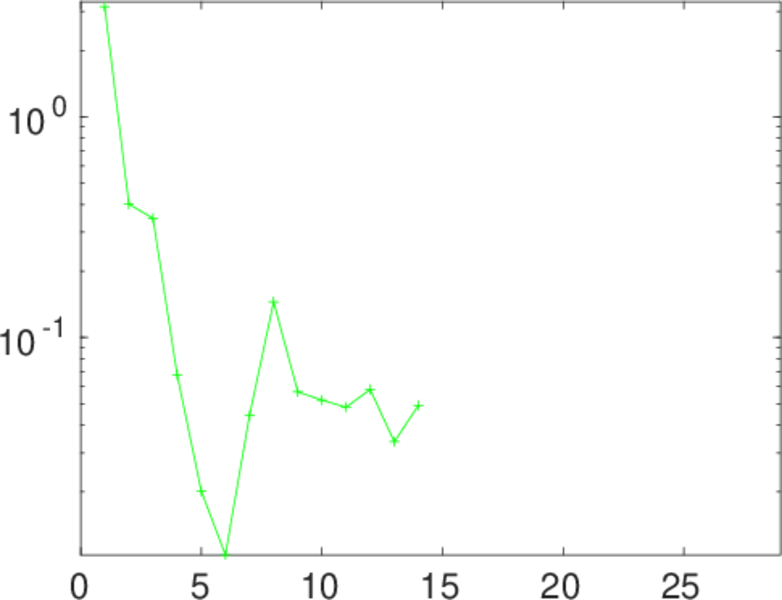
Matrix decompositions plots


Downloads
References
|
[1]
|
Jérôme Kunegis.
KONECT – The Koblenz Network Collection.
In Proc. Int. Conf. on World Wide Web Companion, pages
1343–1350, 2013.
[ http ]
|
|
[2]
|
David D. Lewis, Yiming Yang, Tony G. Rose, and Fan Li.
RCV1: A new benchmark collection for text categorization research.
J. Mach. Learn. Res., 5:361–397, 2004.
|
 KONECT ‣ Networks ‣
Buy Me a Coffee
KONECT ‣ Networks ‣
Buy Me a Coffee