Jester 100
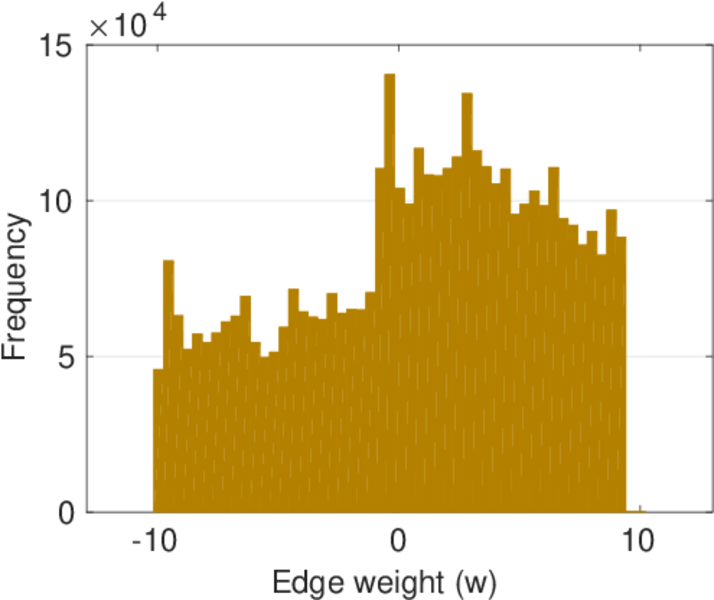
This weighted network contains information about how users rated a total
ammount of 100 jokes. Not every user rated every joke. Rating values are
continuous values between −10 and +10. An edge shows that a user has rated a
joke. Left nodes are users and right nodes are jokes.
Metadata
Statistics
| Size | n = | 73,521
|
| Left size | n1 = | 73,421
|
| Right size | n2 = | 100
|
| Volume | m = | 4,136,360
|
| Wedge count | s = | 102,339,759,934
|
| Claw count | z = | 1,907,263,353,344,646
|
| Cross count | x = | 2.893 18 × 1019
|
| Square count | q = | 2,599,984,203,310
|
| 4-Tour count | T4 = | 21,209,254,824,380
|
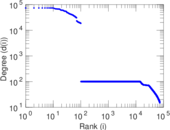
| Maximum degree | dmax = | 73,413
|
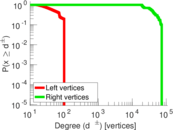
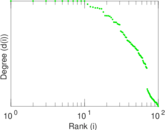
| Maximum left degree | d1max = | 100
|
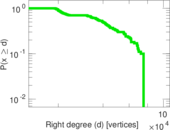
| Maximum right degree | d2max = | 73,413
|
| Average degree | d = | 112.522
|
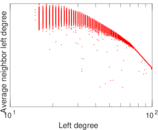
| Average left degree | d1 = | 56.337 6
|
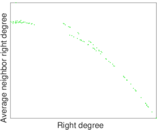
| Average right degree | d2 = | 41,363.6
|
| Fill | p = | 0.563 376
|
| Size of LCC | N = | 73,521
|
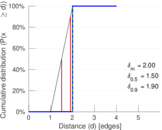
| Diameter | δ = | 4
|
| 50-Percentile effective diameter | δ0.5 = | 1.499 62
|
| 90-Percentile effective diameter | δ0.9 = | 1.900 42
|
| Median distance | δM = | 2
|
| Mean distance | δm = | 1.999 22
|
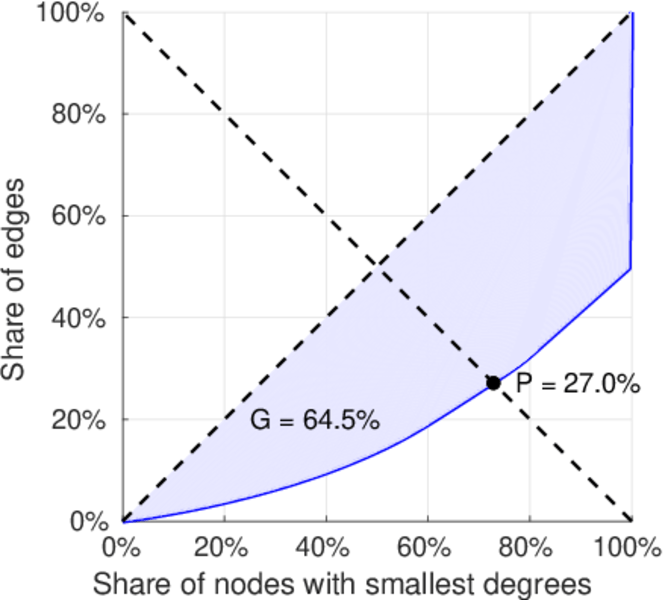
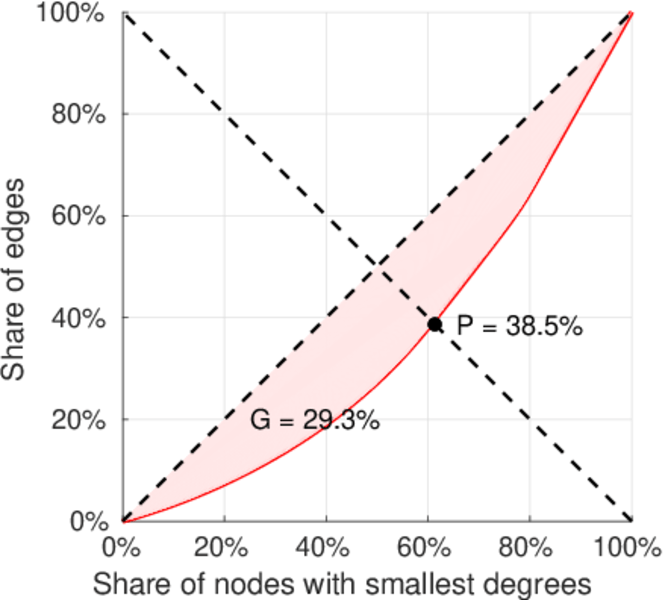
| Gini coefficient | G = | 0.645 907
|
| Balanced inequality ratio | P = | 0.269 422
|
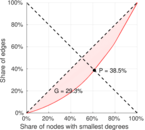
| Left balanced inequality ratio | P1 = | 0.385 244
|
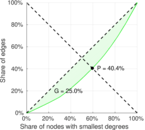
| Right balanced inequality ratio | P2 = | 0.404 071
|
| Relative edge distribution entropy | Her = | 0.756 826
|
| Power law exponent | γ = | 1.849 21
|
| Tail power law exponent | γt = | 2.091 00
|
| Degree assortativity | ρ = | −0.413 704
|
| Degree assortativity p-value | pρ = | 0.000 00
|
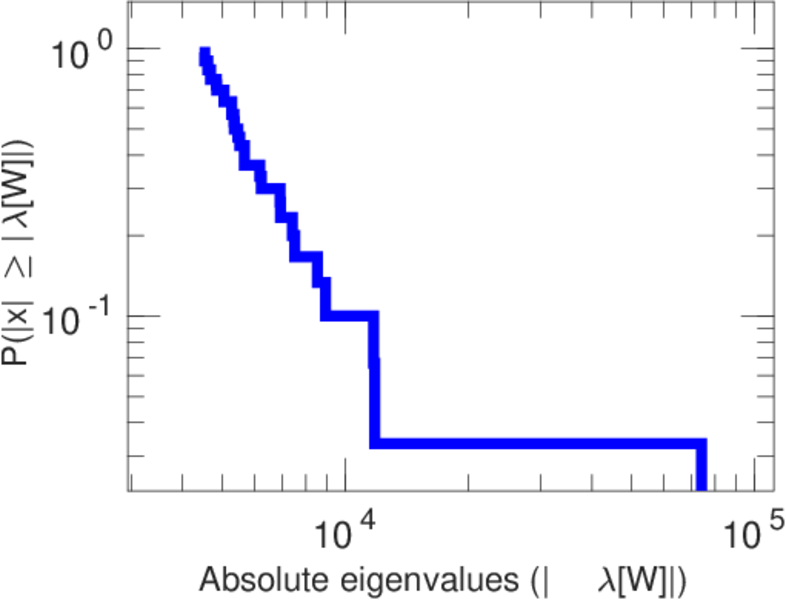
| Spectral norm | α = | 3,007.63
|
| Algebraic connectivity | a = | 8.924 26
|
| Spectral separation | |λ1[A] / λ2[A]| = | 1.172 23
|
| Negativity | ζ = | 0.455 631
|
| Algebraic conflict | ξ = | 14.999 6
|
| Spectral signed frustration | φ = | 0.033 325 9
|
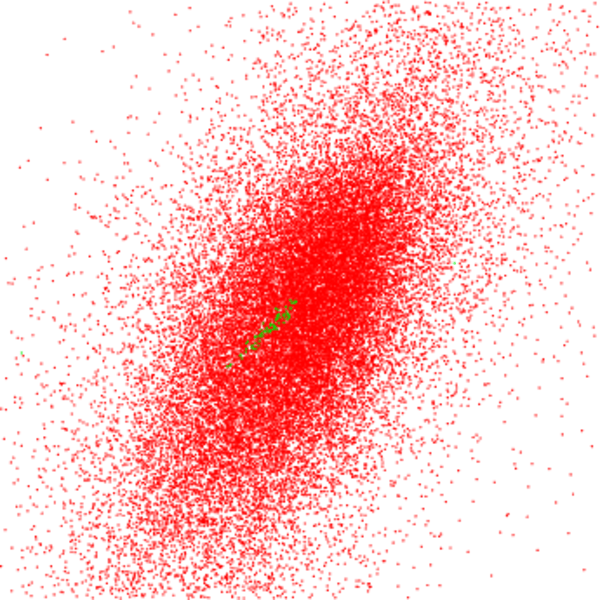
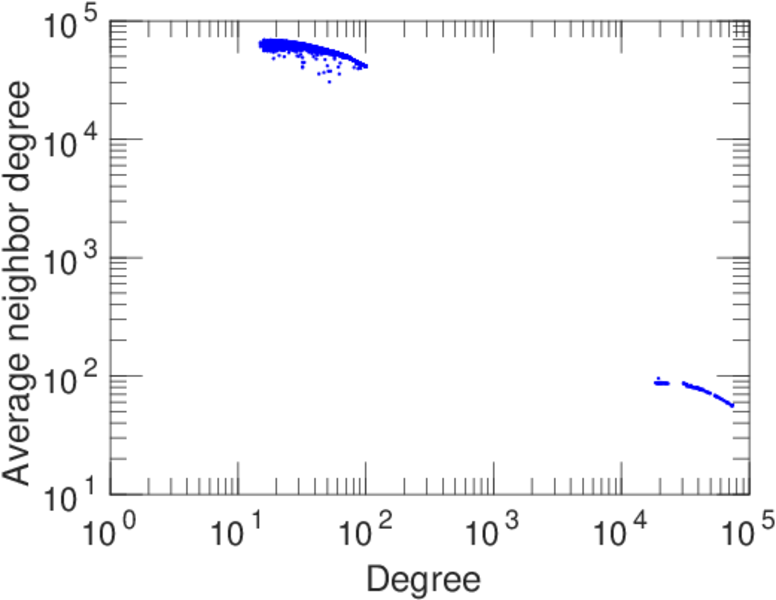
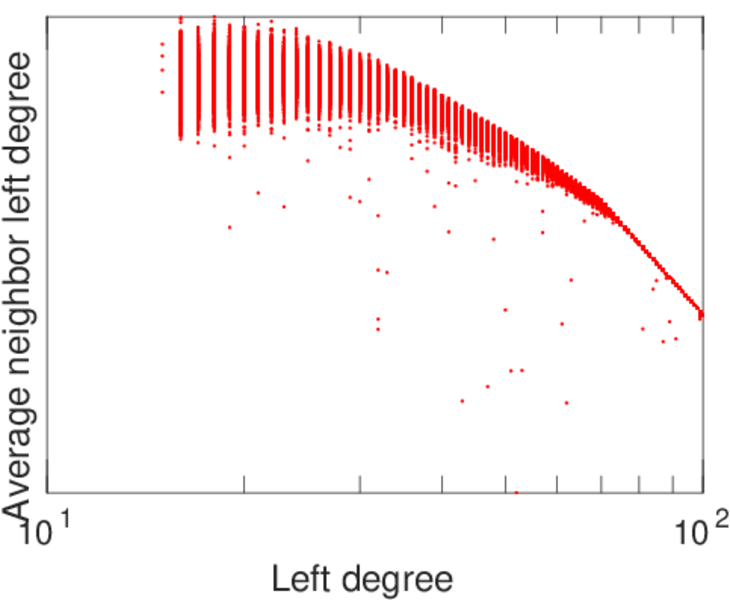
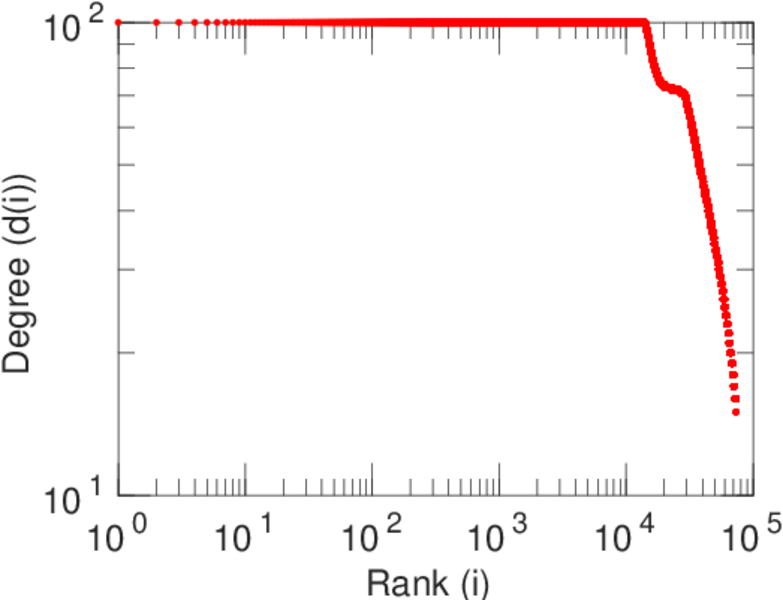
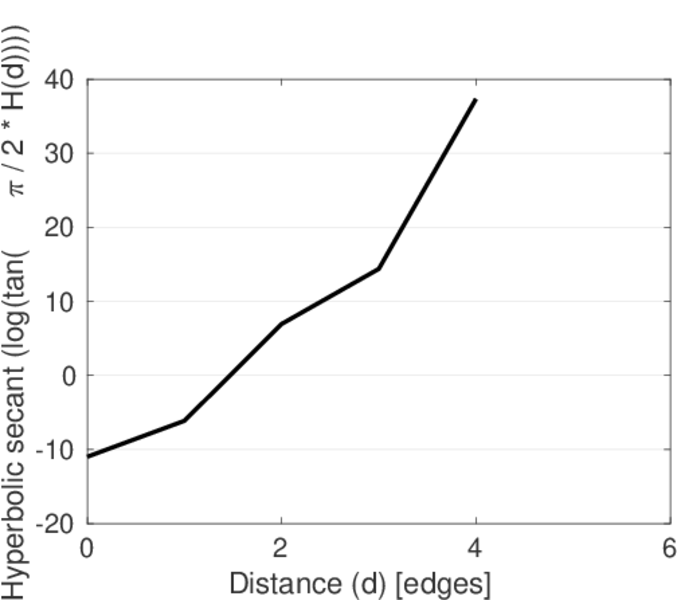
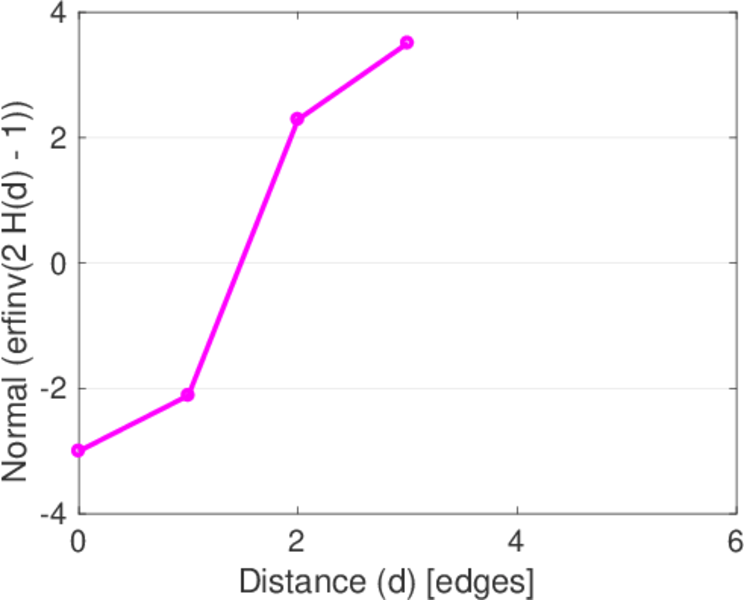
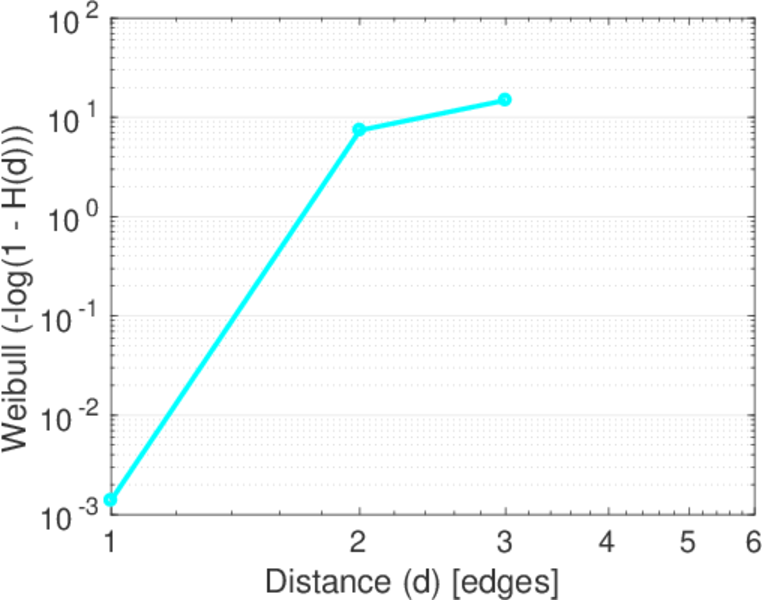
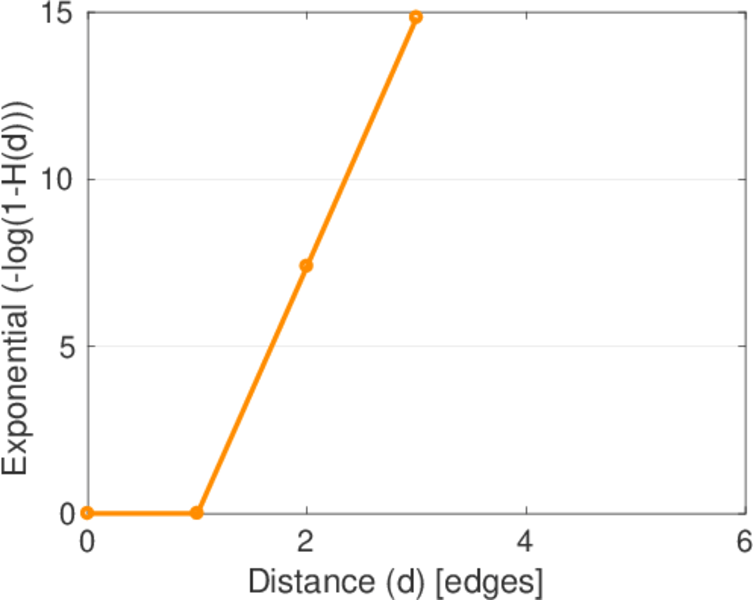
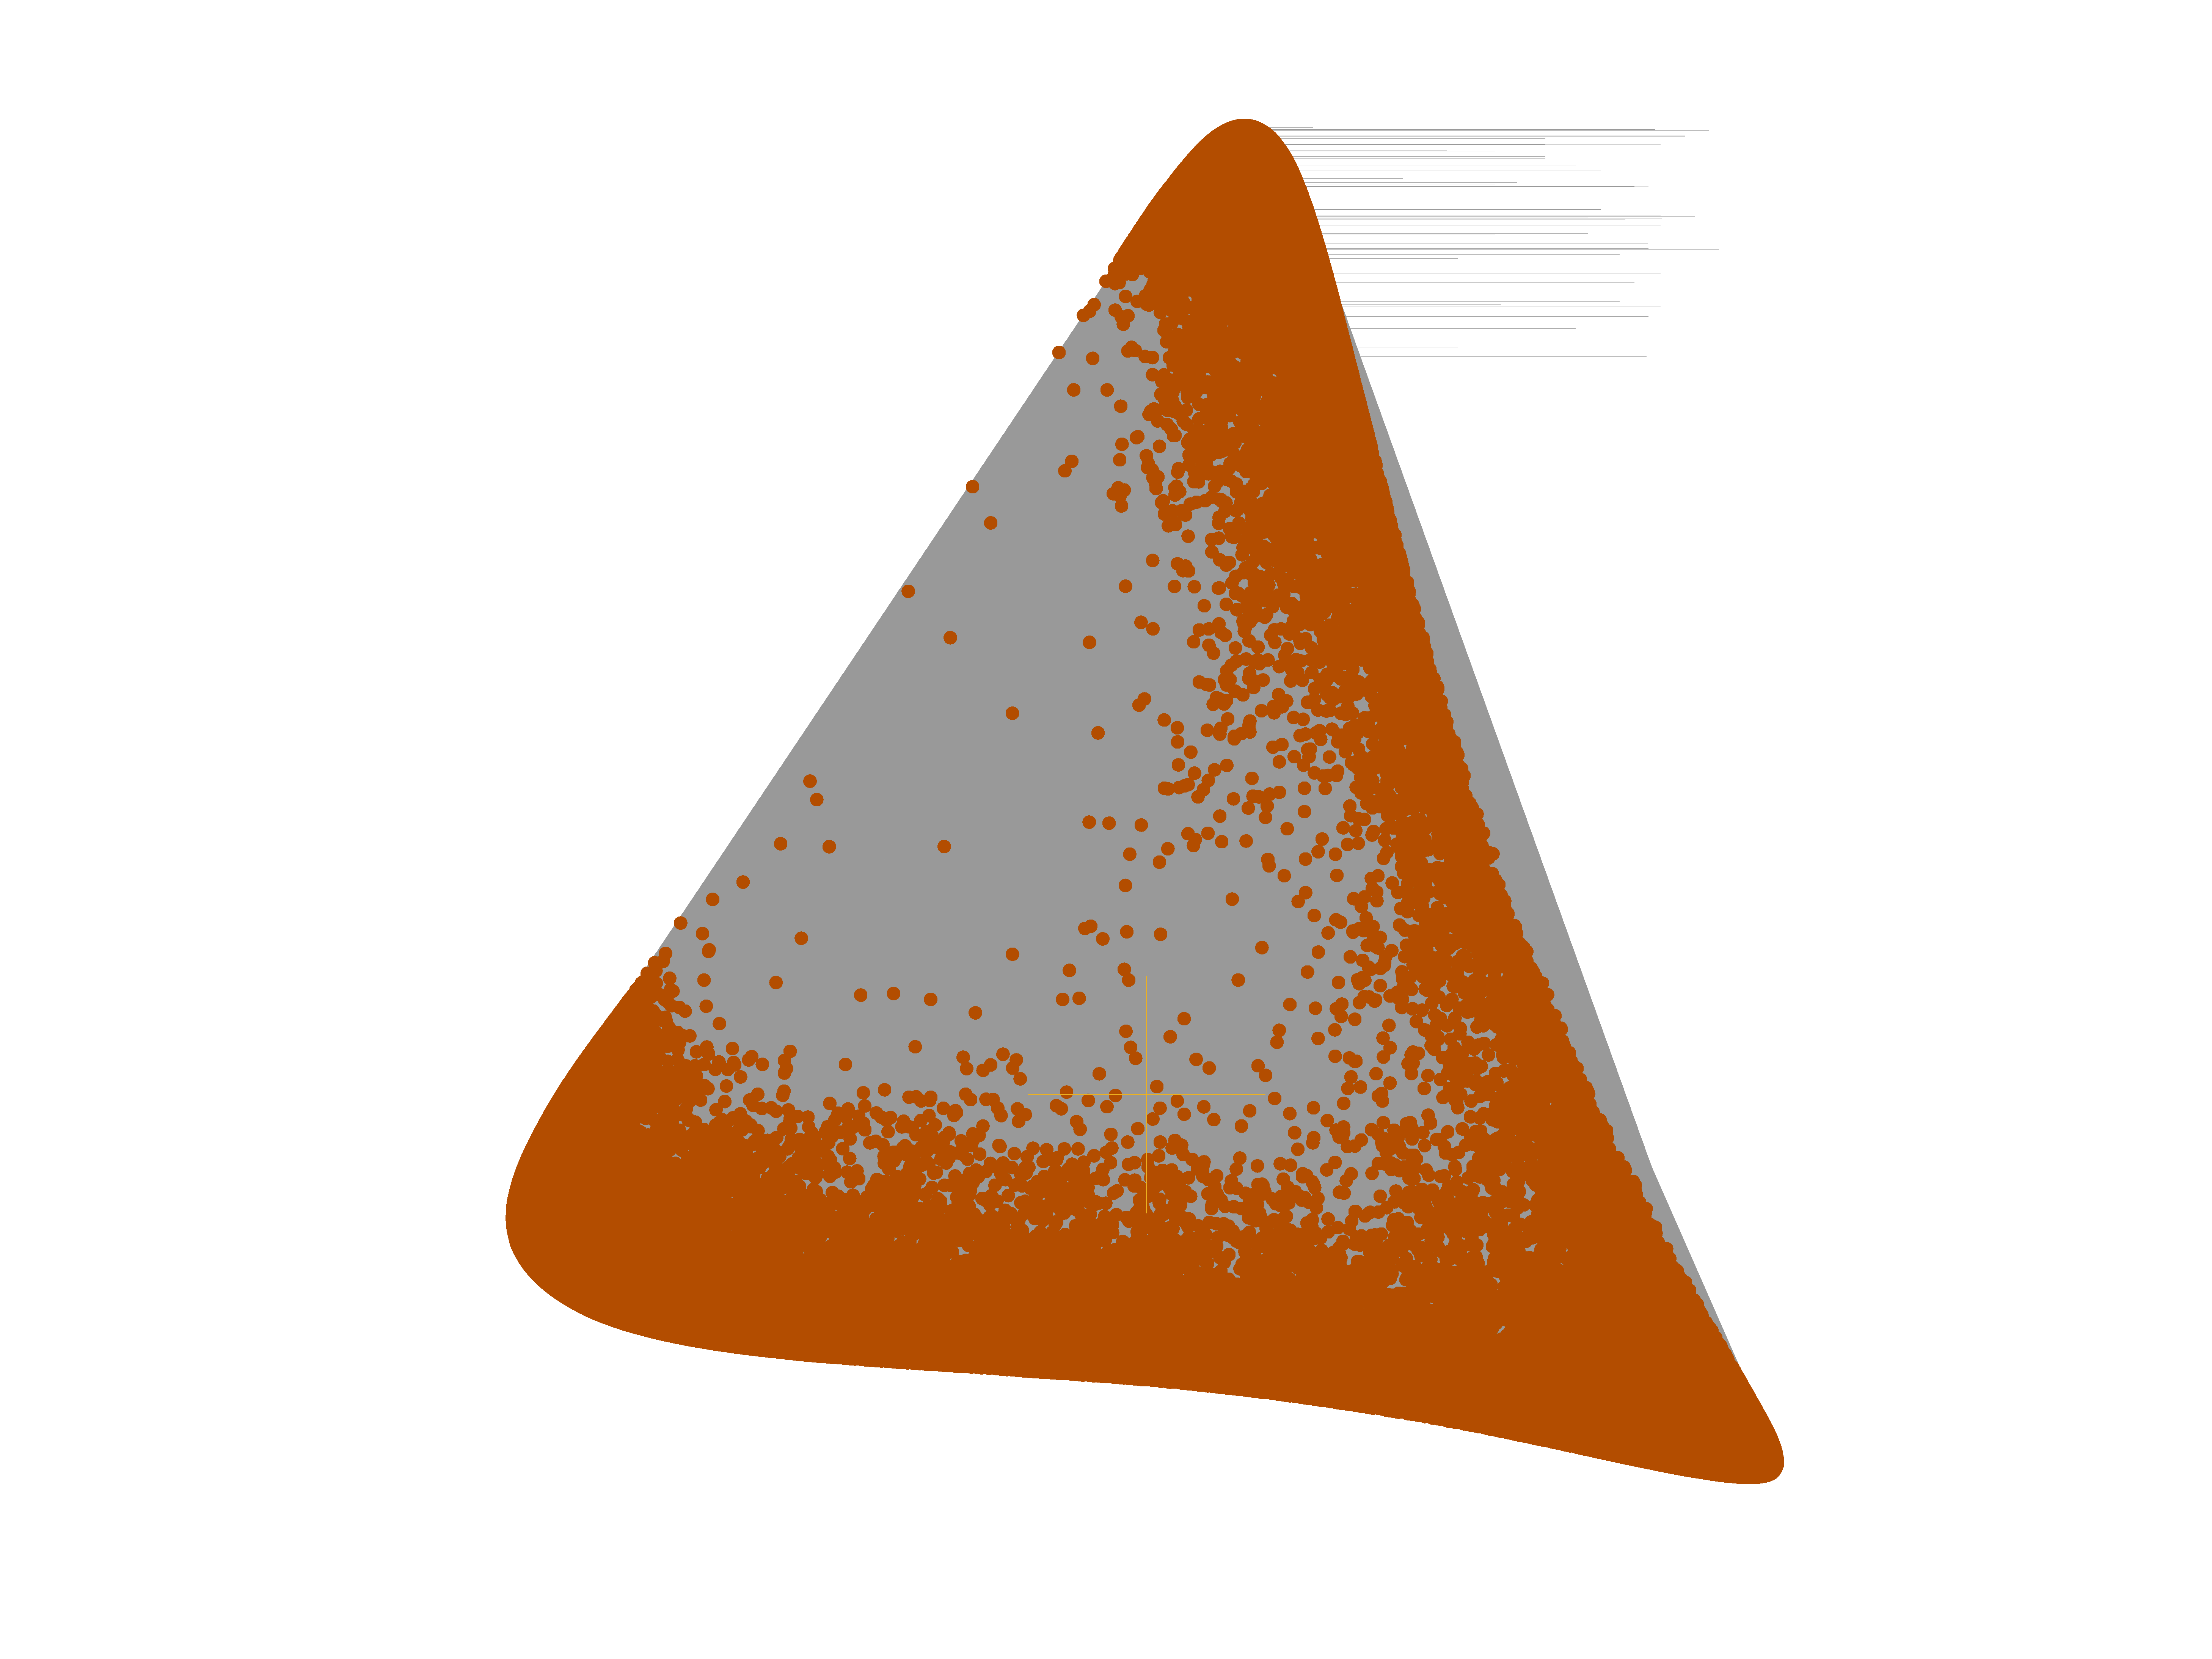
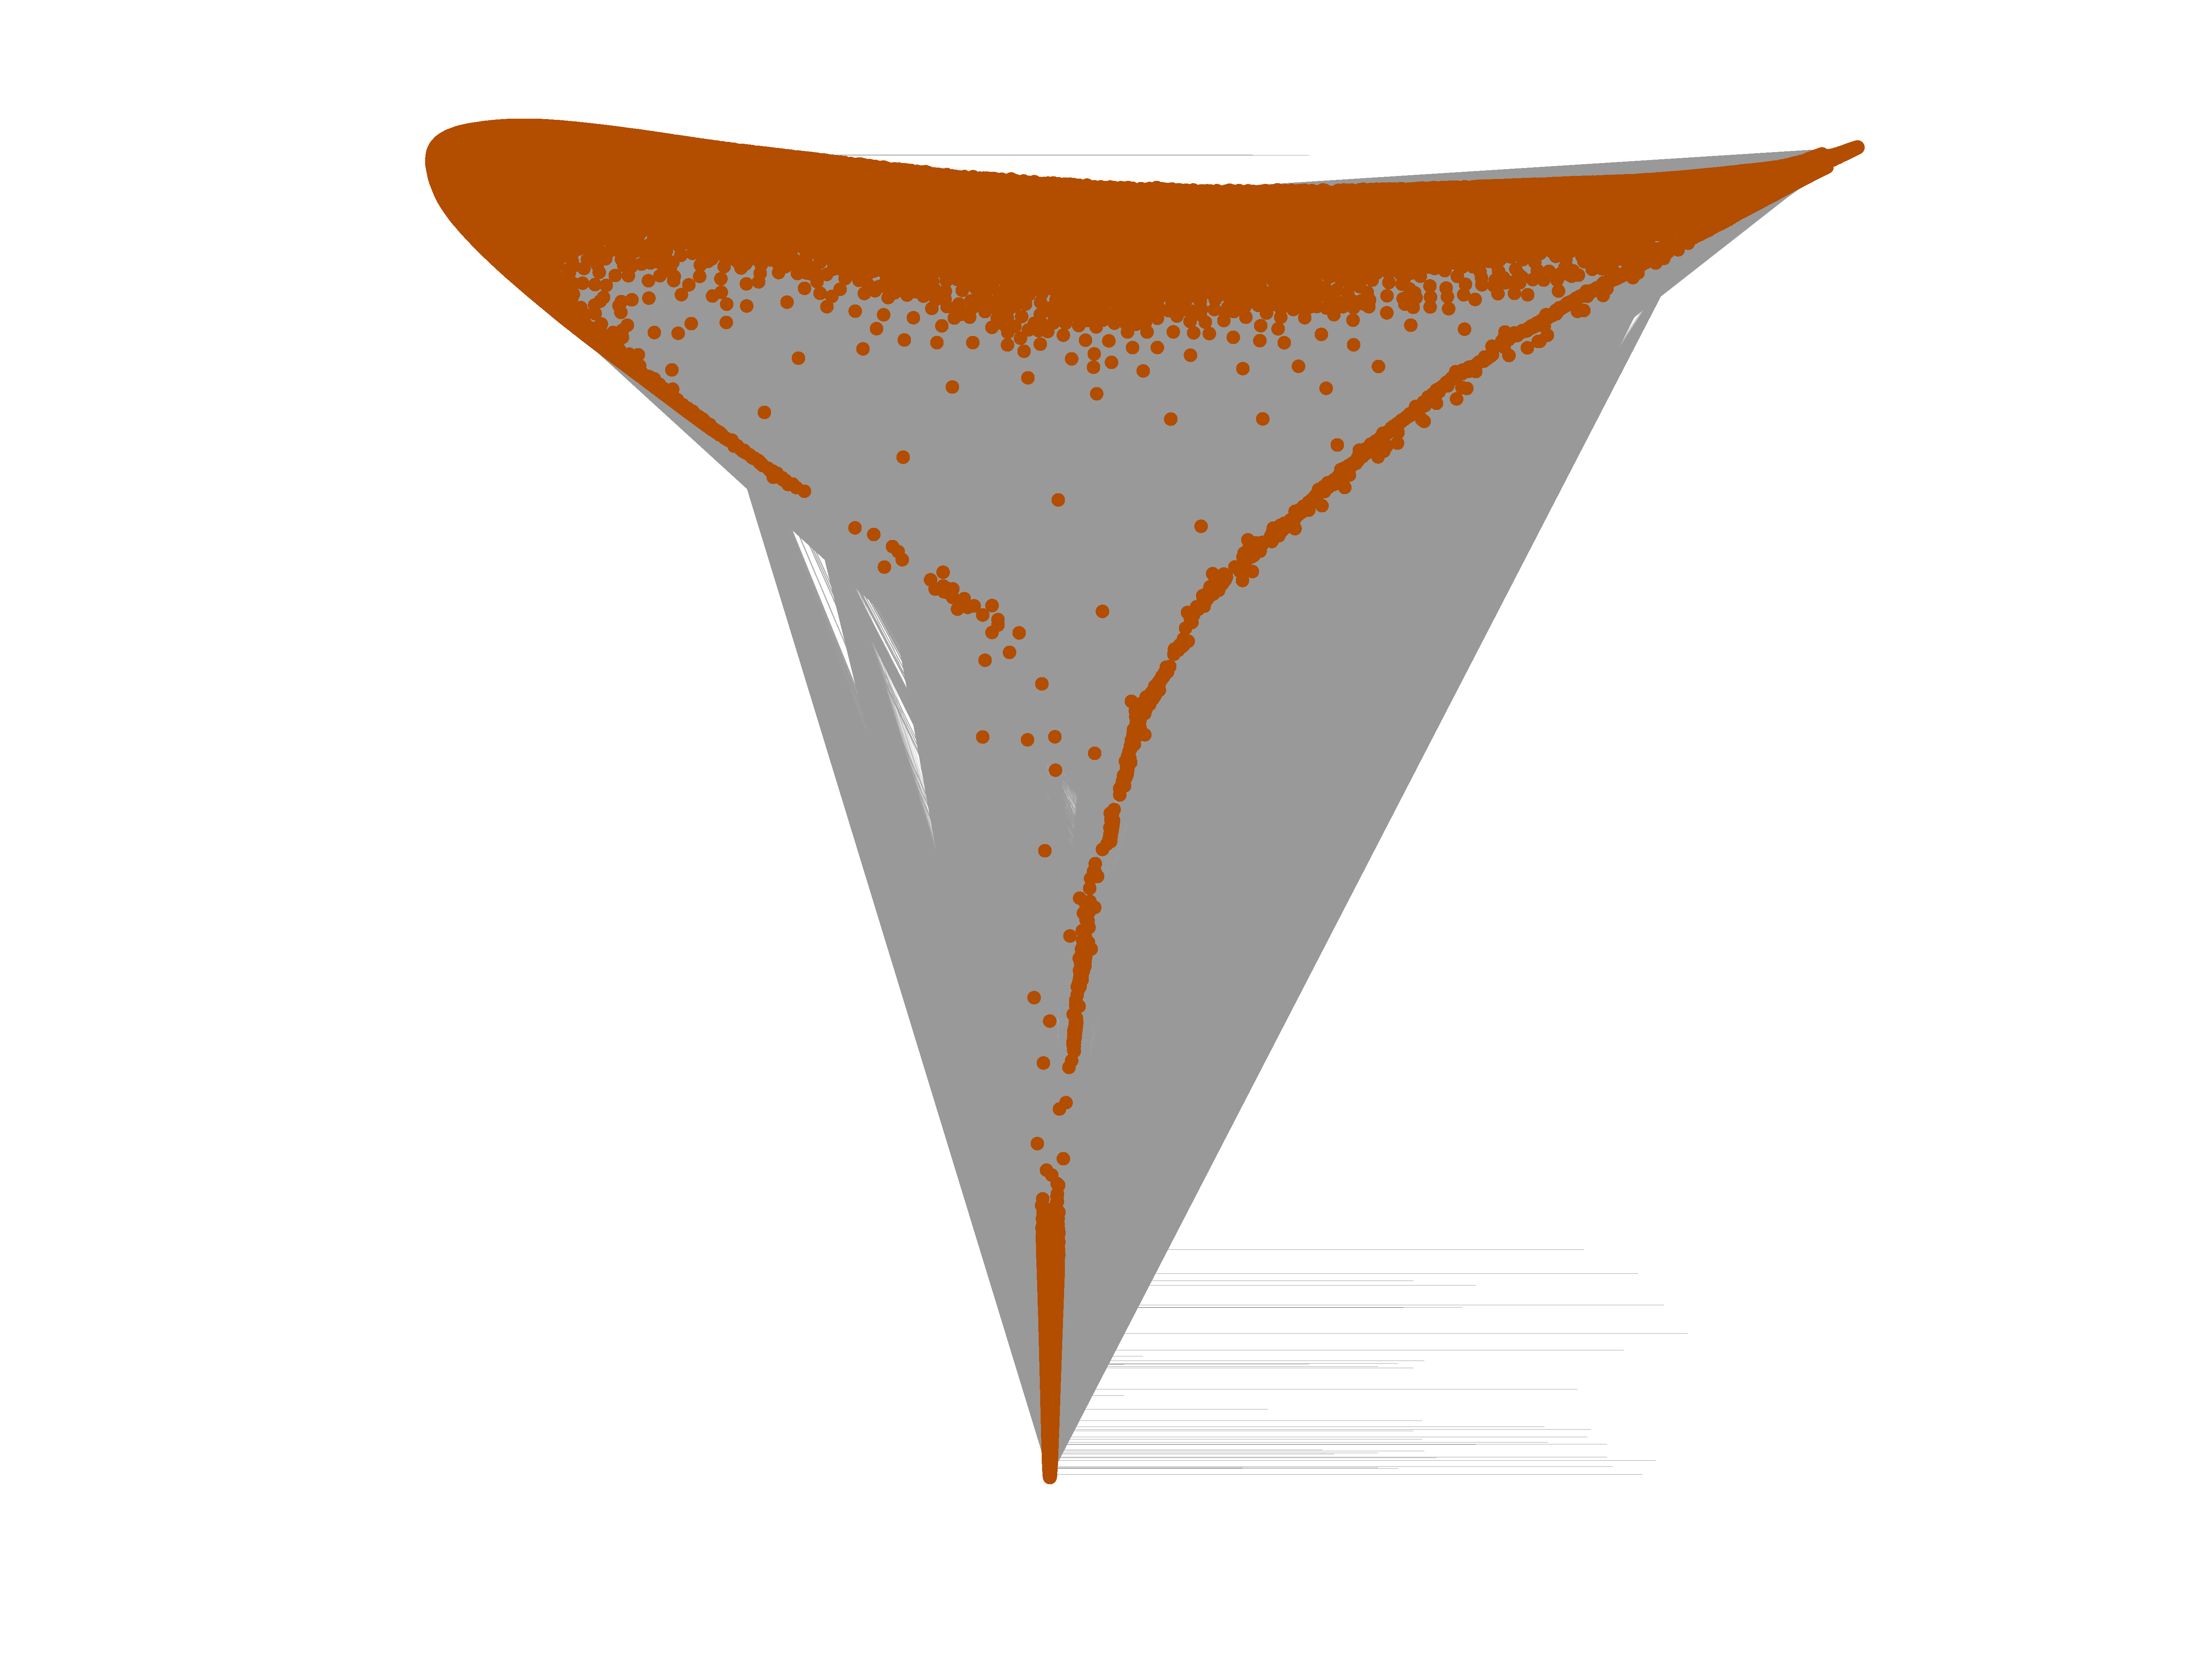
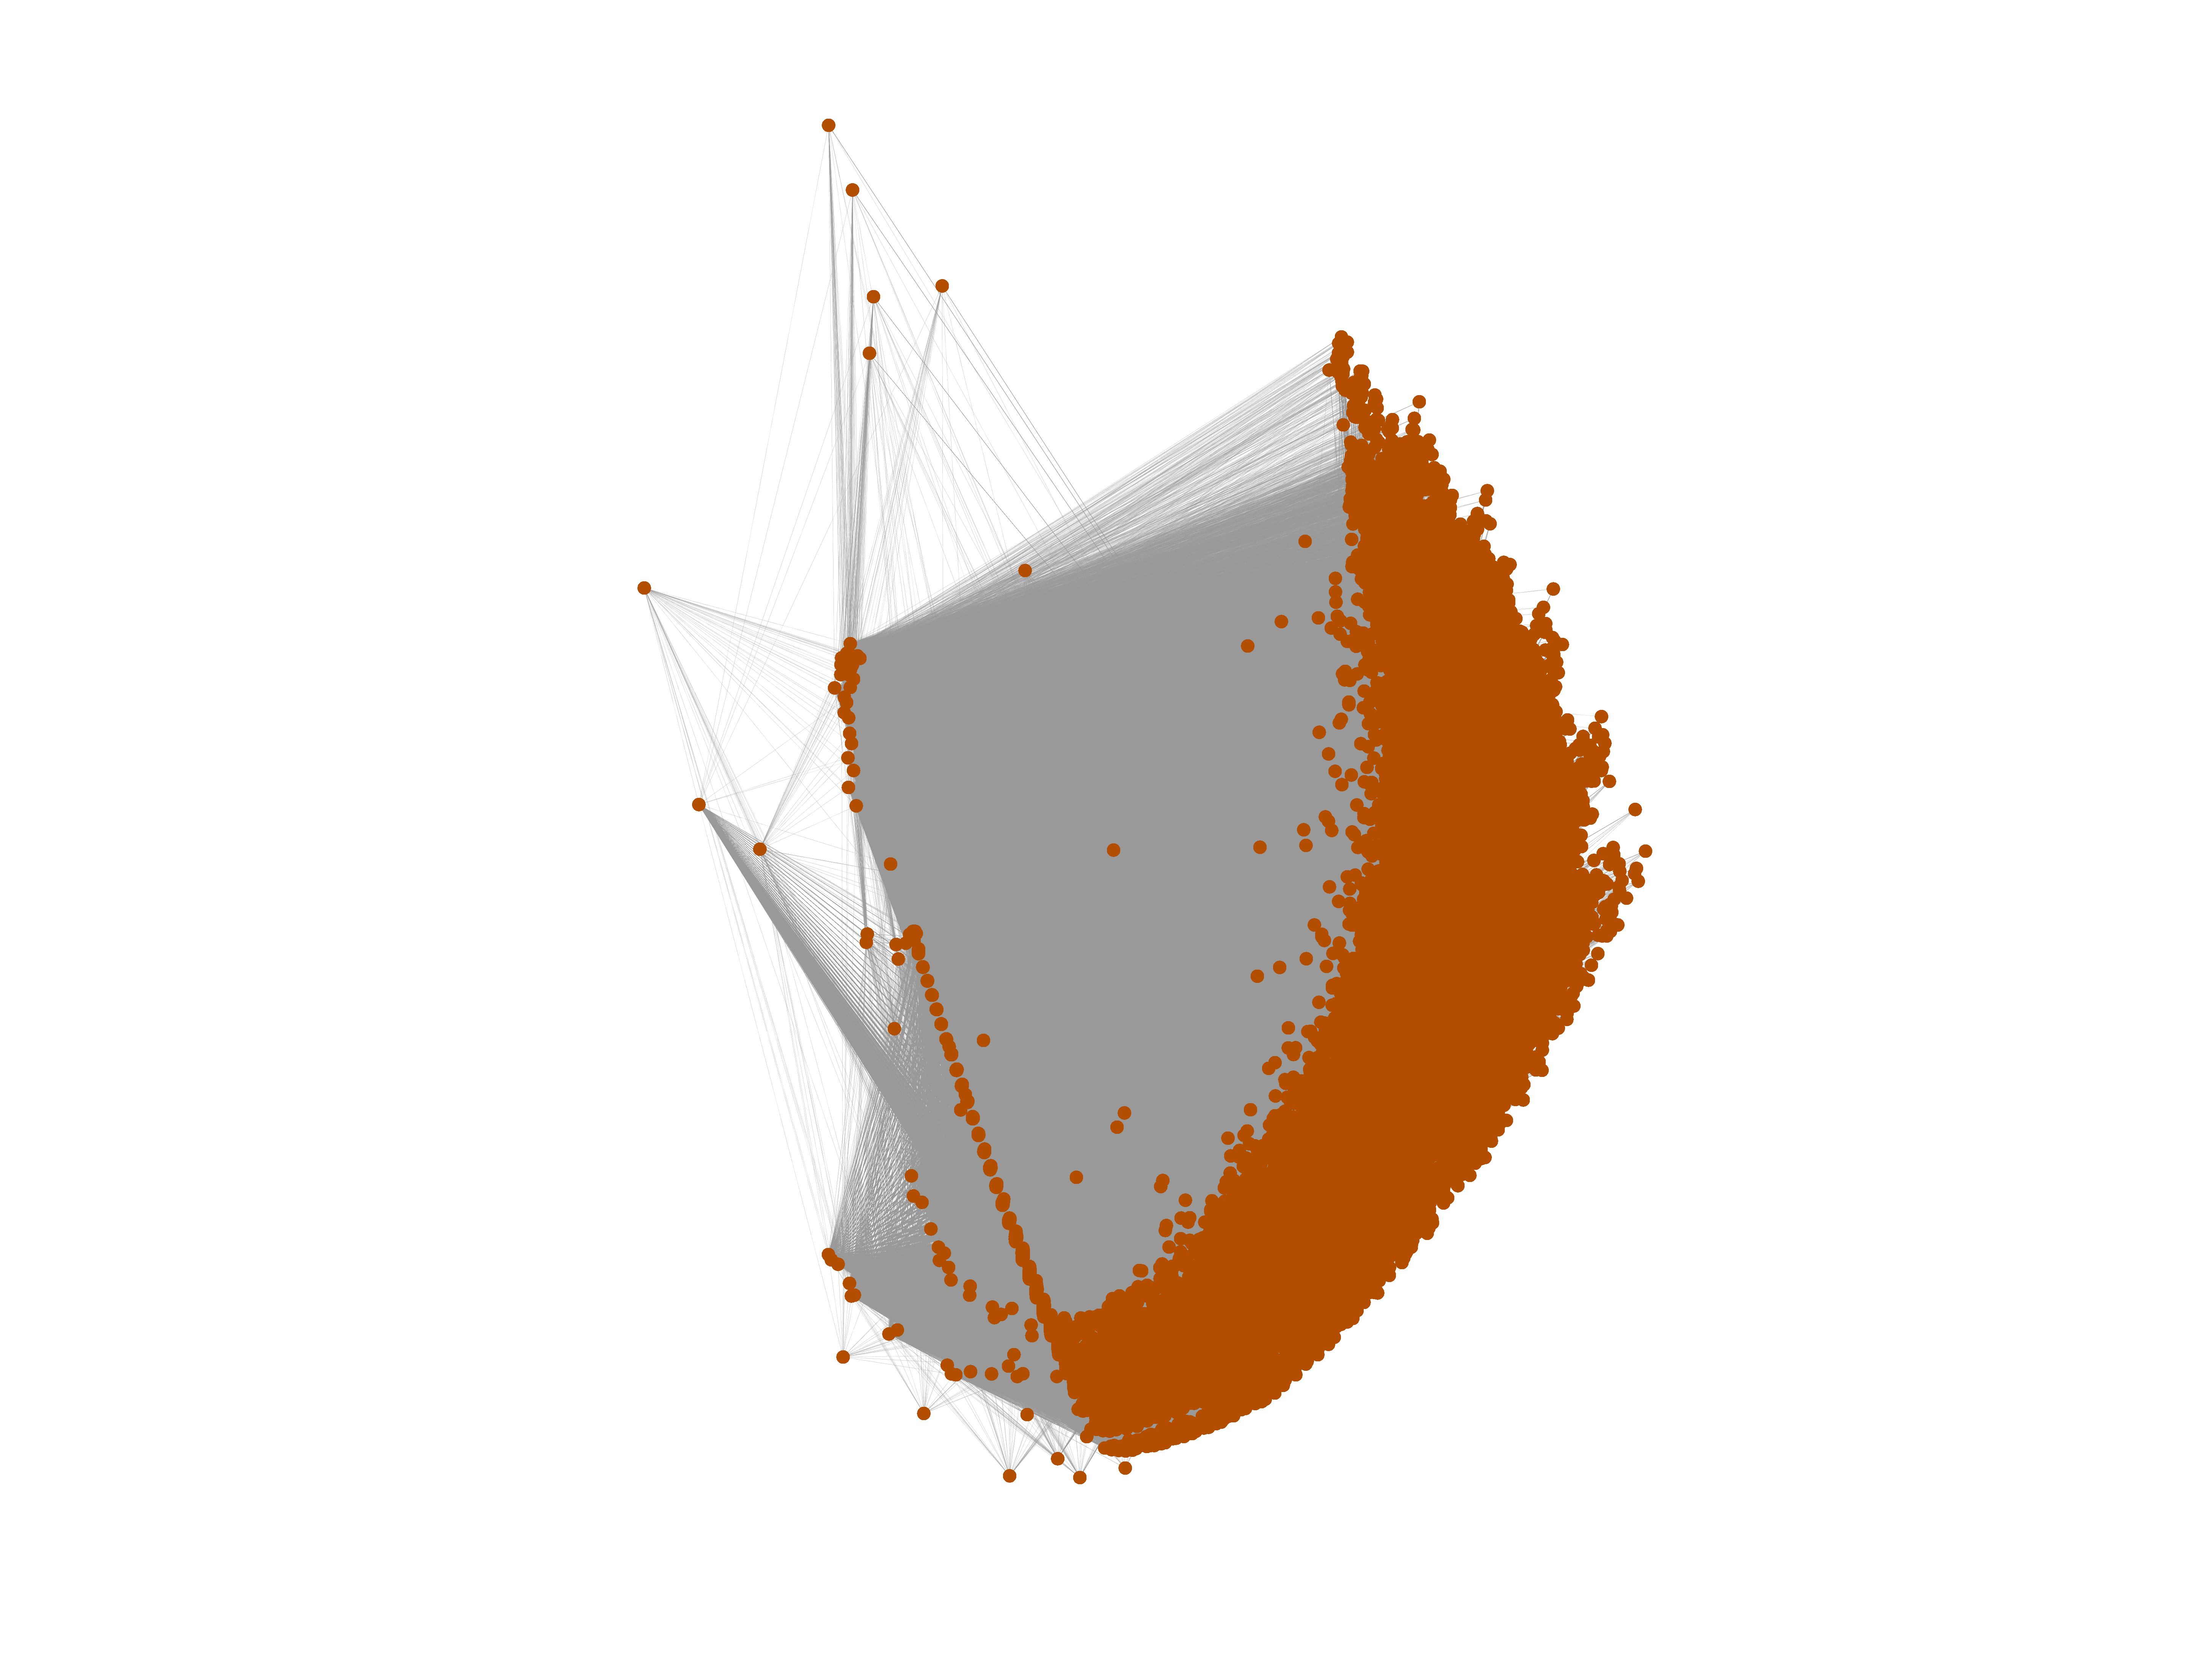
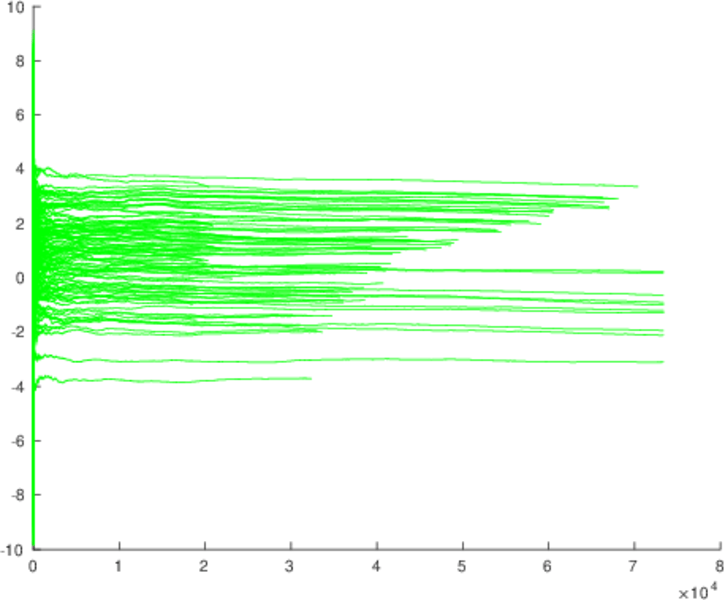
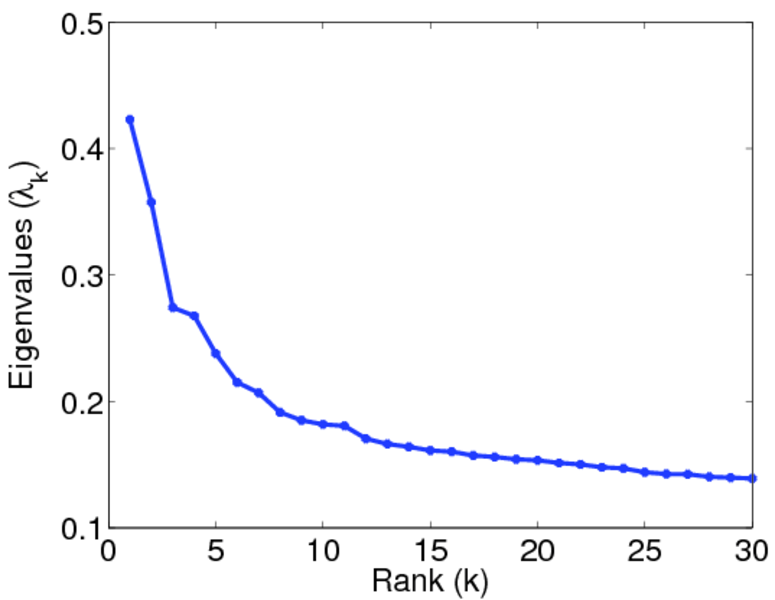
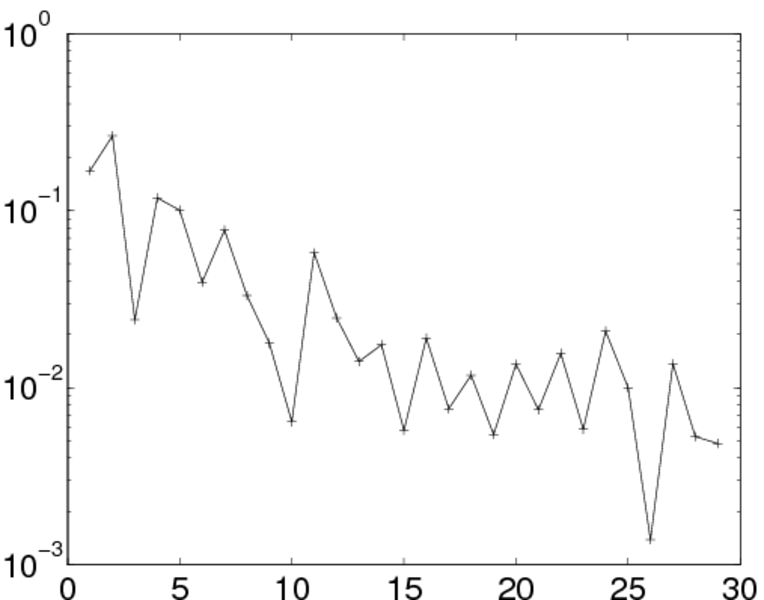
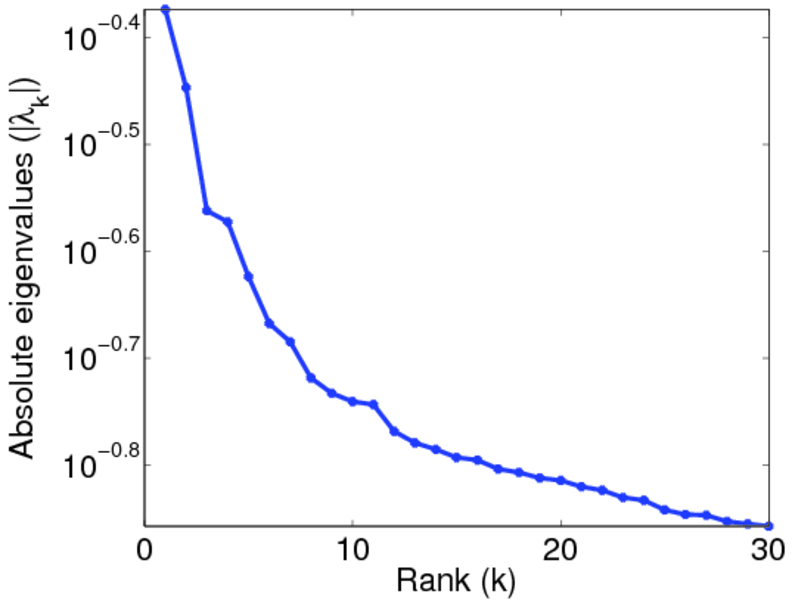
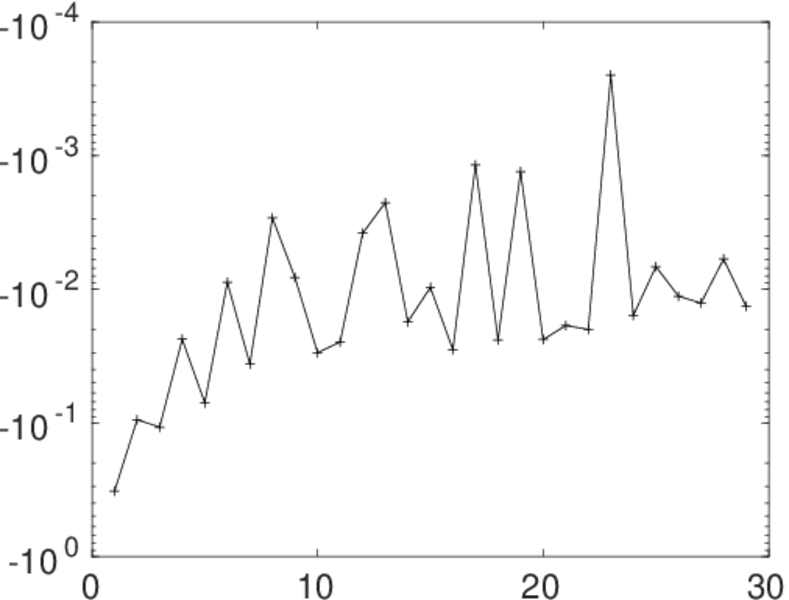
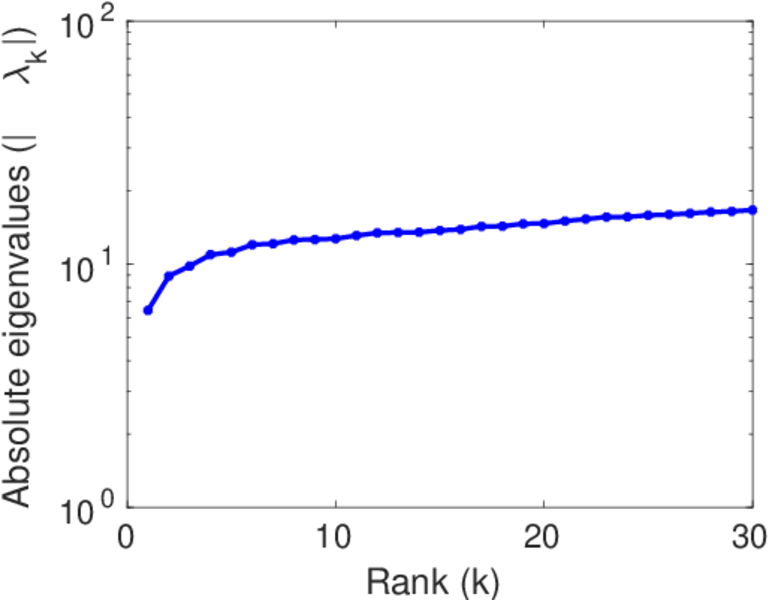
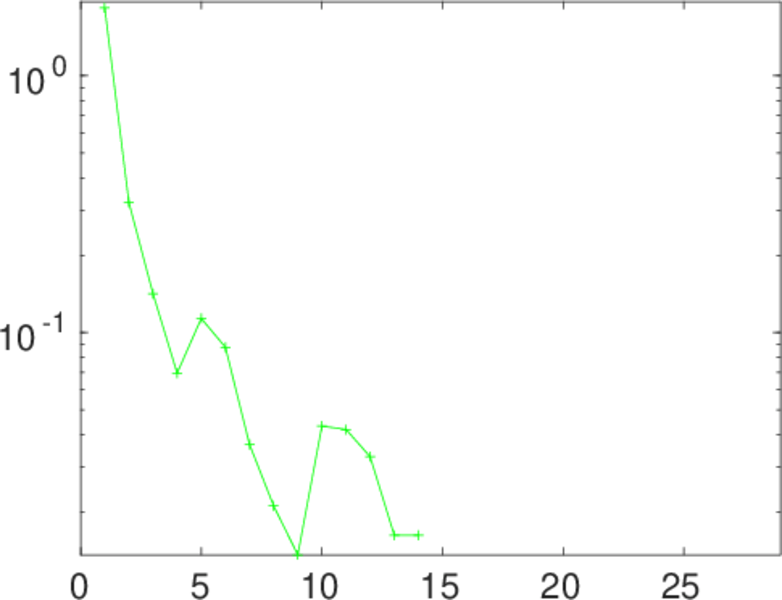
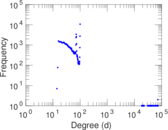
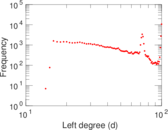
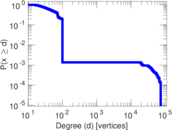
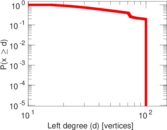
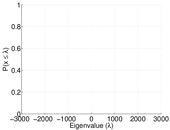
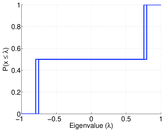
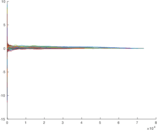
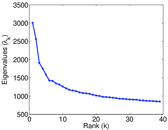
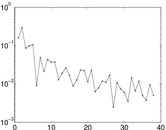
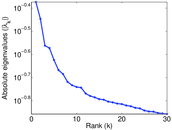
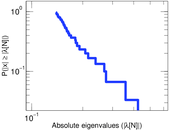
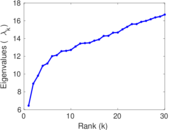
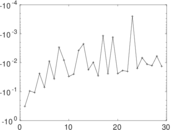
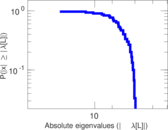
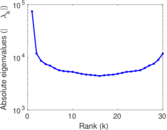
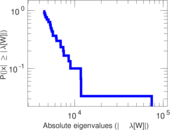
Plots


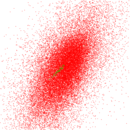
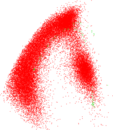


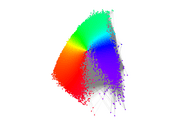
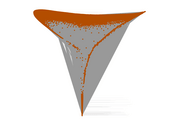

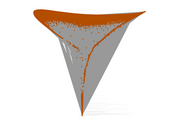


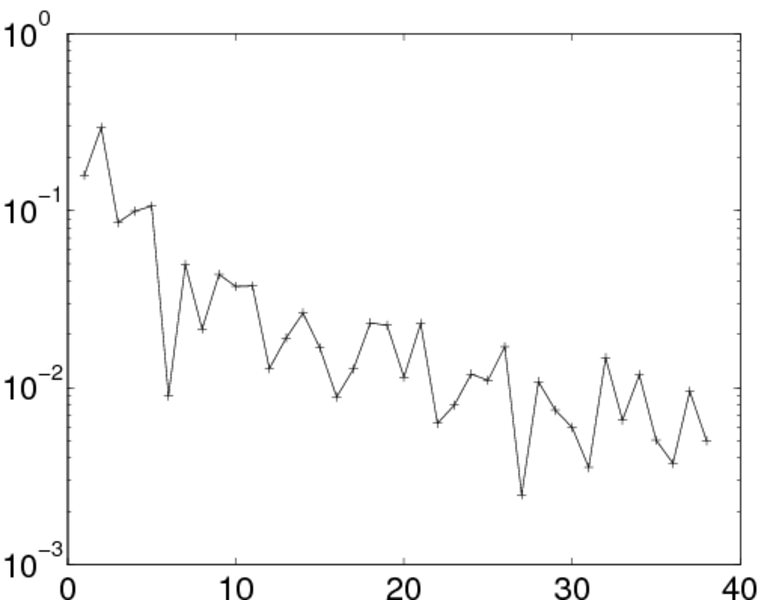
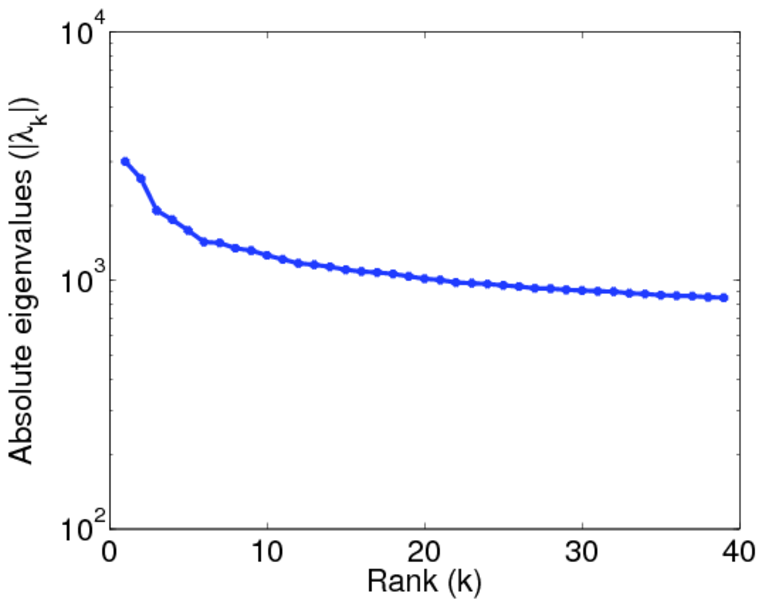
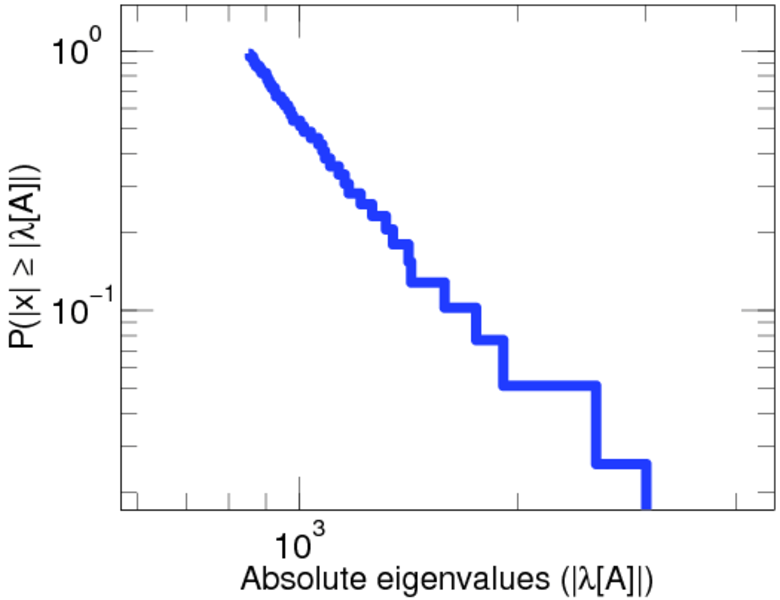
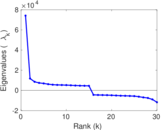
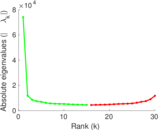
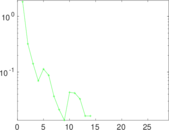
Matrix decompositions plots
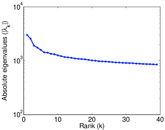

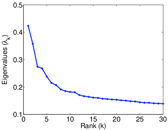


Downloads
References
|
[1]
|
Jérôme Kunegis.
KONECT – The Koblenz Network Collection.
In Proc. Int. Conf. on World Wide Web Companion, pages
1343–1350, 2013.
[ http ]
|
|
[2]
|
Ken Goldberg, Theresa Roeder, Dhruv Gupta, and Chris Perkins.
Eigentaste: A constant time collaborative filtering algorithm.
Inf. Retrieval, 4(2):133–151, 2001.
|
 KONECT ‣ Networks ‣
Buy Me a Coffee
KONECT ‣ Networks ‣
Buy Me a Coffee