Jester 150
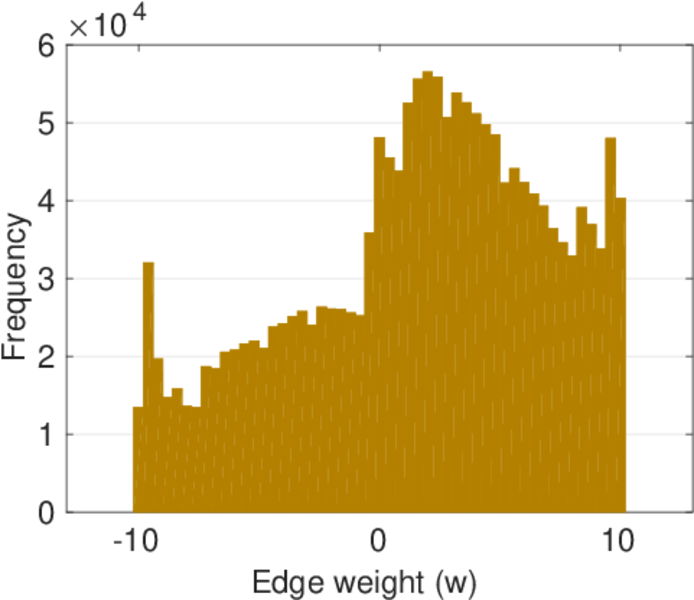
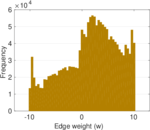
This weighted network contains information about how users rated a total amount
of 150 jokes. Not every user rated every joke. Rating values are continuous
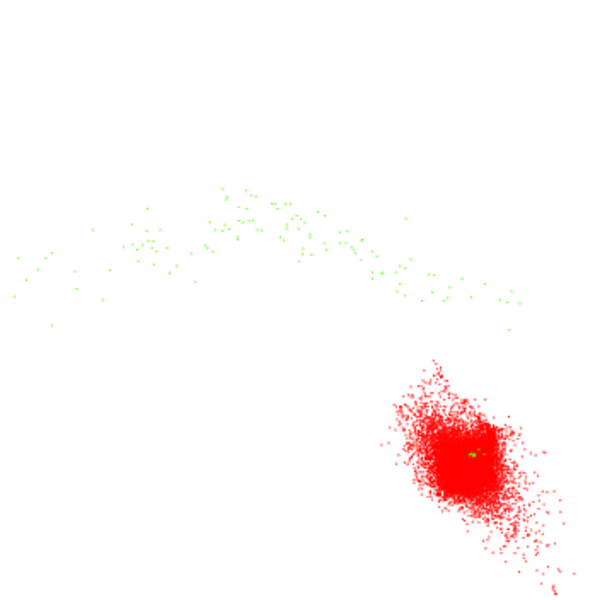
values between −10 and +10. An edge shows that a user has rated a joke. Left
nodes are users; right nodes are jokes.
Metadata
Statistics
| Size | n = | 50,832
|
| Left size | n1 = | 50,692
|
| Right size | n2 = | 140
|
| Volume | m = | 1,728,847
|
| Wedge count | s = | 19,185,429,458
|
| Claw count | z = | 220,017,686,996,709
|
| Cross count | x = | 2,405,341,029,254,686,208
|
| Square count | q = | 266,934,299,745
|
| 4-Tour count | T4 = | 2,212,223,162,138
|
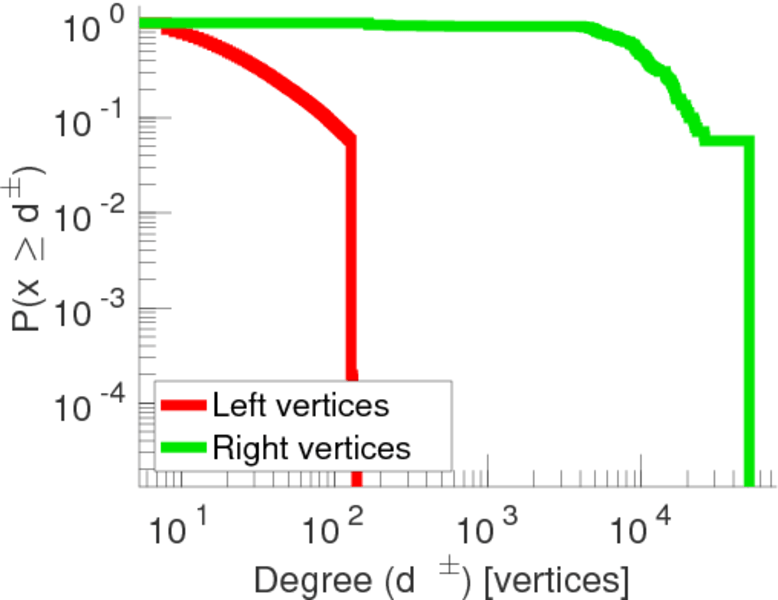
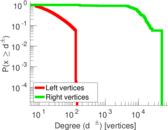
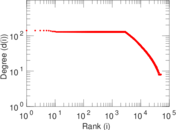
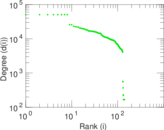
| Maximum degree | dmax = | 50,692
|
| Maximum left degree | d1max = | 140
|
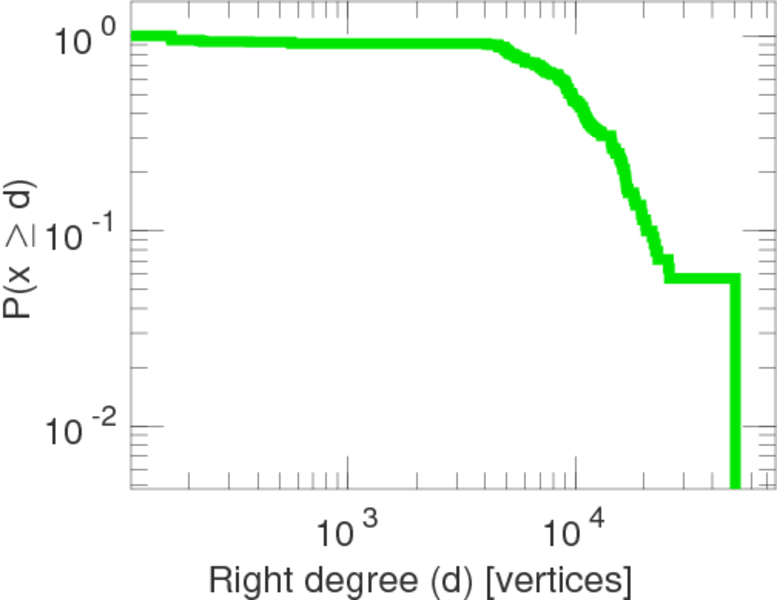
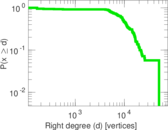
| Maximum right degree | d2max = | 50,692
|
| Average degree | d = | 68.022 0
|
| Average left degree | d1 = | 34.104 9
|
| Average right degree | d2 = | 12,348.9
|
| Fill | p = | 0.243 607
|
| Size of LCC | N = | 50,832
|
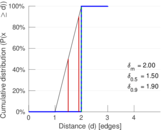
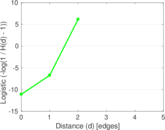
| Diameter | δ = | 3
|
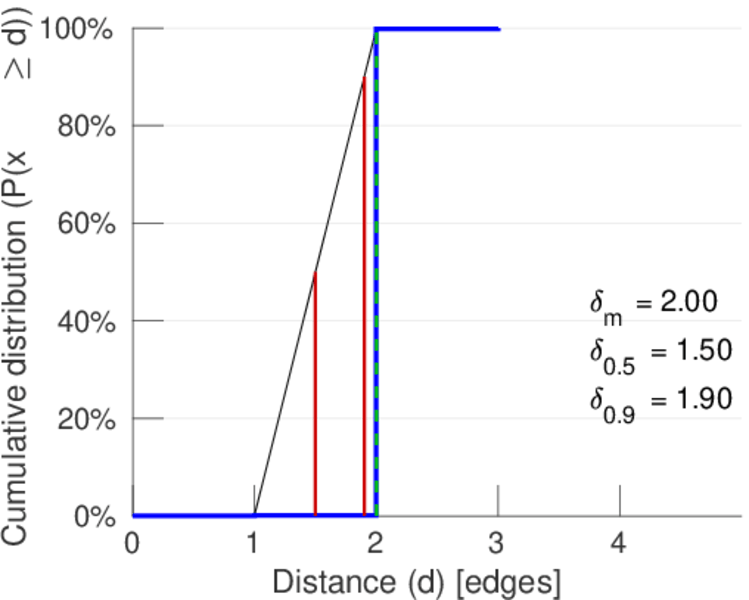
| 50-Percentile effective diameter | δ0.5 = | 1.500 45
|
| 90-Percentile effective diameter | δ0.9 = | 1.901 77
|
| Median distance | δM = | 2
|
| Mean distance | δm = | 2.000 89
|
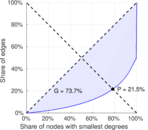
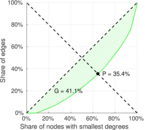
| Gini coefficient | G = | 0.737 569
|
| Balanced inequality ratio | P = | 0.214 431
|
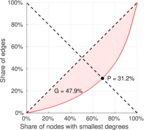
| Left balanced inequality ratio | P1 = | 0.312 166
|
| Right balanced inequality ratio | P2 = | 0.354 322
|
| Relative edge distribution entropy | Her = | 0.759 472
|
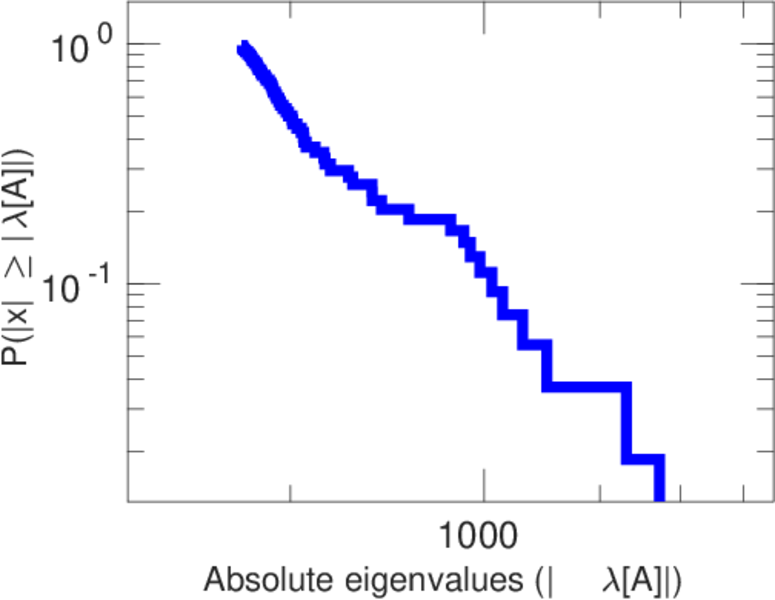
| Tail power law exponent | γt = | 1.881 00
|
| Tail power law exponent with p | γ3 = | 1.881 00
|
| p-value | p = | 0.000 00
|
| Left tail power law exponent with p | γ3,1 = | 1.891 00
|
| Left p-value | p1 = | 0.000 00
|
| Right tail power law exponent with p | γ3,2 = | 8.341 00
|
| Right p-value | p2 = | 0.000 00
|
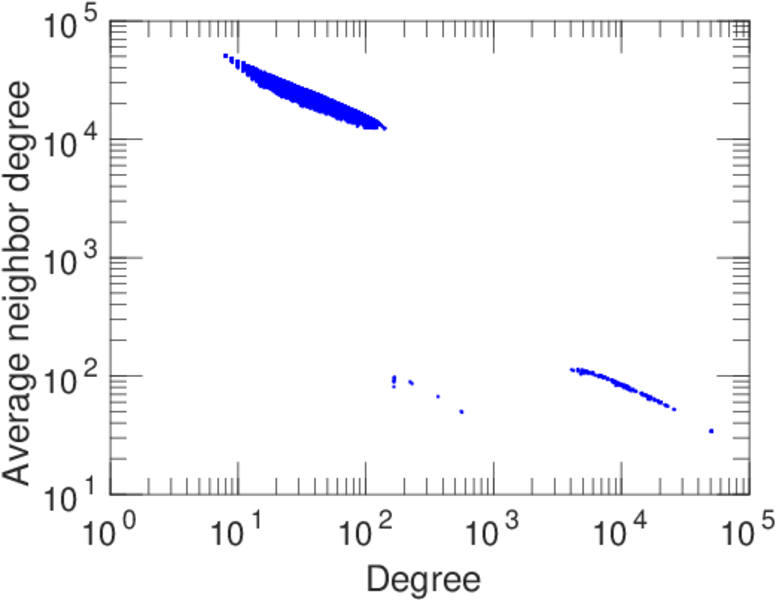
| Degree assortativity | ρ = | −0.492 637
|
| Degree assortativity p-value | pρ = | 0.000 00
|
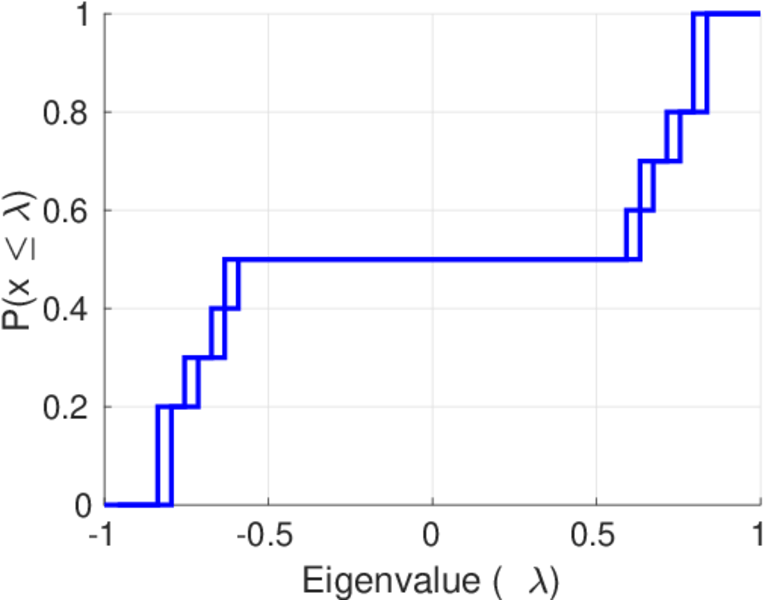
| Spectral norm | α = | 1,863.19
|
| Algebraic connectivity | a = | 2.215 21
|
| Spectral separation | |λ1[A] / λ2[A]| = | 1.123 42
|
| Negativity | ζ = | 0.445 897
|
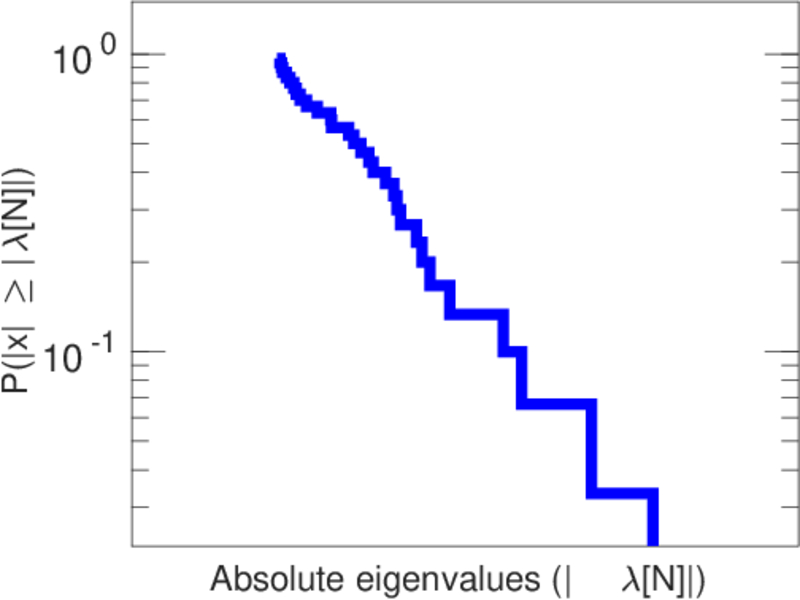
| Algebraic conflict | ξ = | 7.650 34
|
| Spectral signed frustration | φ = | 0.028 117 1
|
| Controllability | C = | 50,552
|
| Relative controllability | Cr = | 0.994 492
|
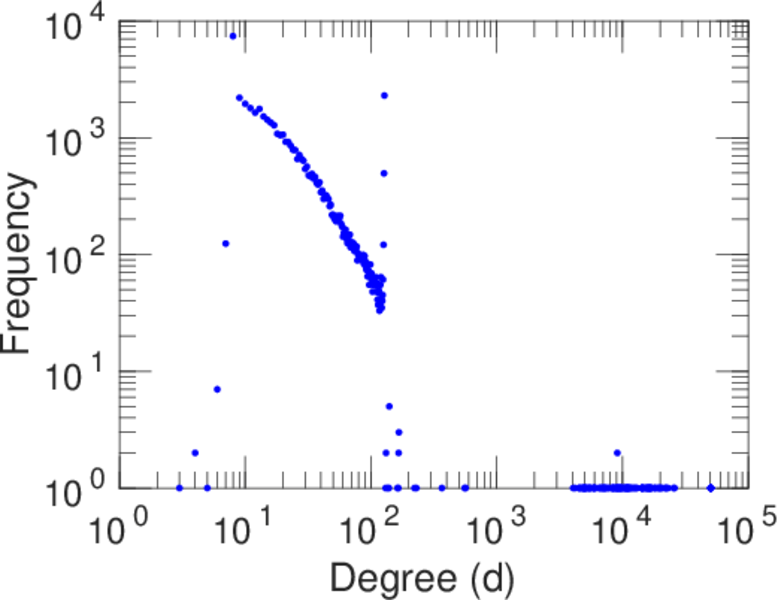
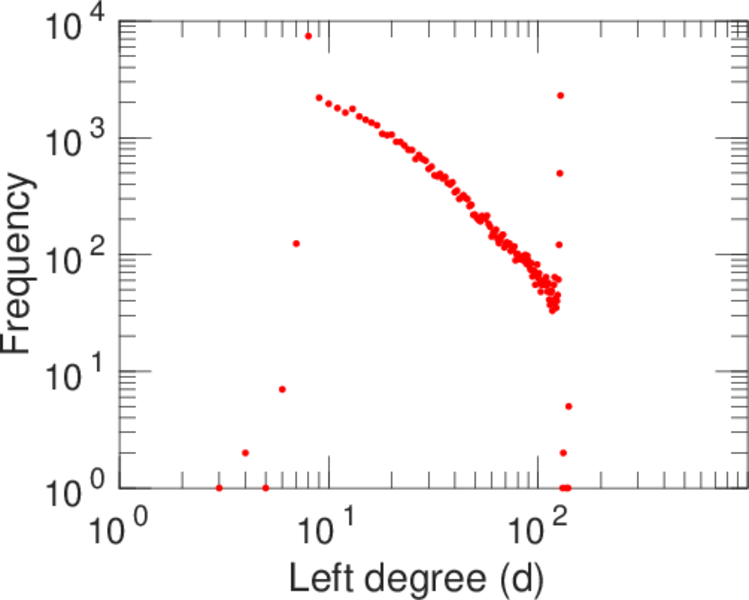
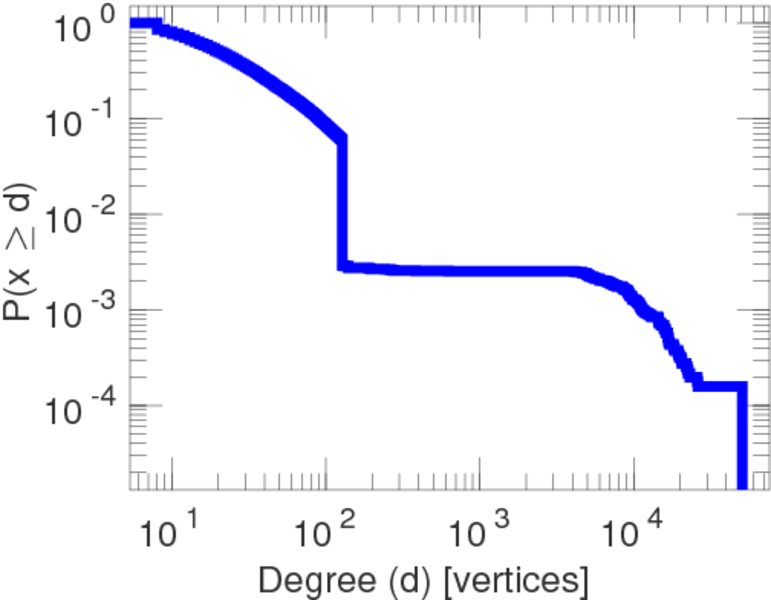
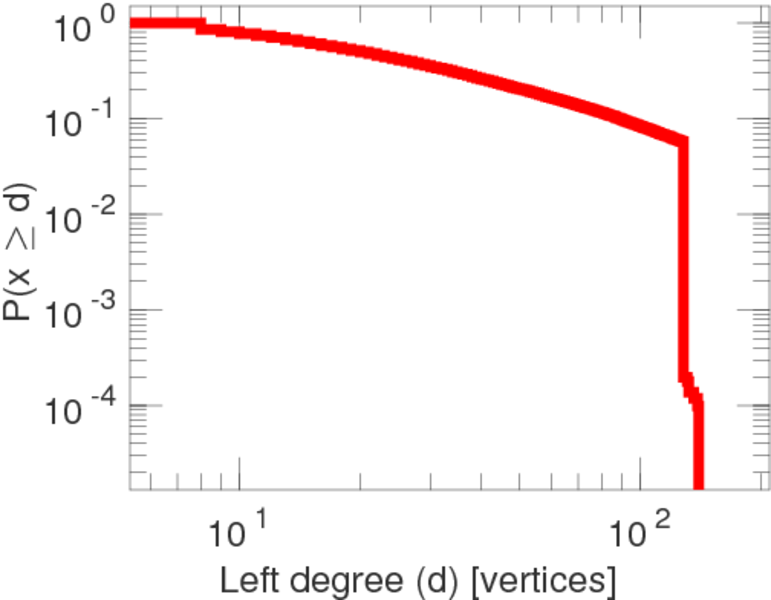
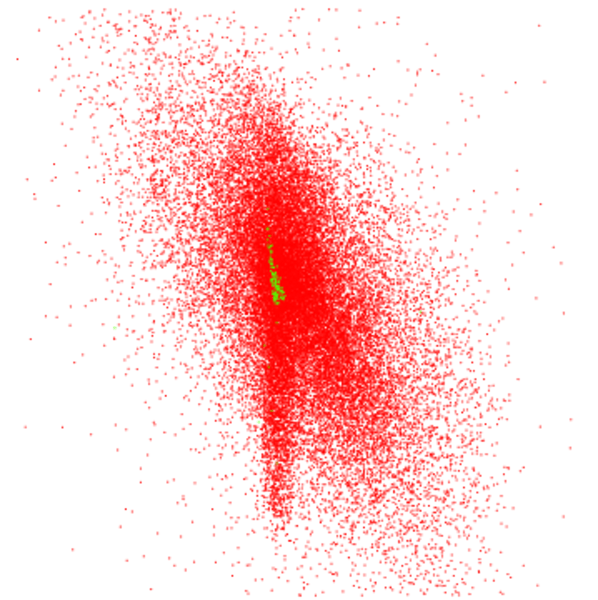
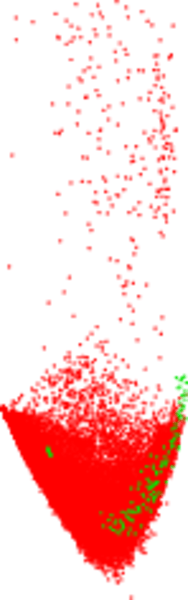
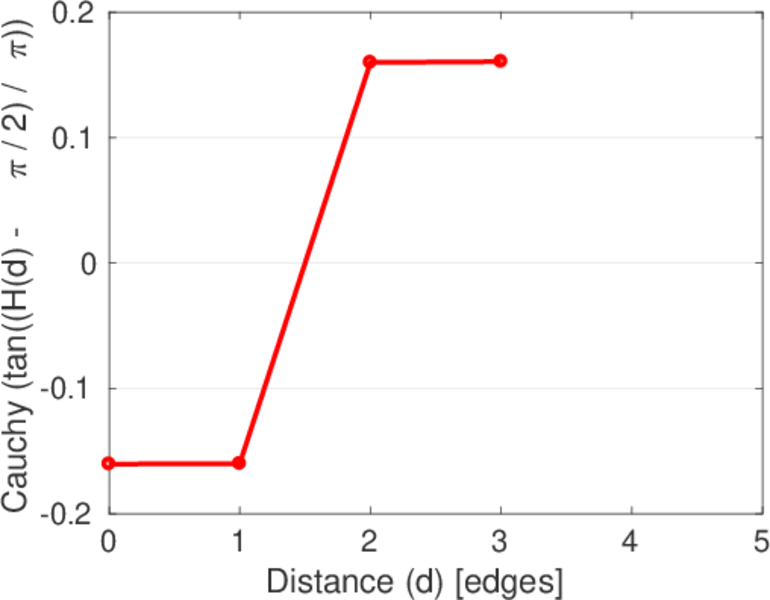
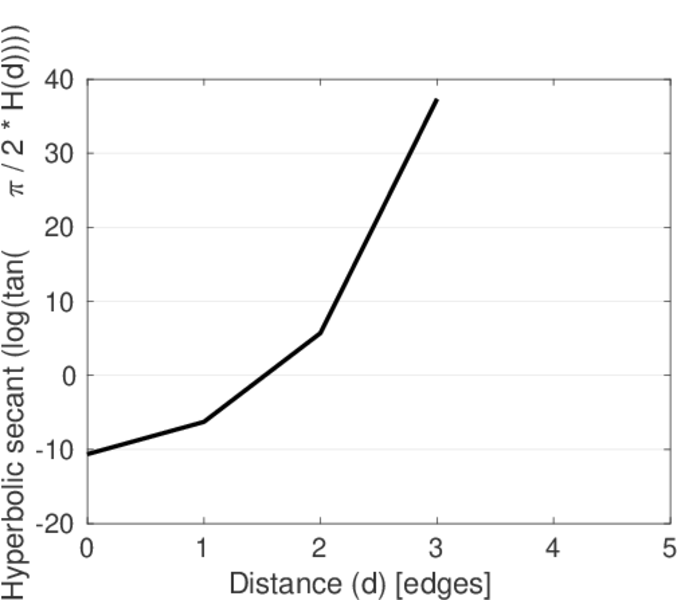
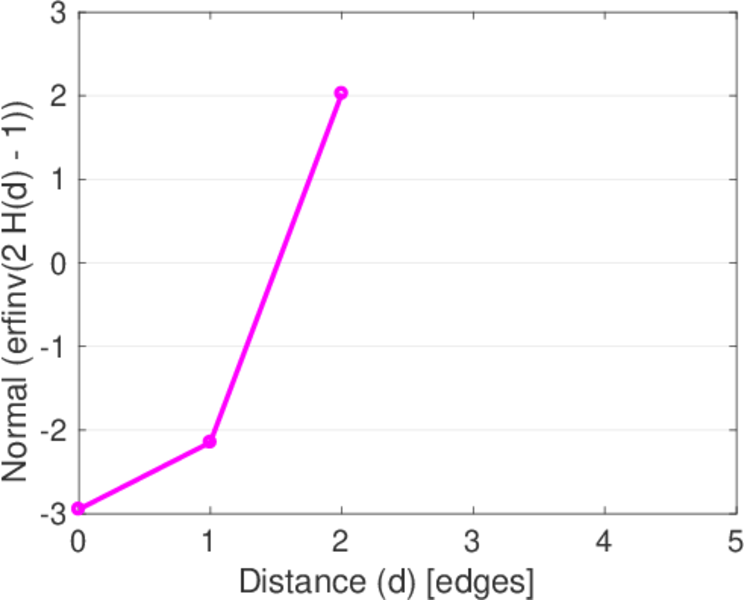
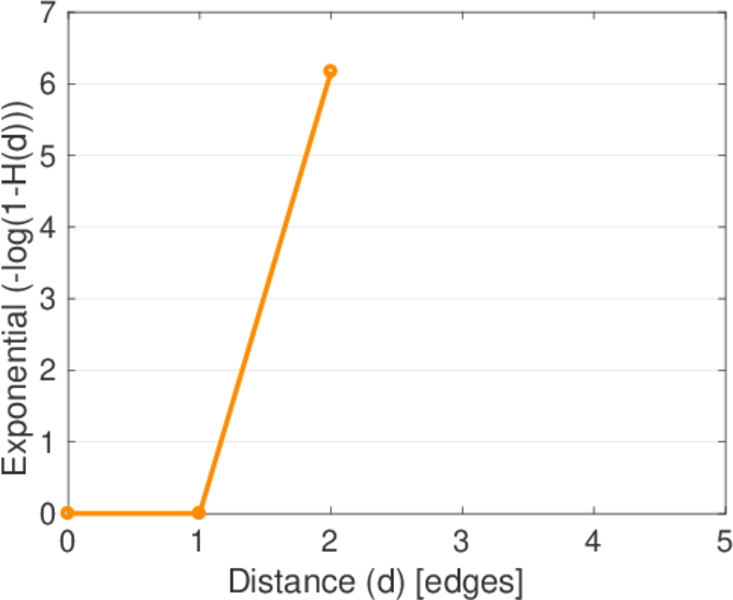
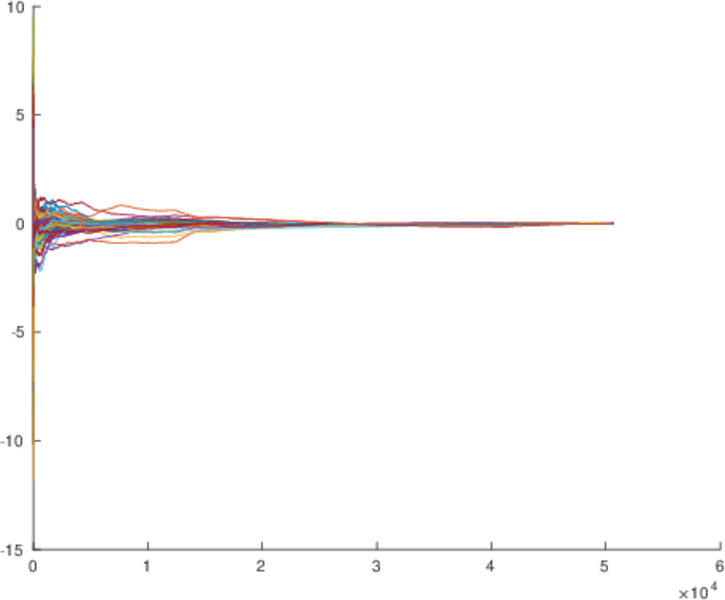
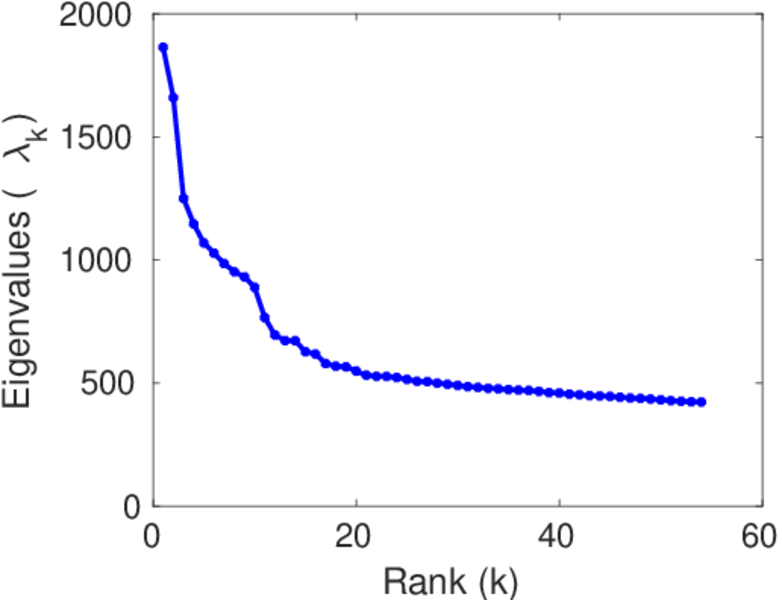
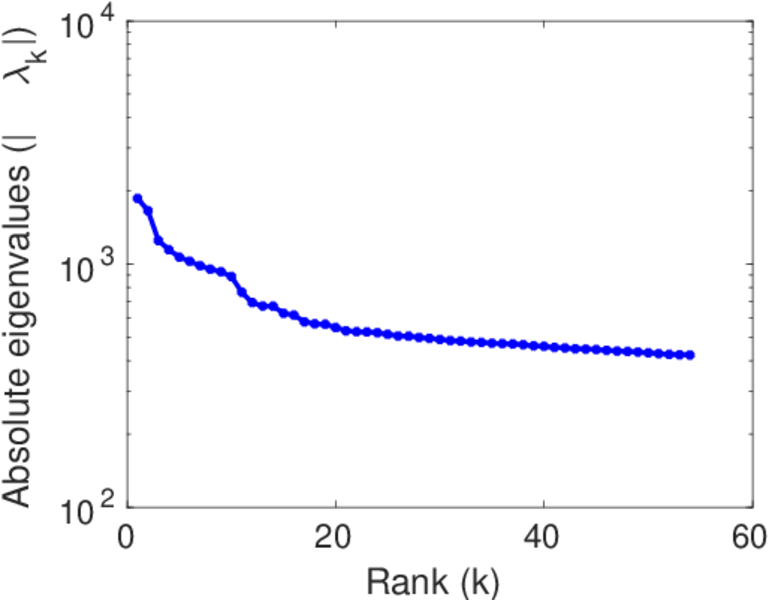
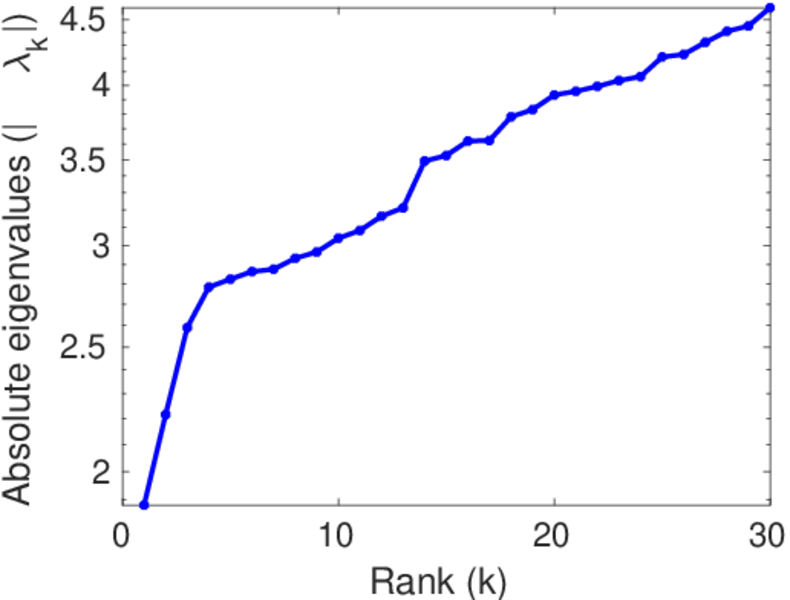
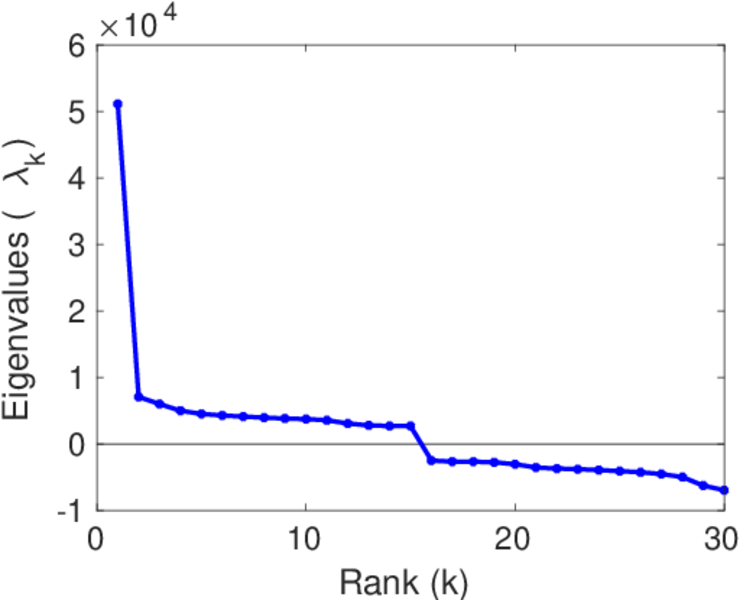
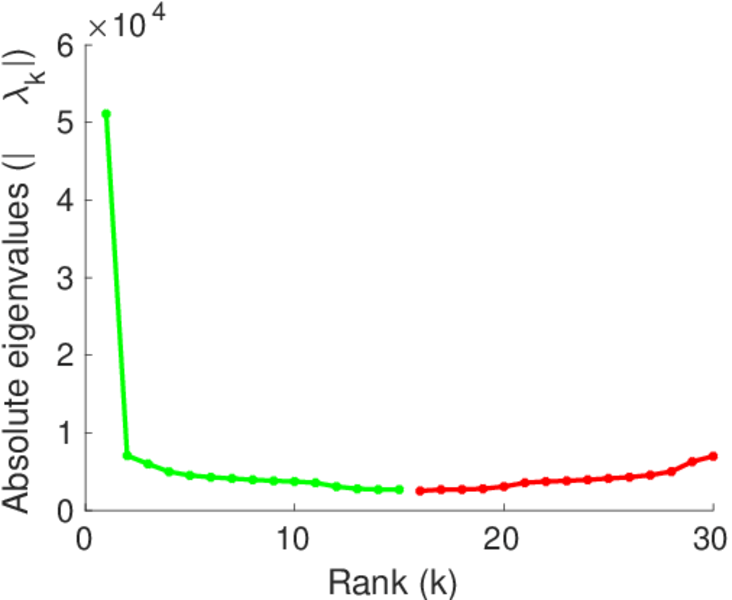
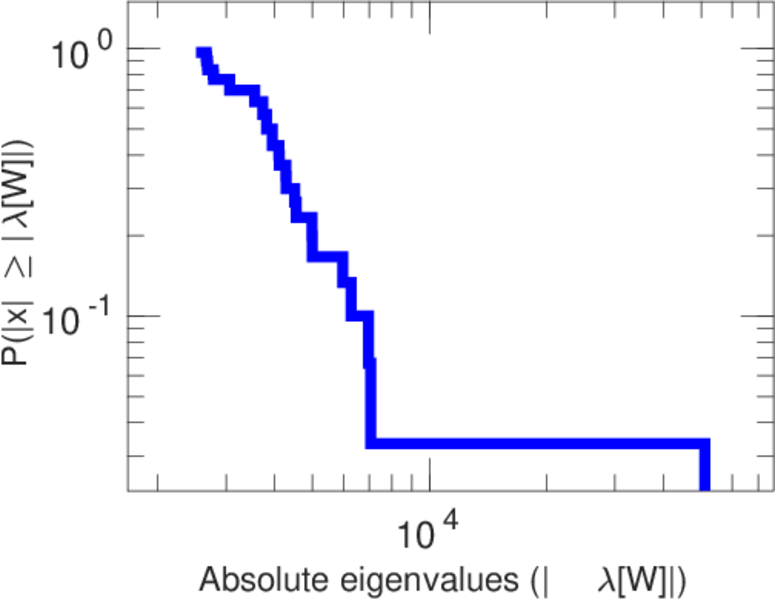
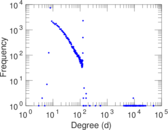
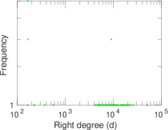
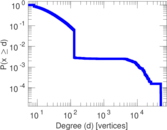
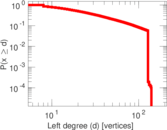
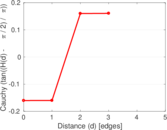
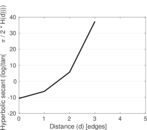
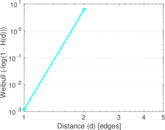
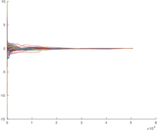
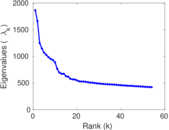
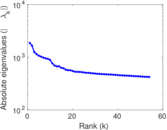
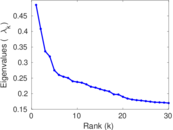
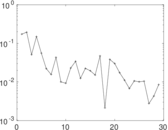
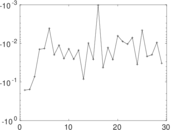
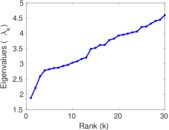
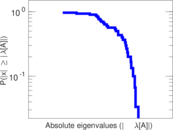
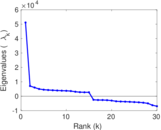
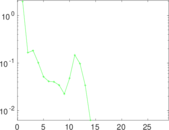
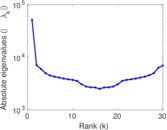
Plots


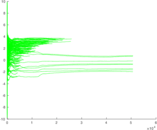
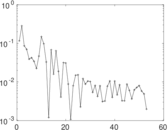
Matrix decompositions plots


Downloads
References
|
[1]
|
Jérôme Kunegis.
KONECT – The Koblenz Network Collection.
In Proc. Int. Conf. on World Wide Web Companion, pages
1343–1350, 2013.
[ http ]
|
|
[2]
|
Ken Goldberg, Theresa Roeder, Dhruv Gupta, and Chris Perkins.
Eigentaste: A constant time collaborative filtering algorithm.
Inf. Retrieval, 4(2):133–151, 2001.
|
 KONECT ‣ Networks ‣
Buy Me a Coffee
KONECT ‣ Networks ‣
Buy Me a Coffee