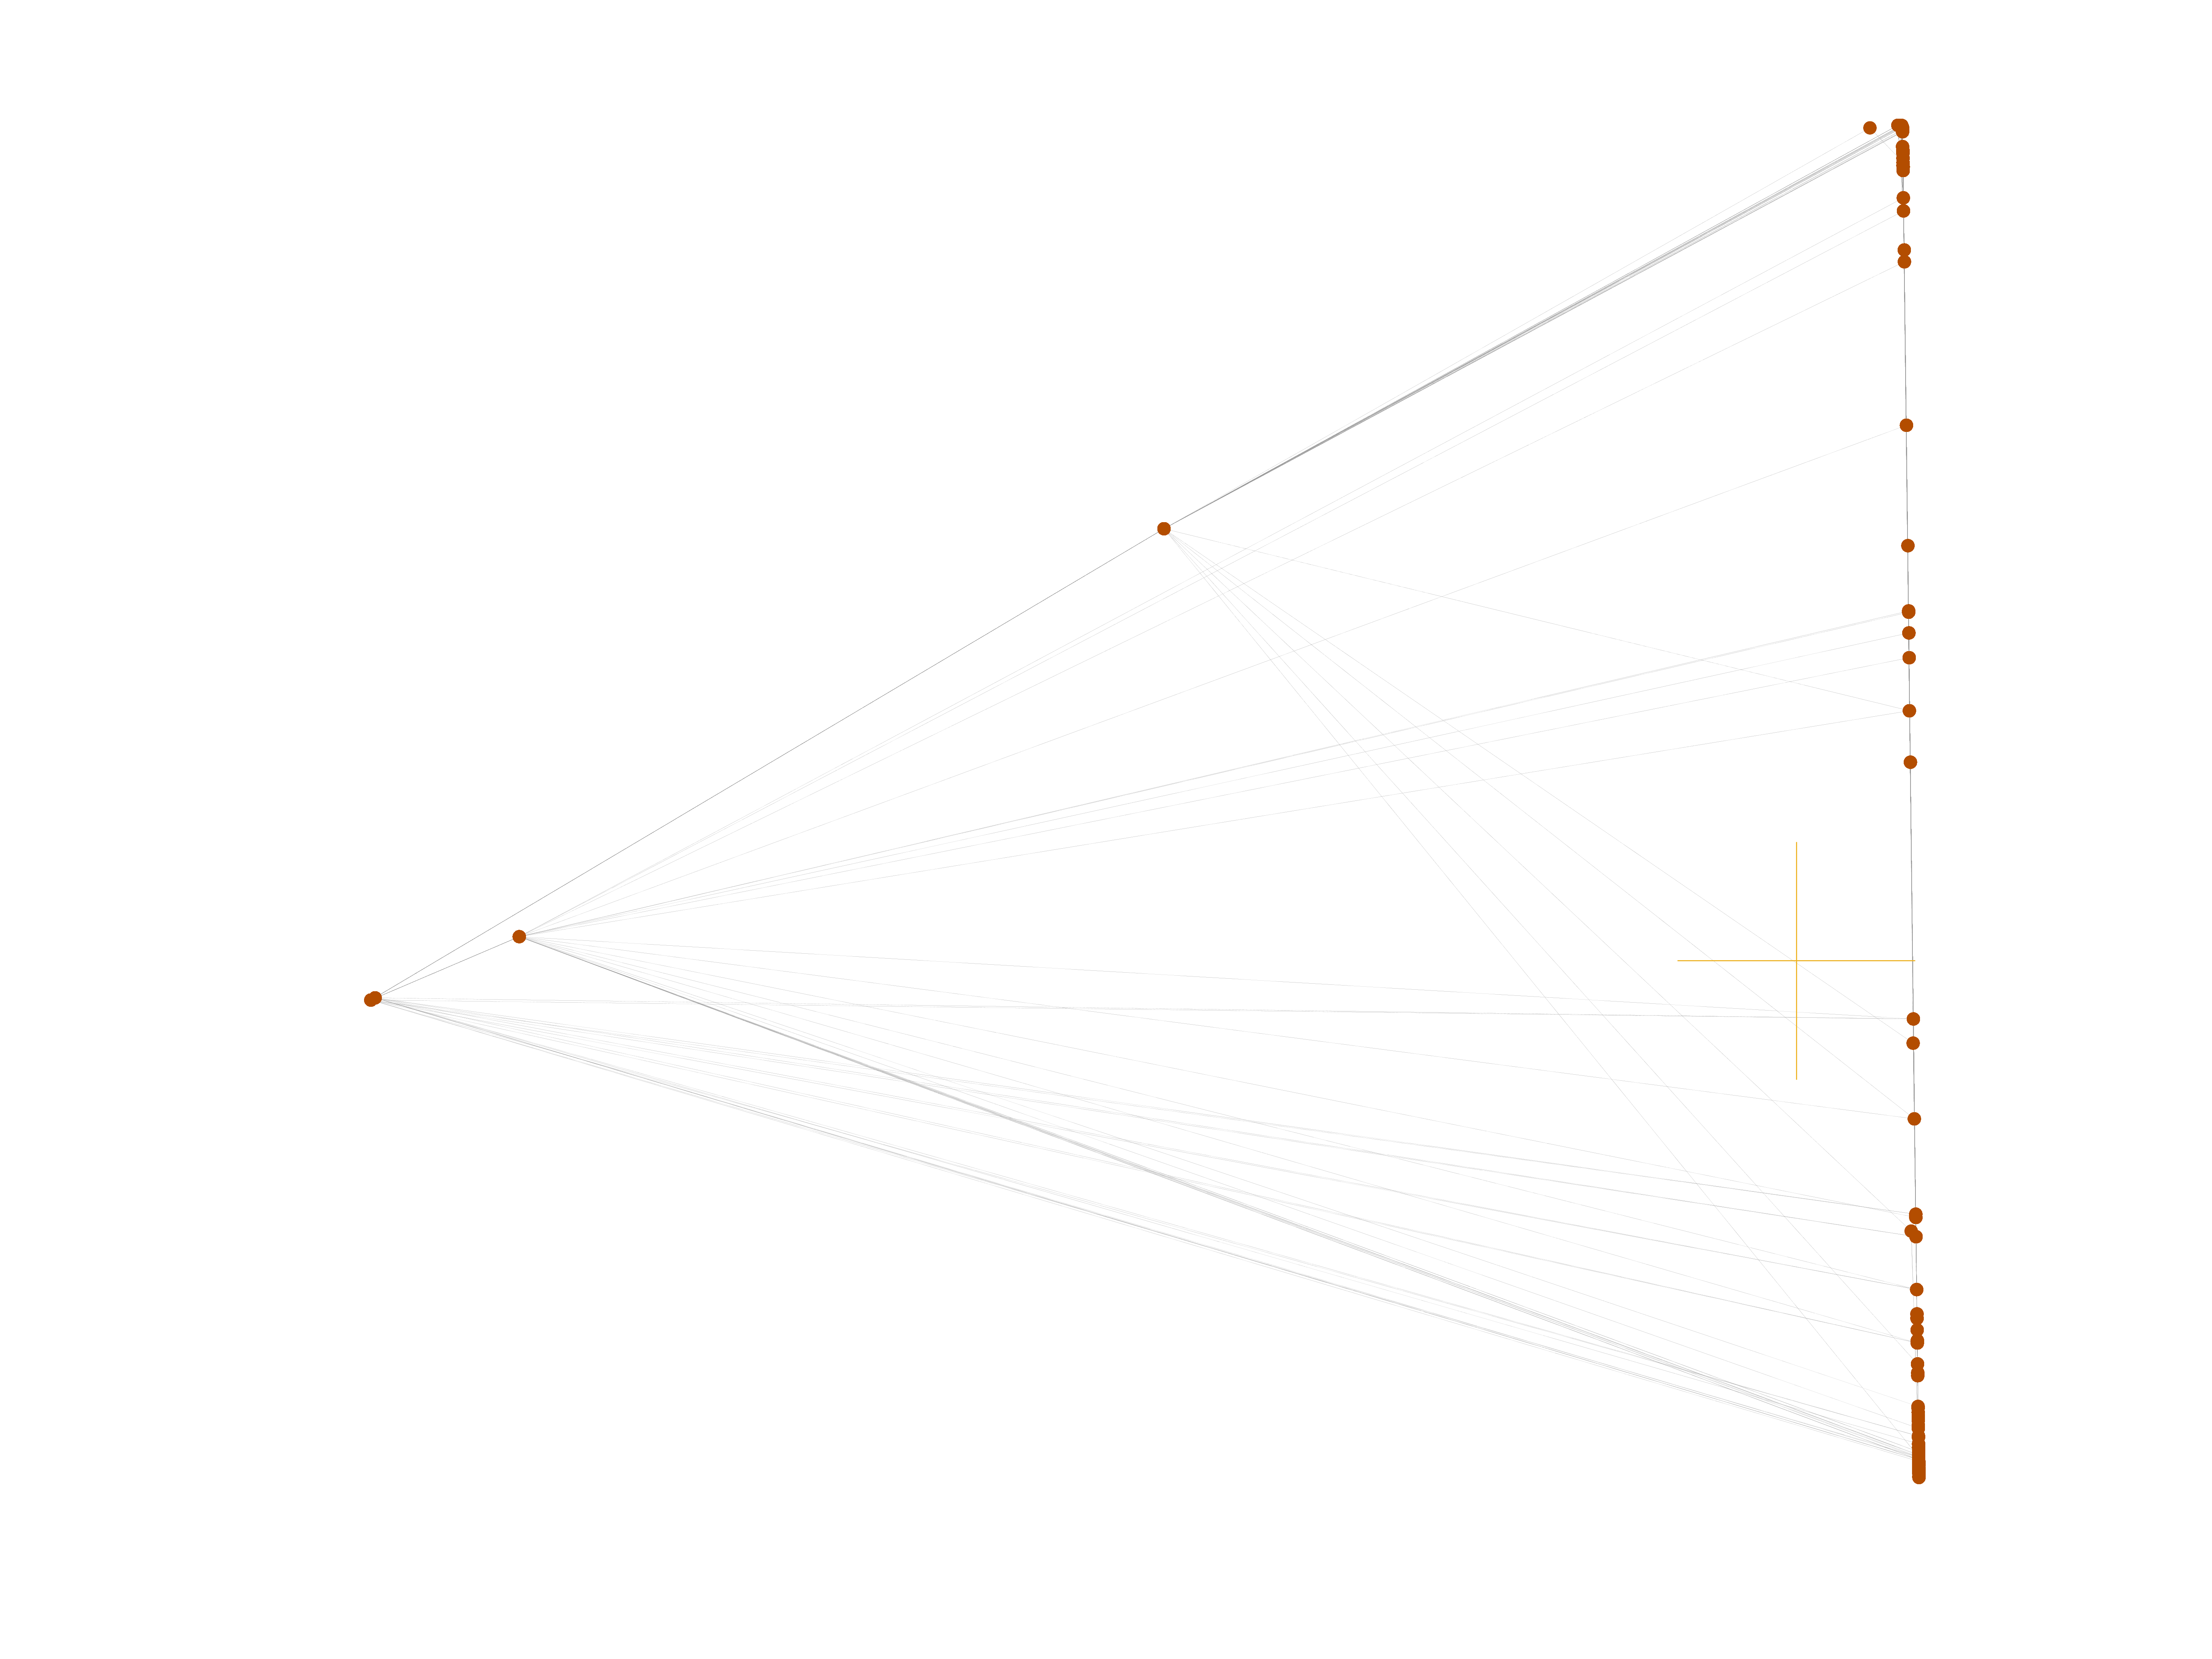
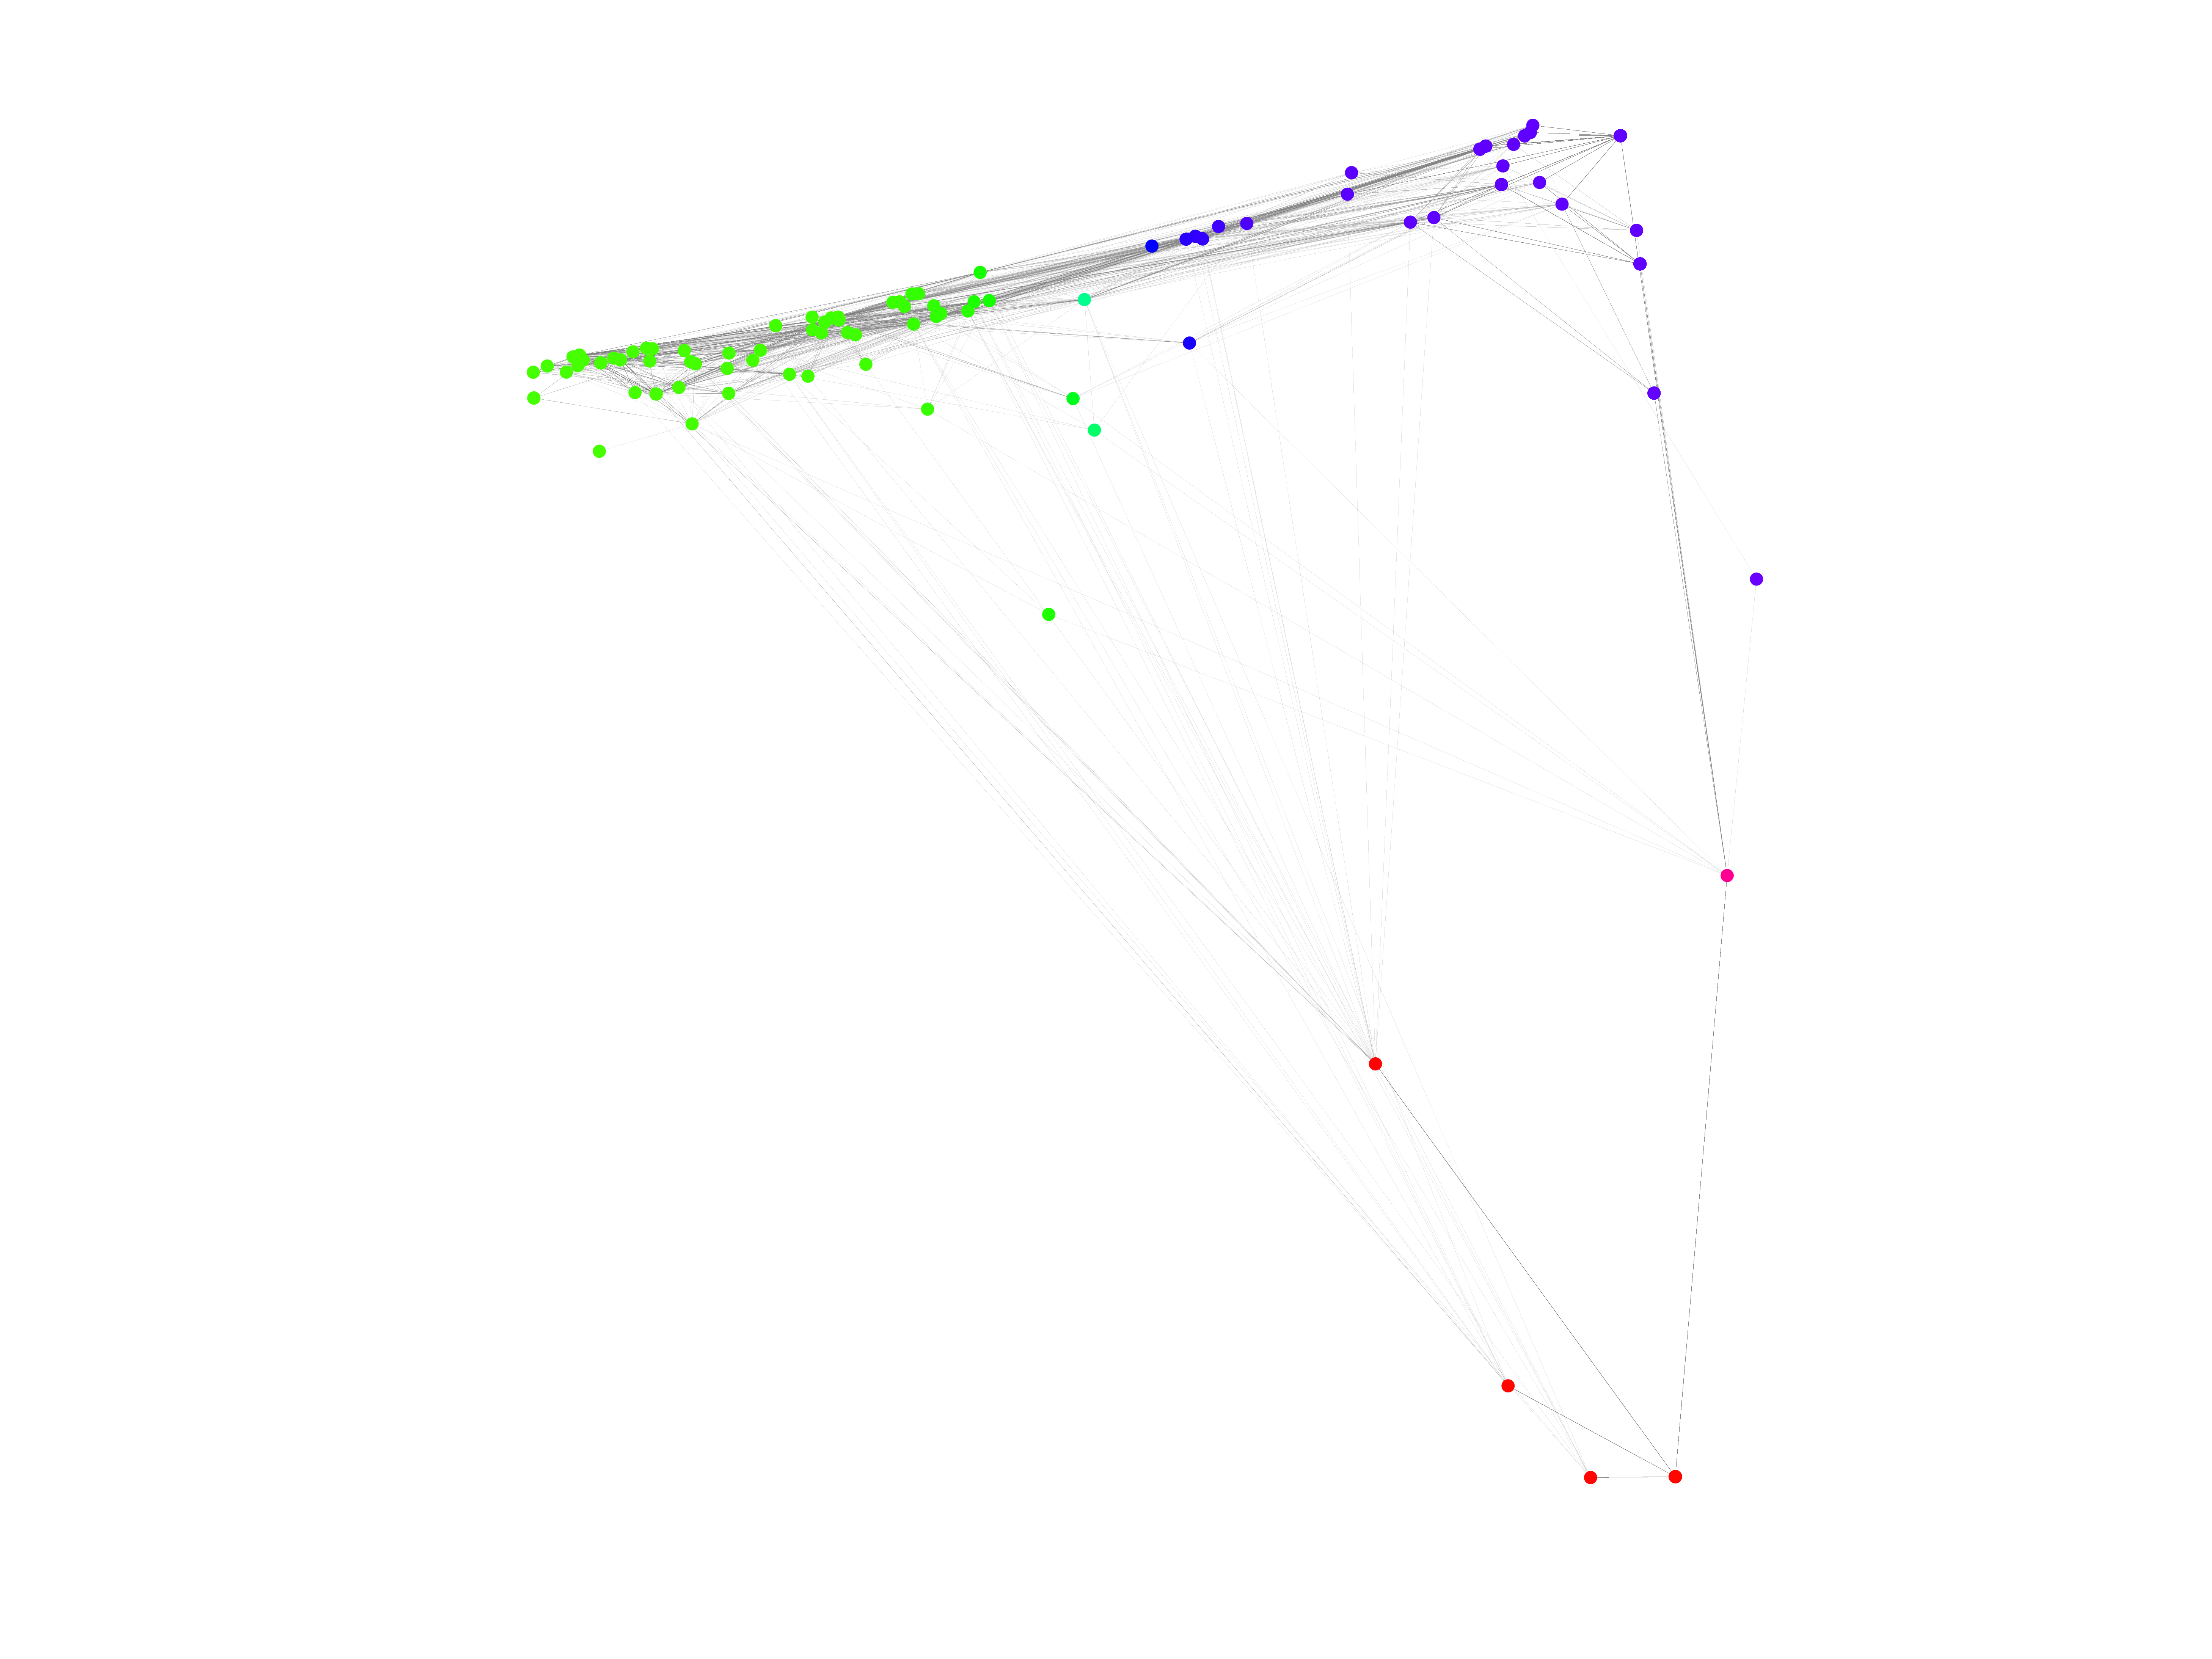
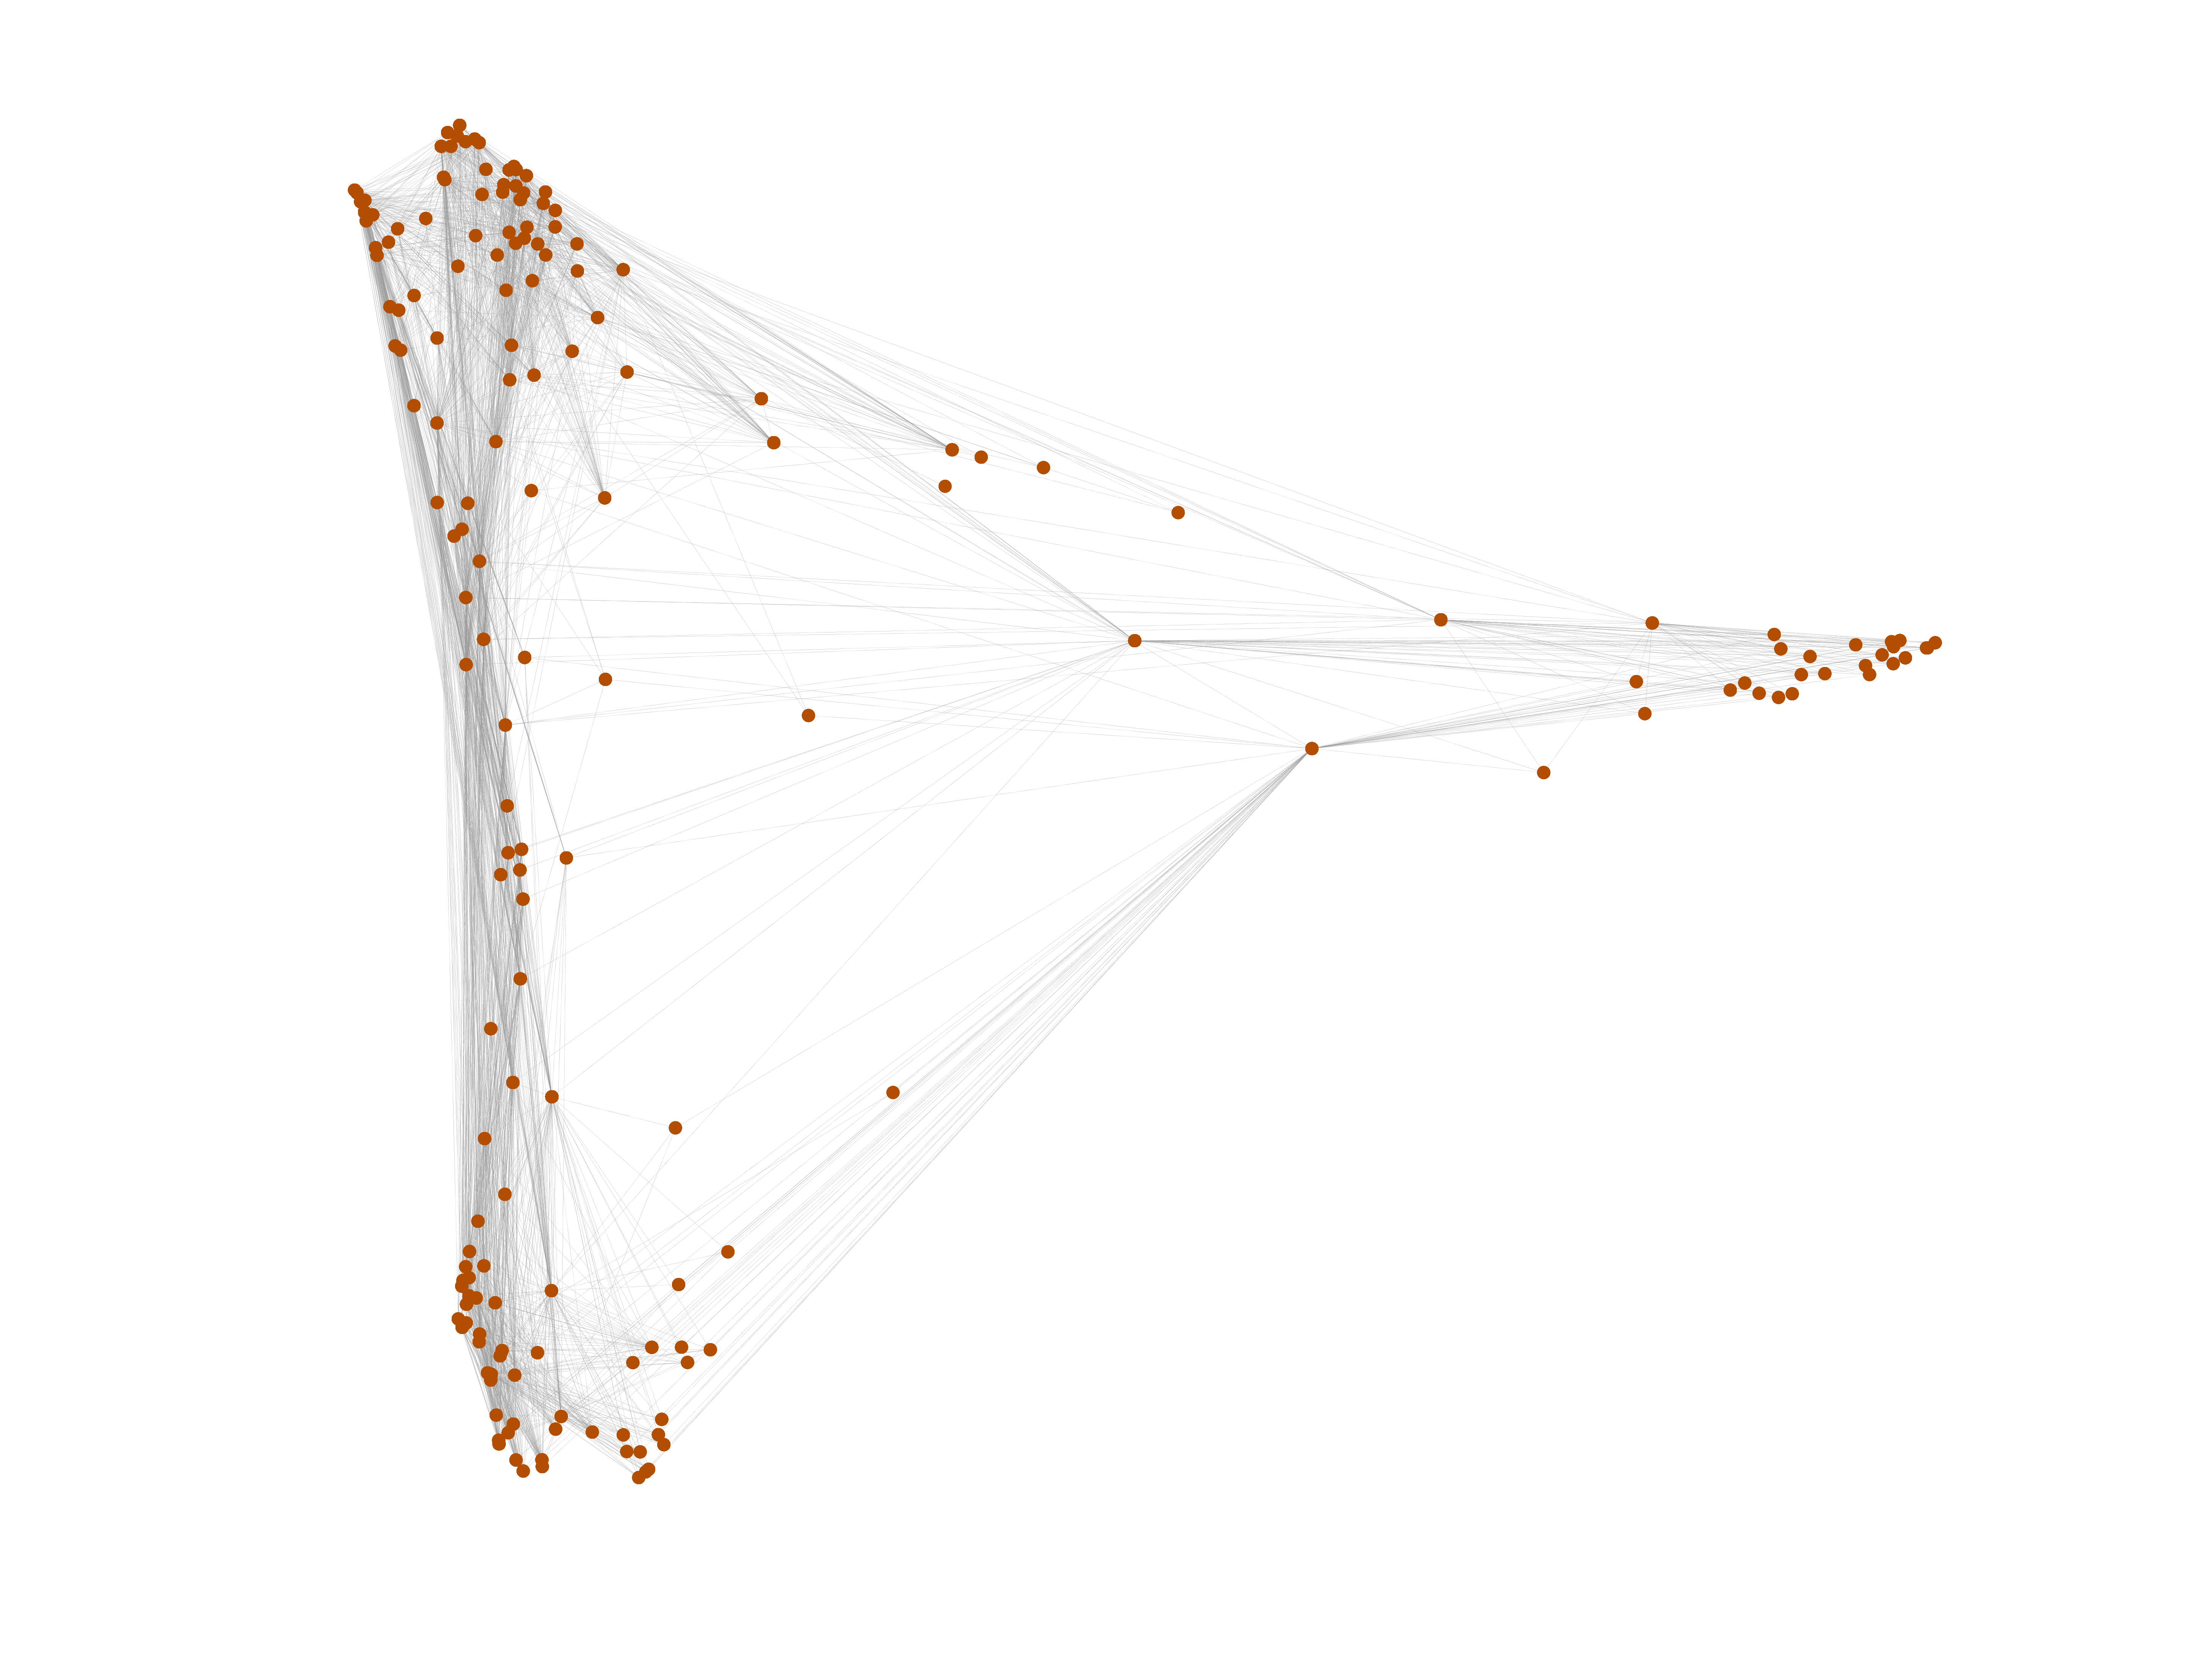
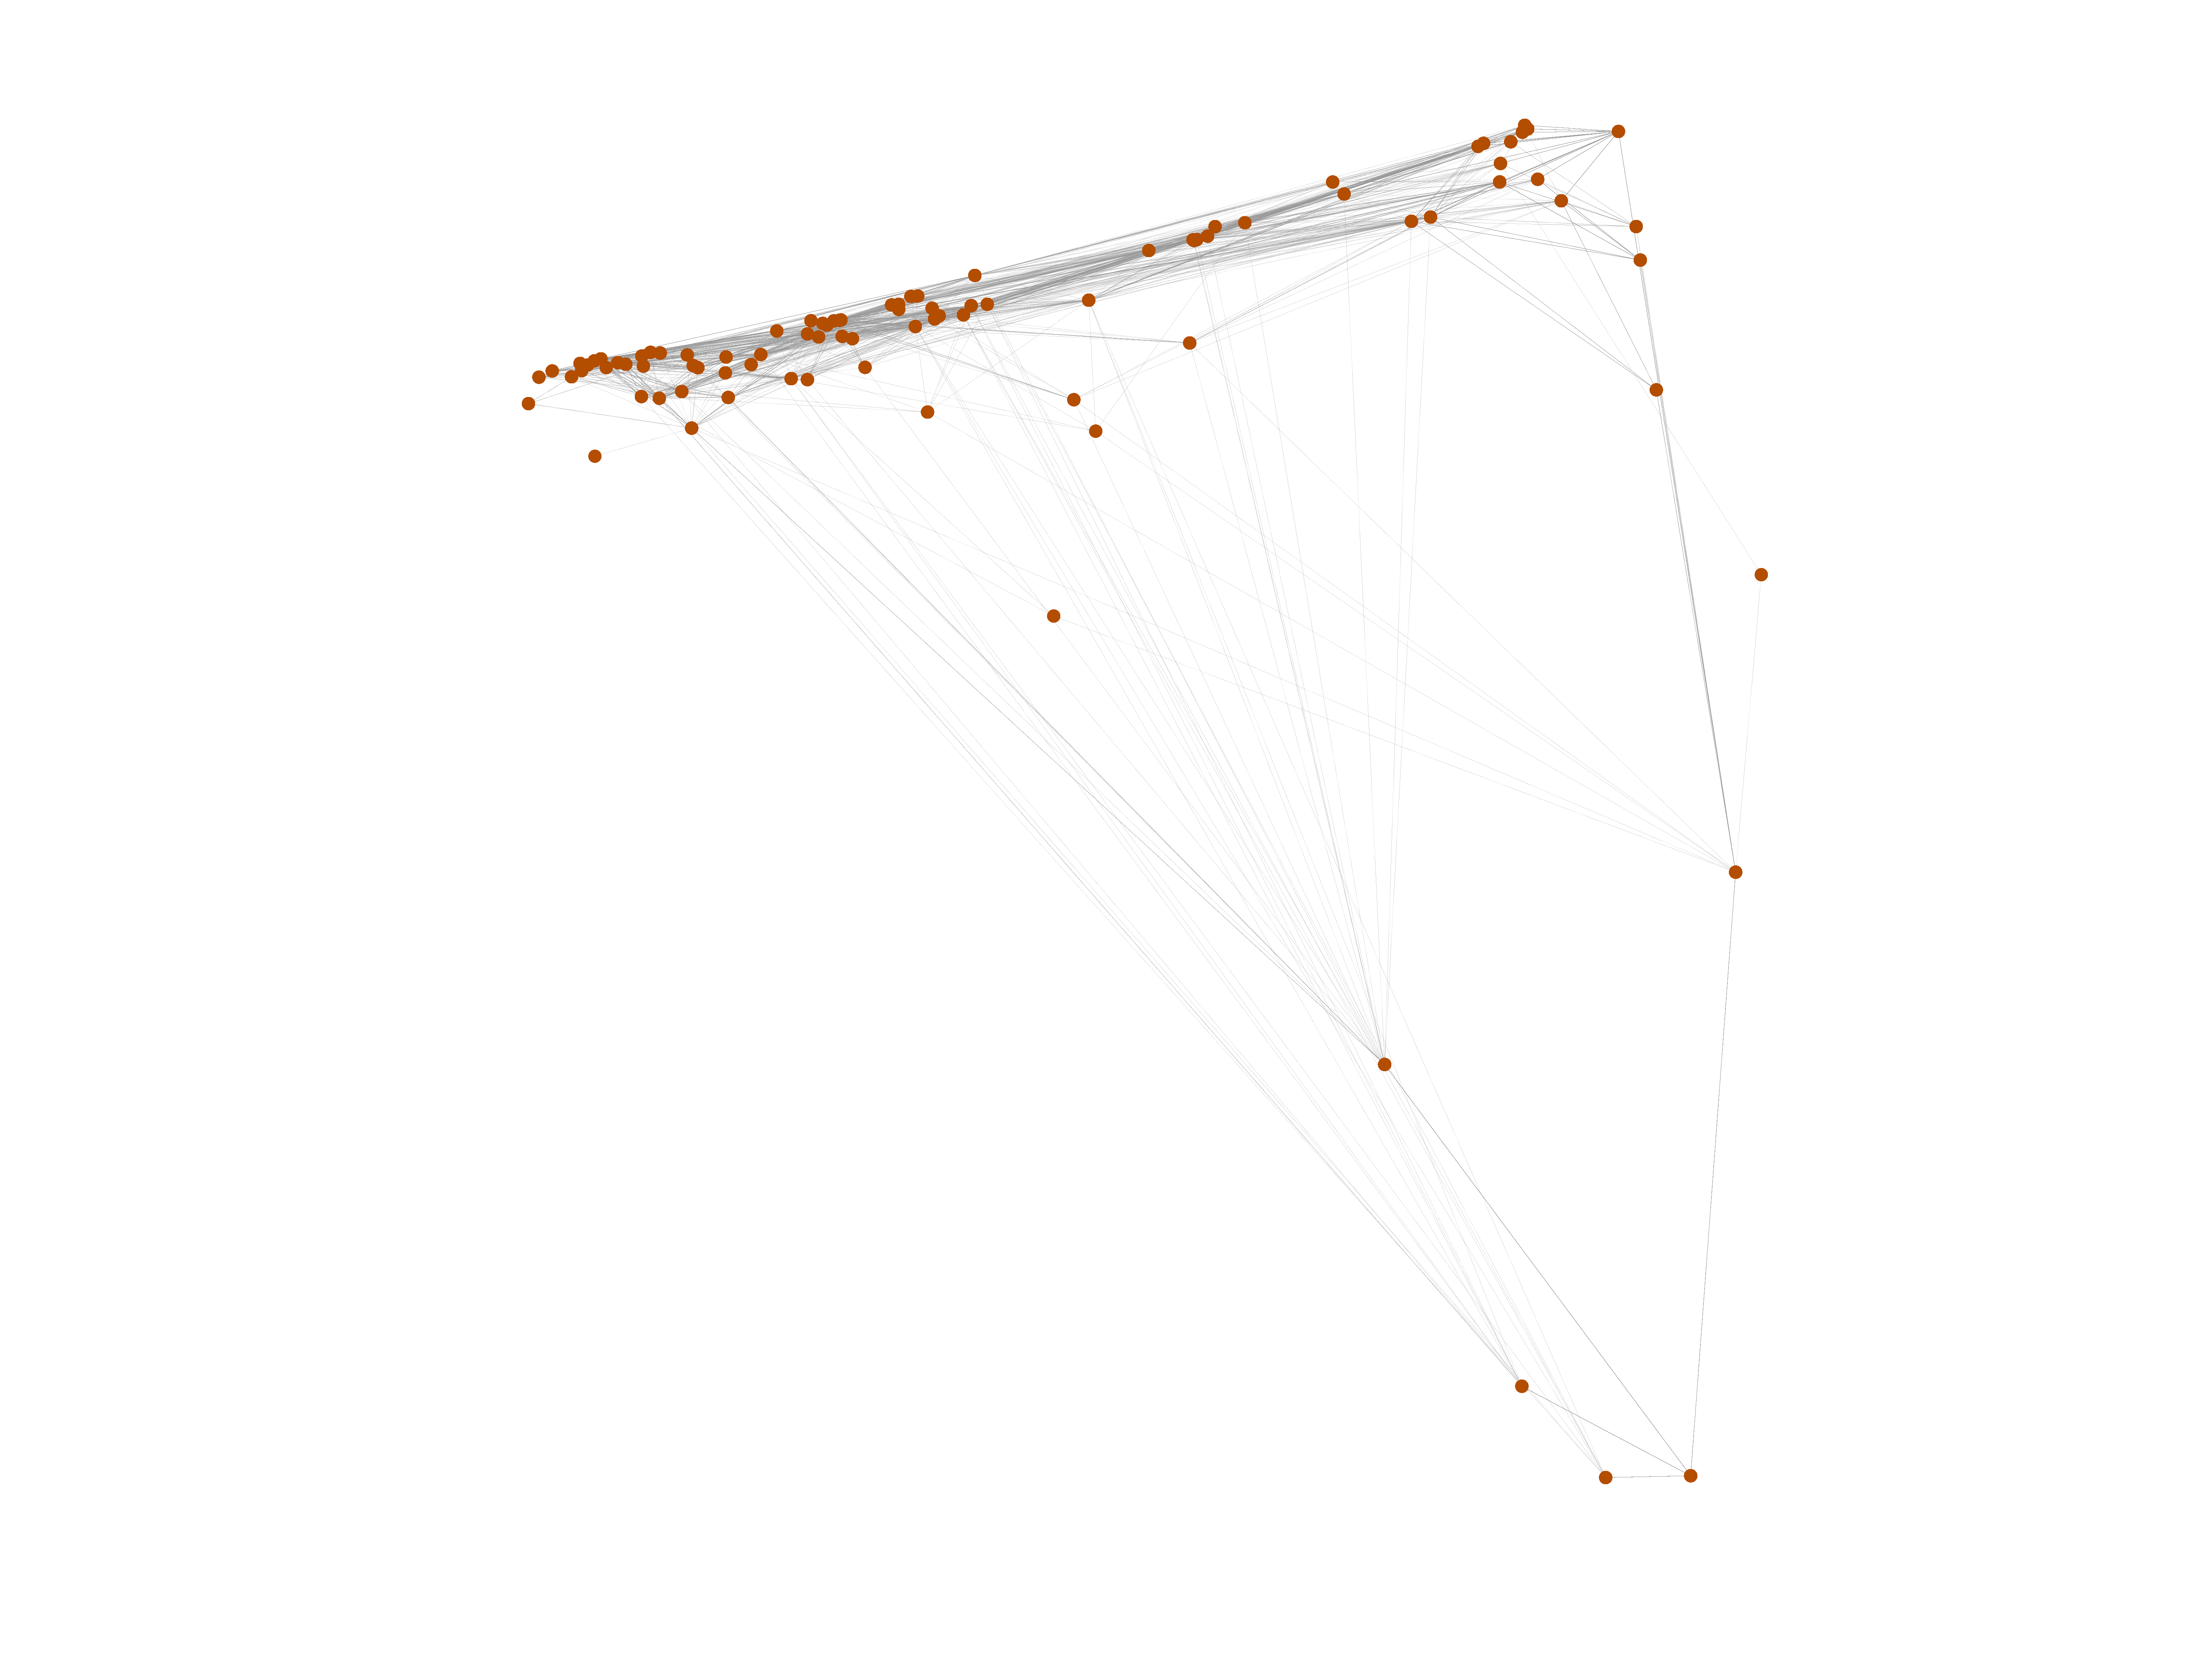
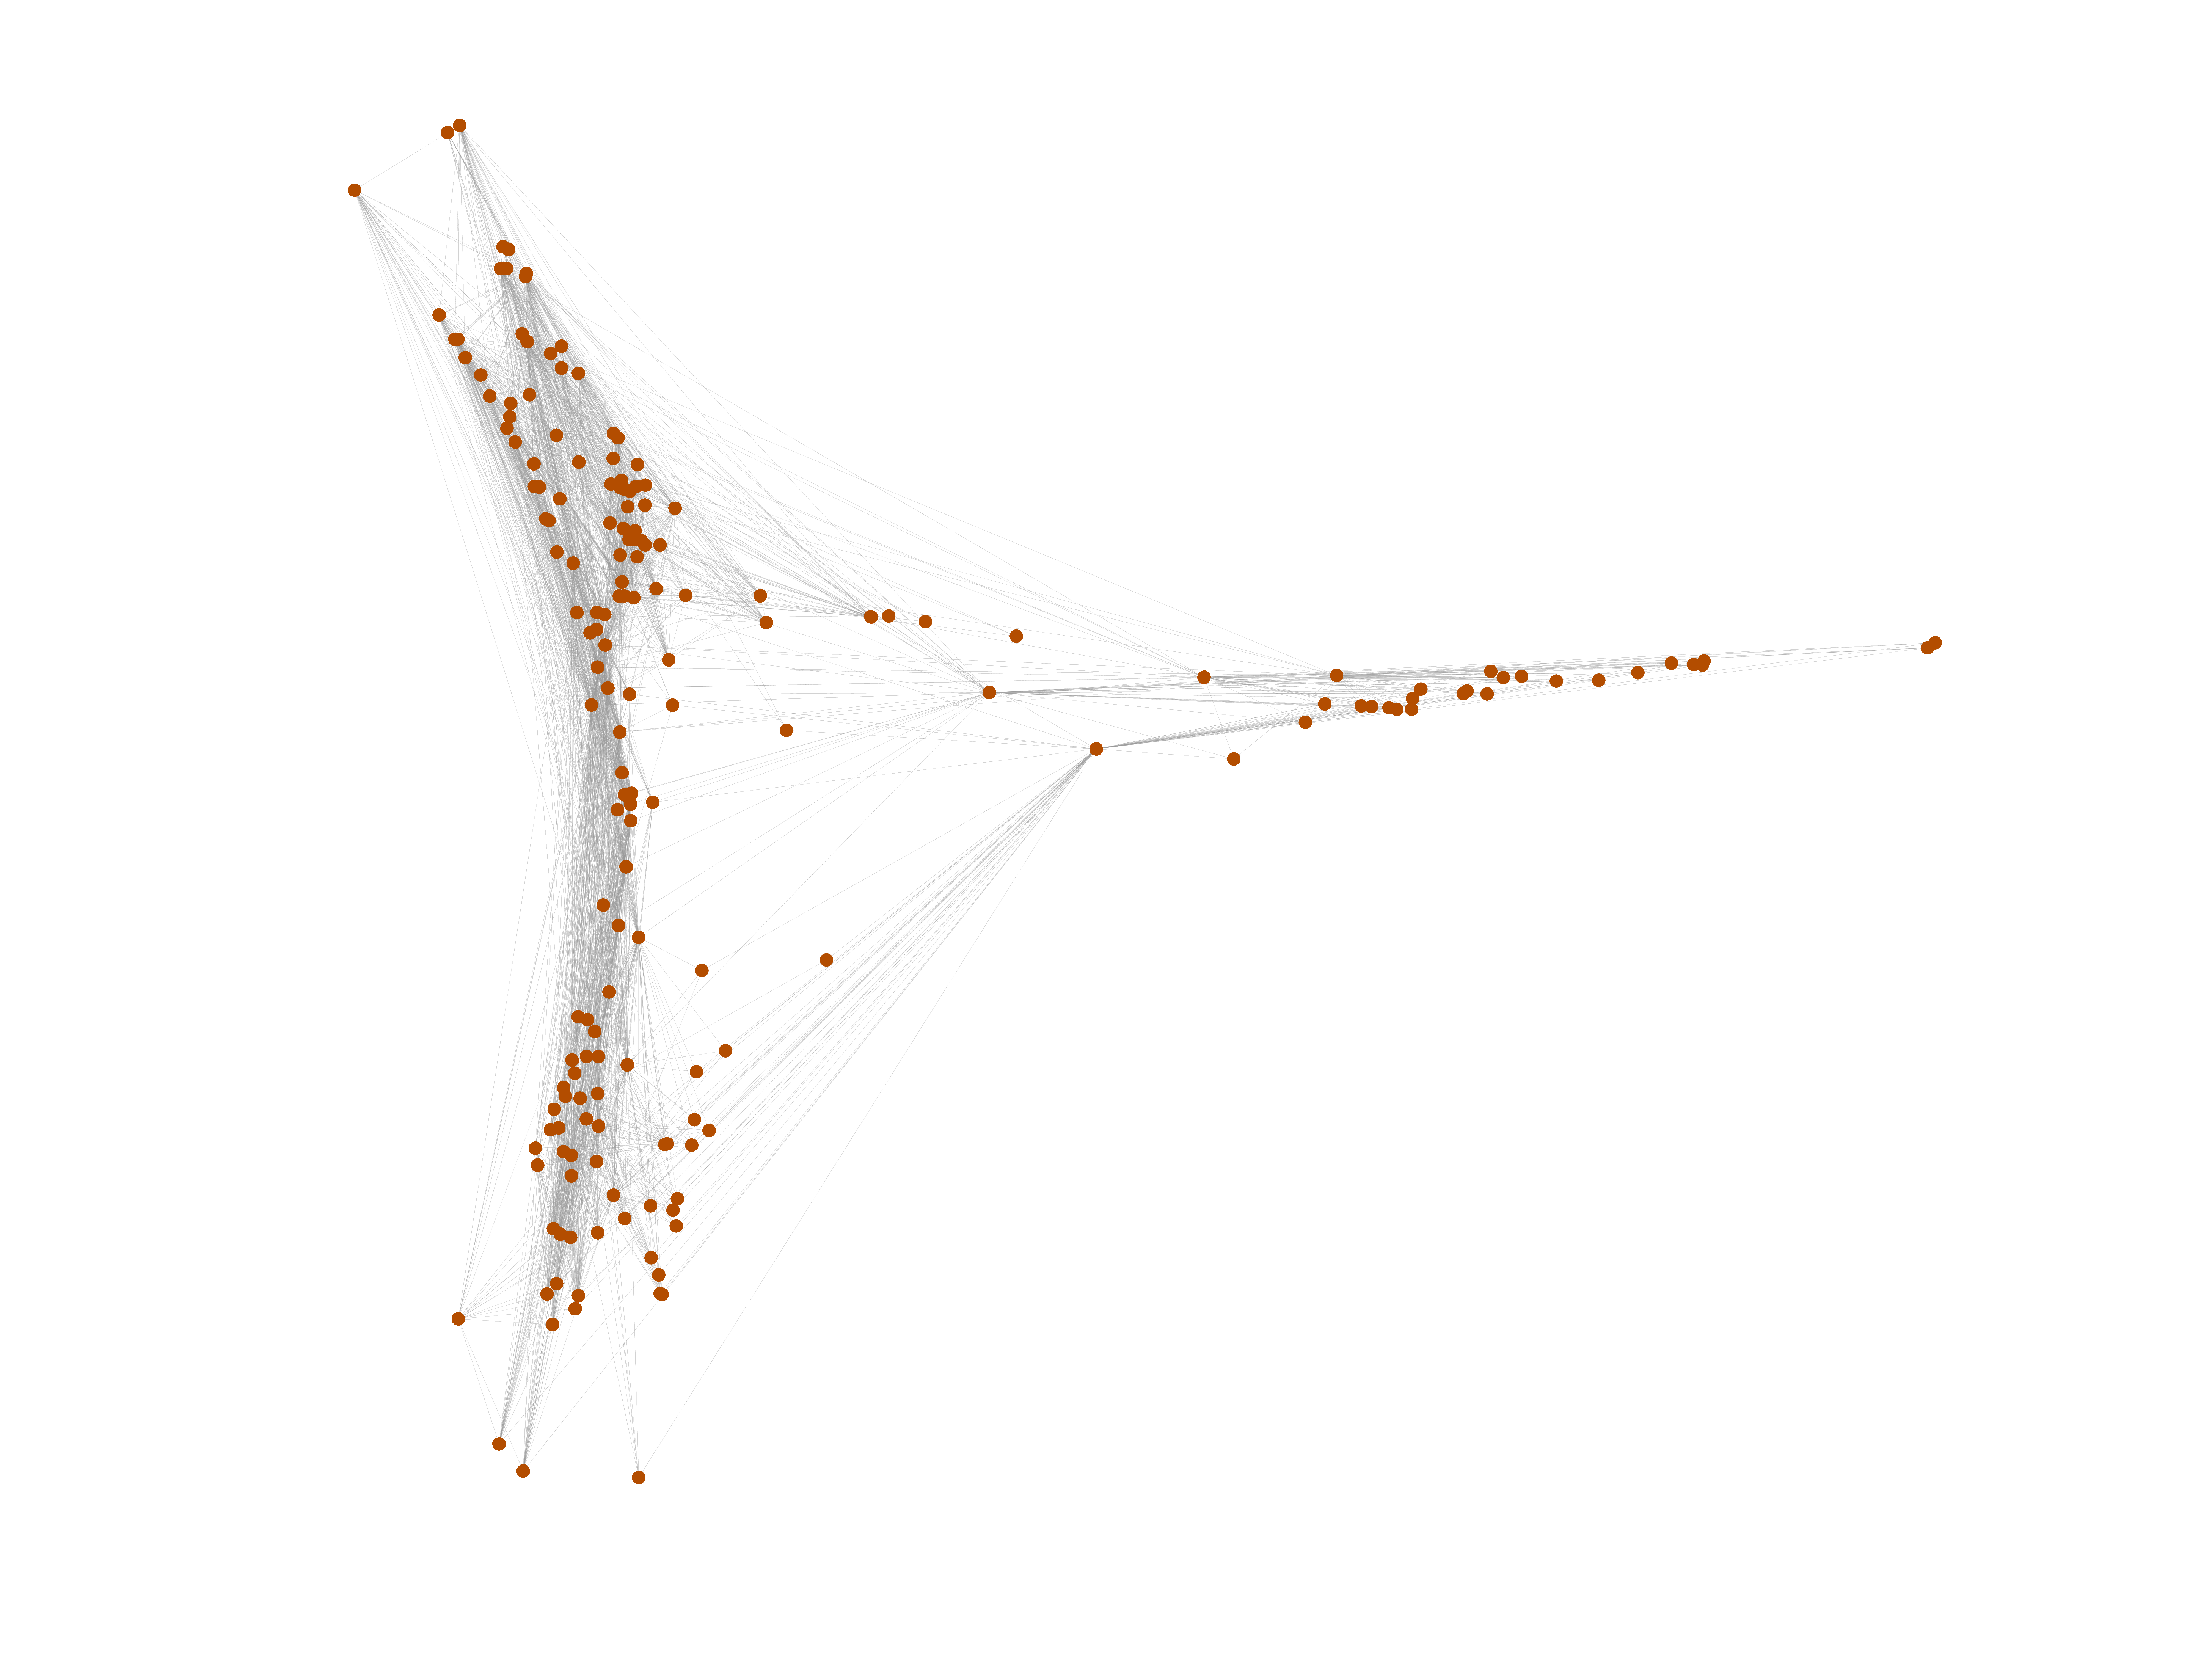
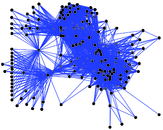
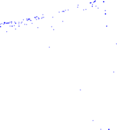
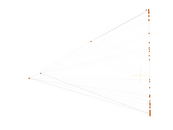
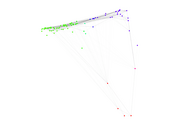
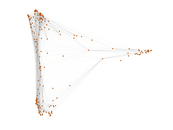
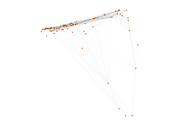
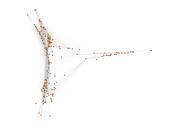
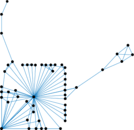
Little Rock Lake
The is the food web of Little Rock Lake, Wisconsin in the United States of
America. Nodes in this network are autotrophs, herbivores, carnivores and
decomposers; links represent food sources.
Metadata
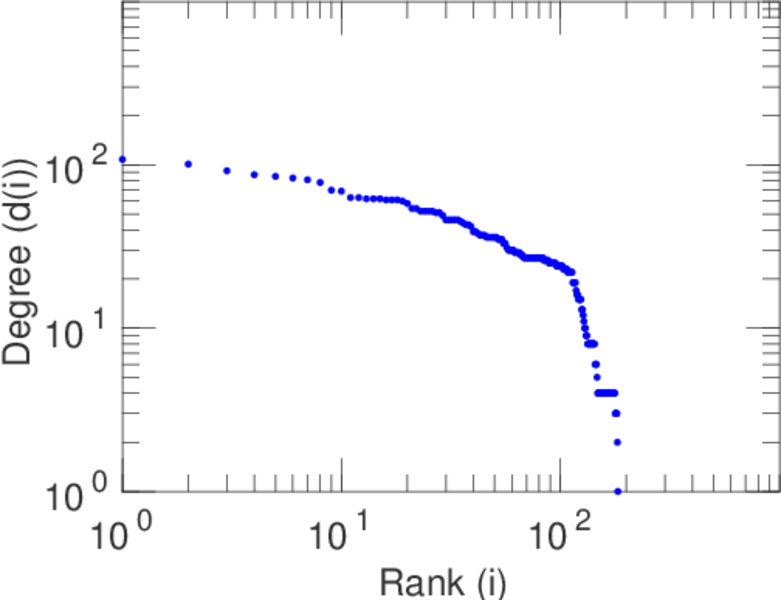
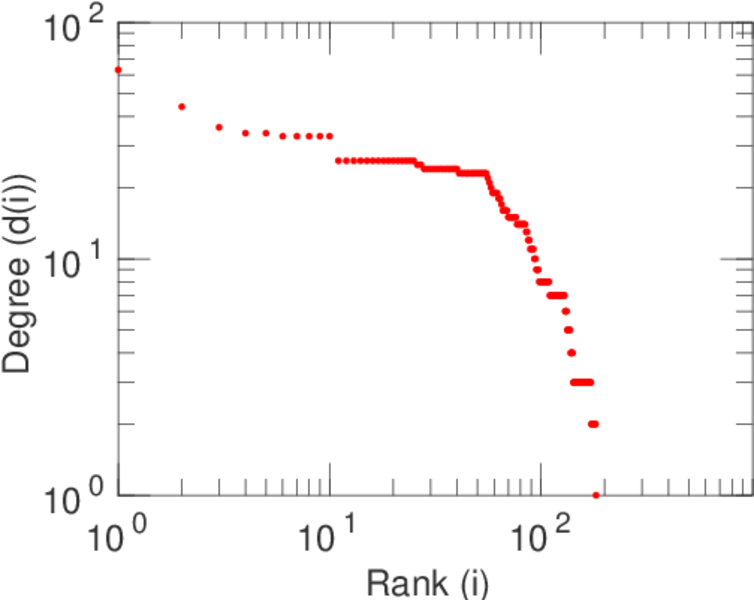
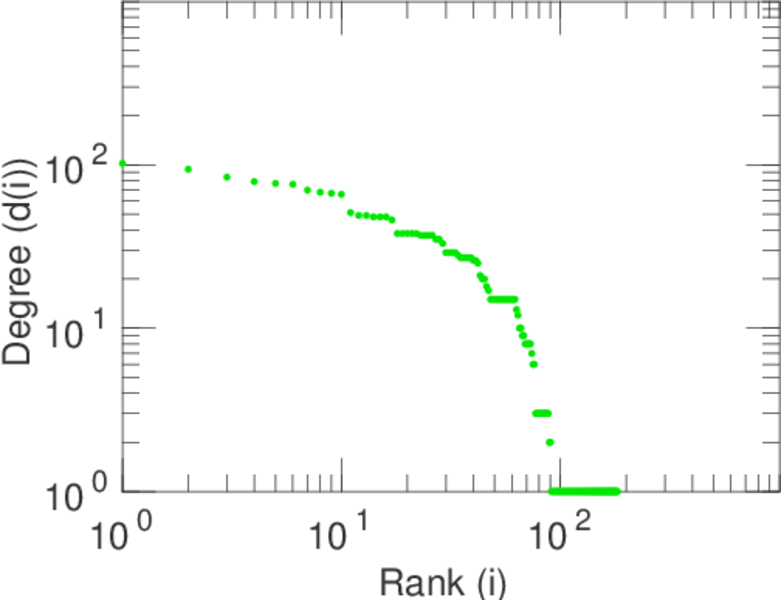
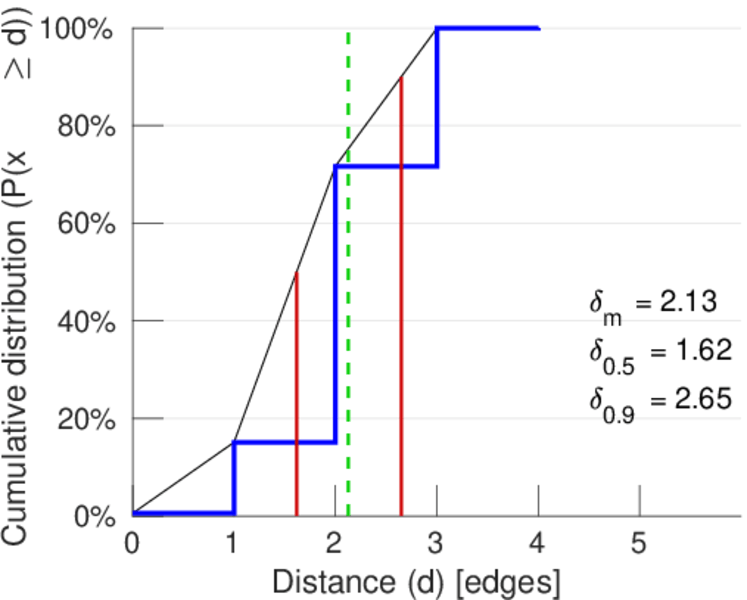
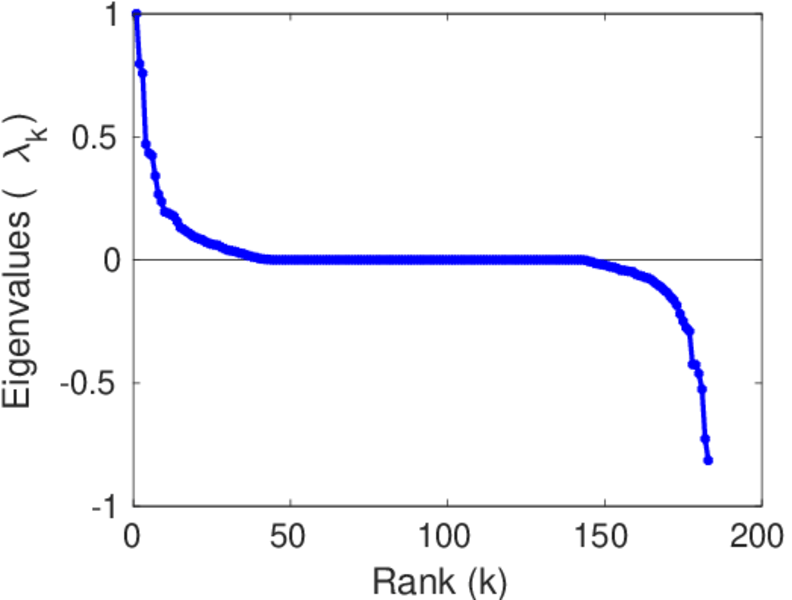
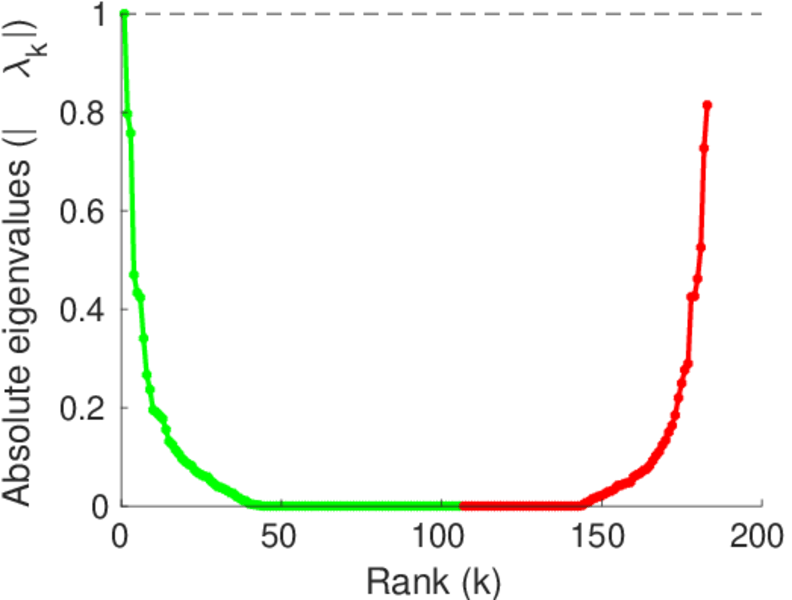
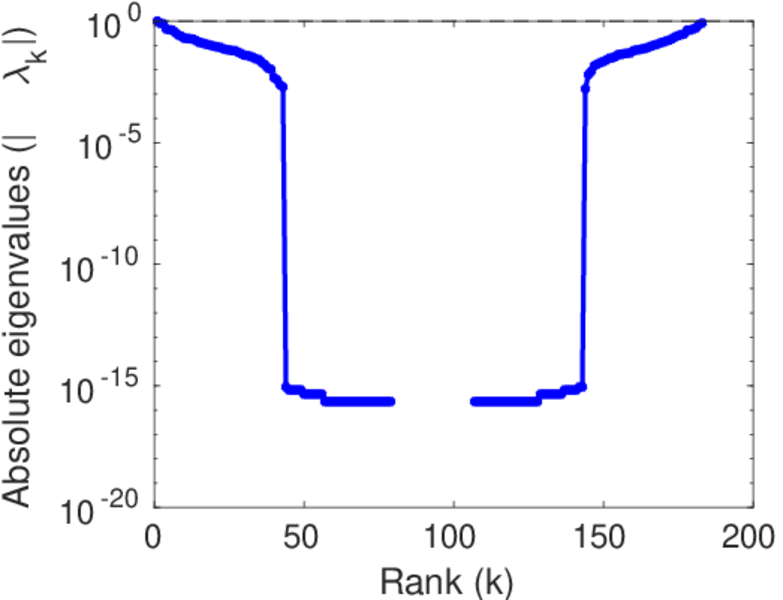
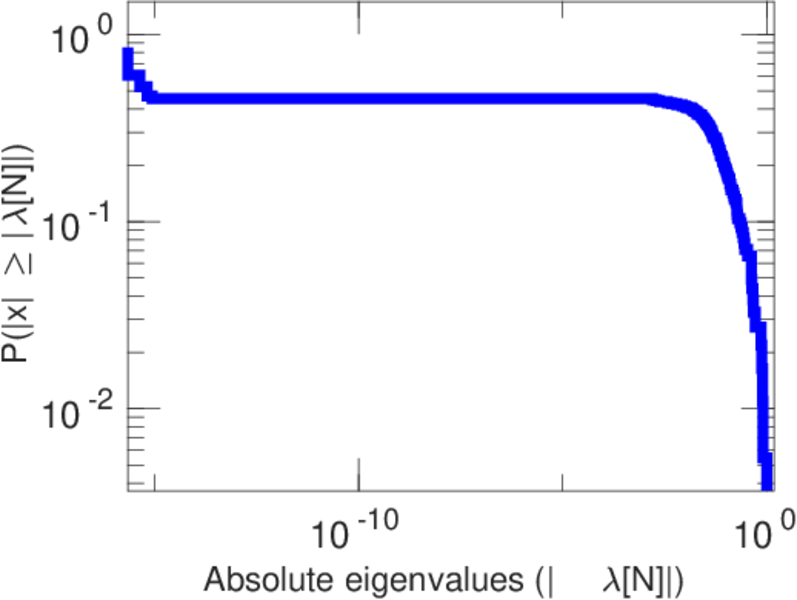
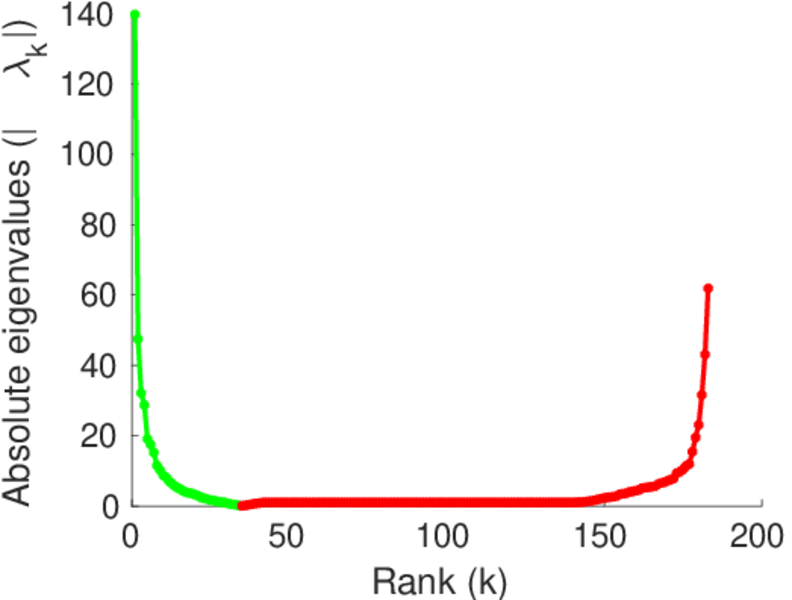
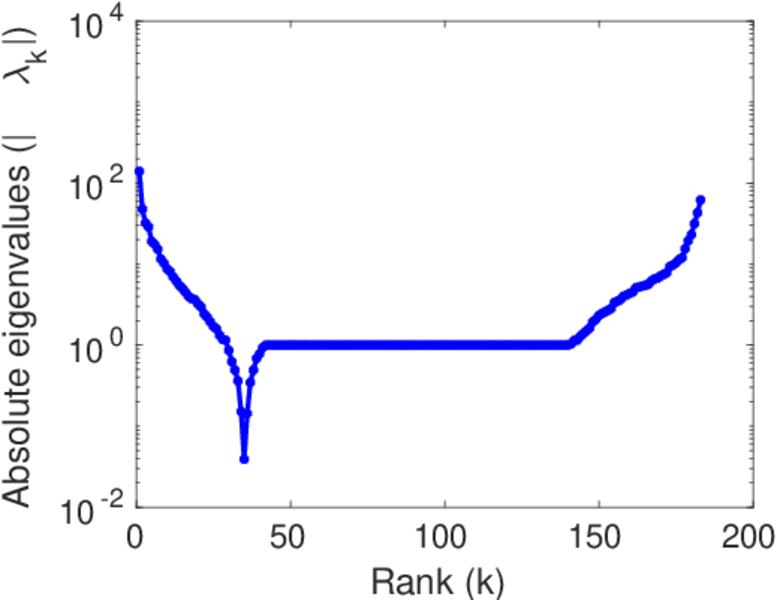
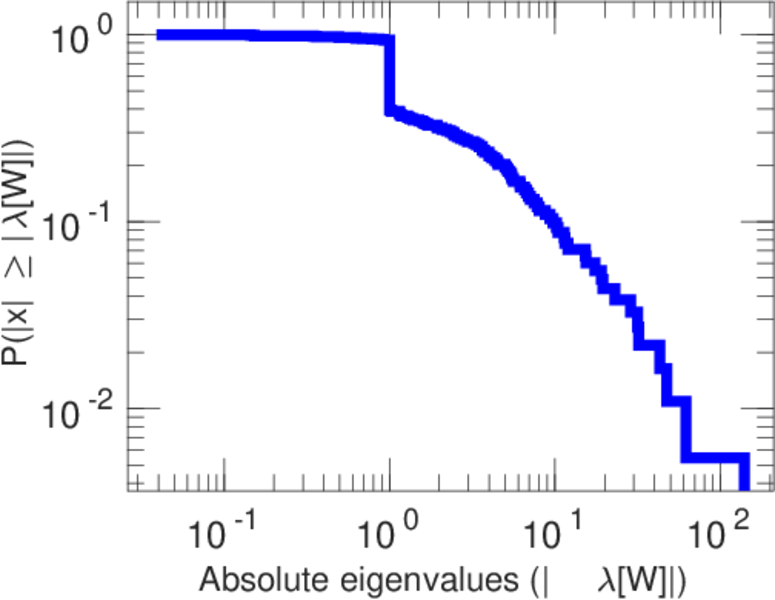
Statistics
| Size | n = | 183
|
| Volume | m = | 2,494
|
| Loop count | l = | 18
|
| Wedge count | s = | 101,959
|
| Claw count | z = | 1,985,127
|
| Cross count | x = | 32,930,228
|
| Triangle count | t = | 11,292
|
| Square count | q = | 456,289
|
| 4-Tour count | T4 = | 4,063,016
|
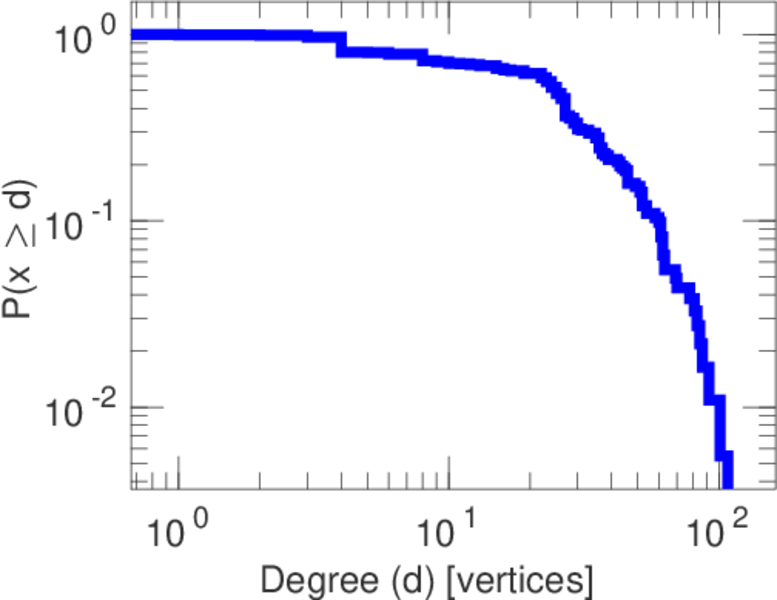
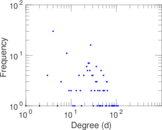
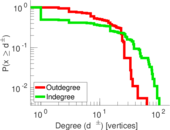
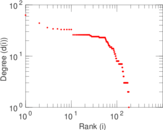
| Maximum degree | dmax = | 108
|
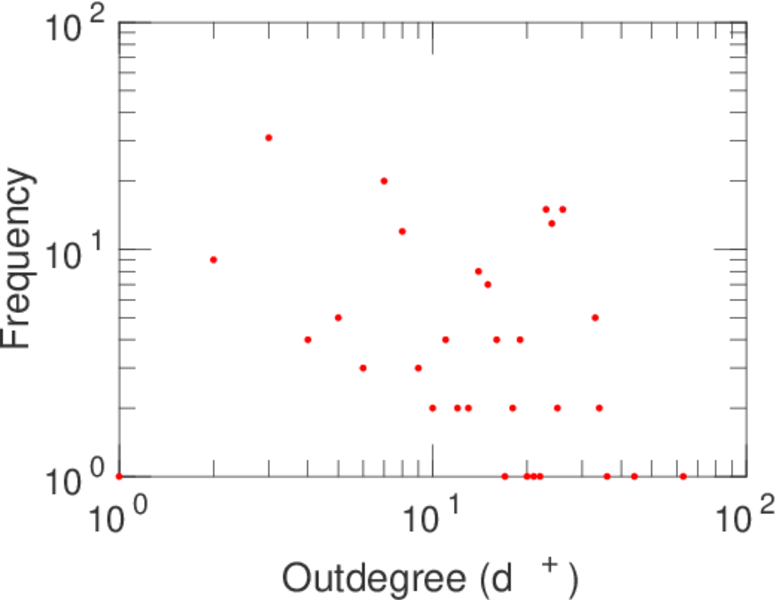
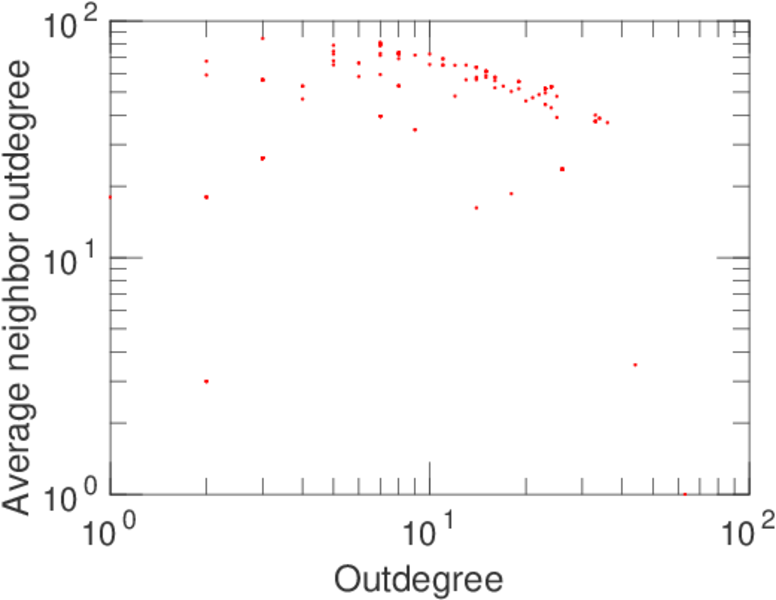
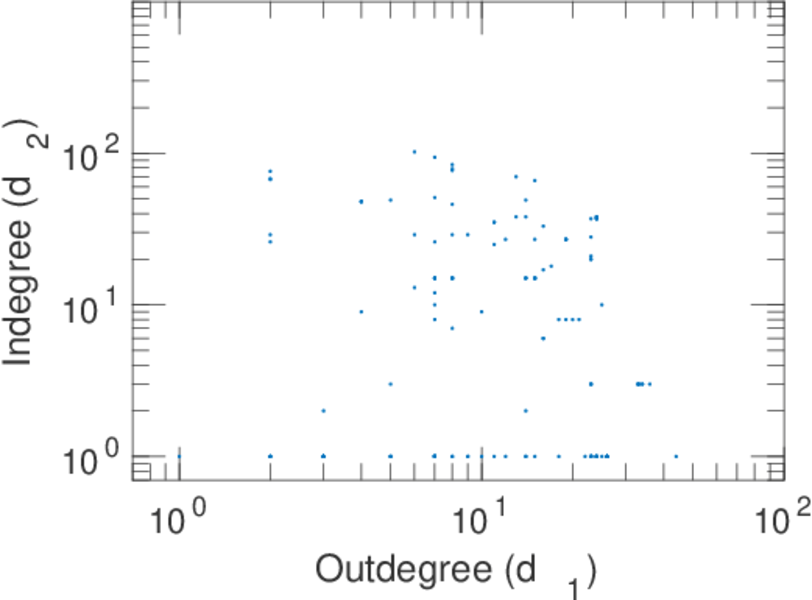
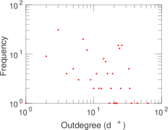
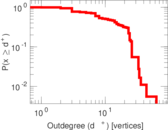
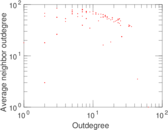
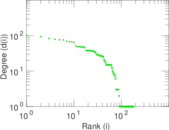
| Maximum outdegree | d+max = | 63
|
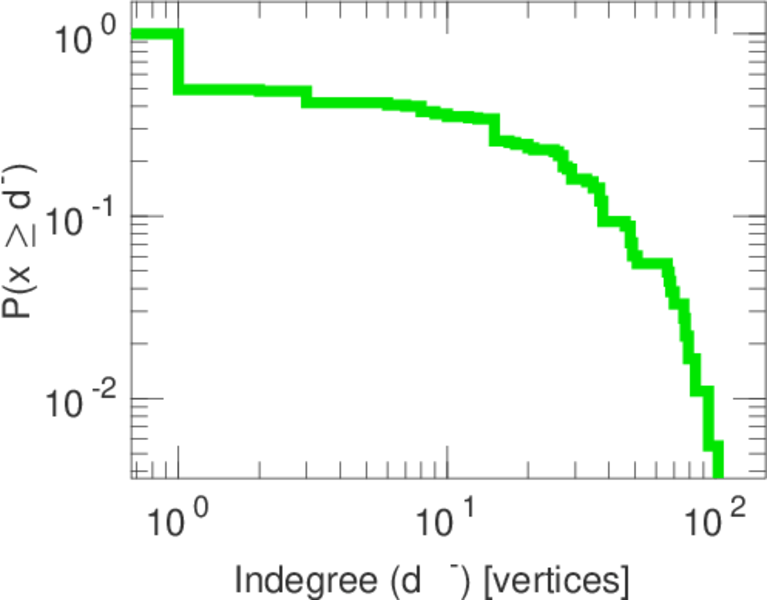
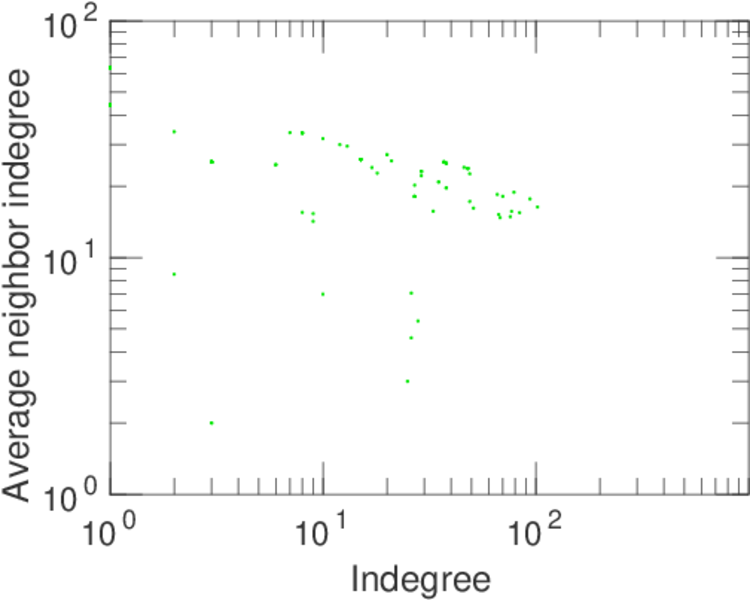
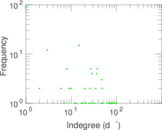
| Maximum indegree | d−max = | 102
|
| Average degree | d = | 27.256 8
|
| Fill | p = | 0.074 472 2
|
| Size of LCC | N = | 183
|
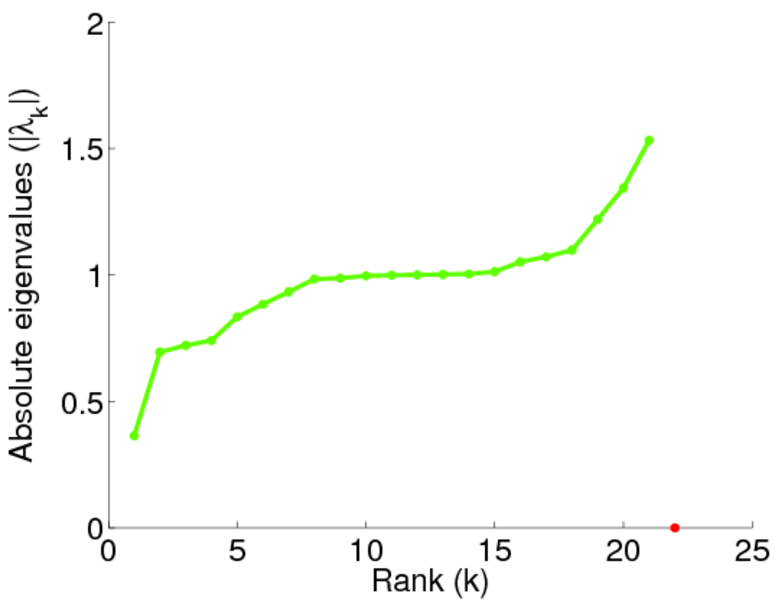
| Size of LSCC | Ns = | 22
|
| Relative size of LSCC | Nrs = | 0.120 219
|
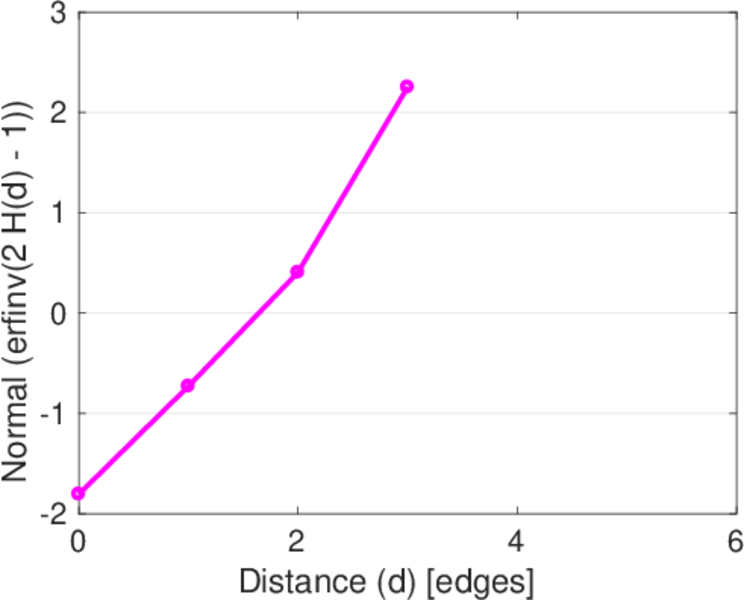
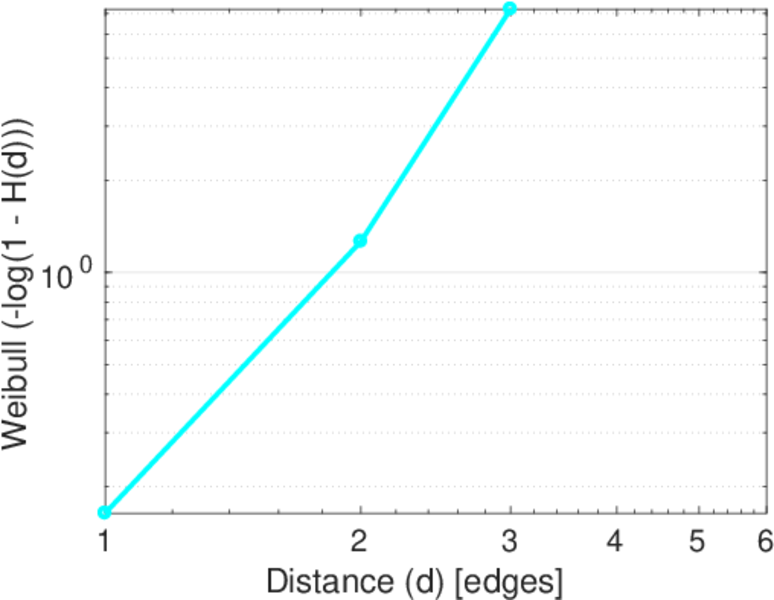
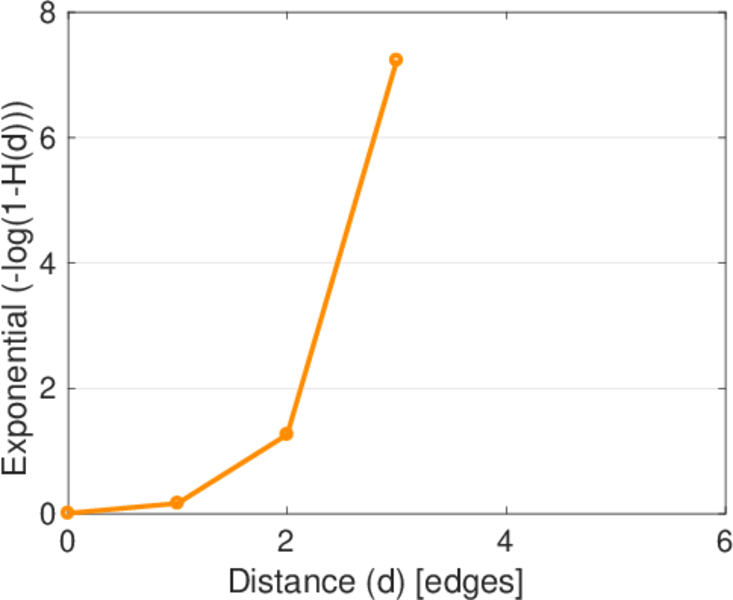
| Diameter | δ = | 4
|
| 50-Percentile effective diameter | δ0.5 = | 1.617 02
|
| 90-Percentile effective diameter | δ0.9 = | 2.648 70
|
| Median distance | δM = | 2
|
| Mean distance | δm = | 2.127 82
|
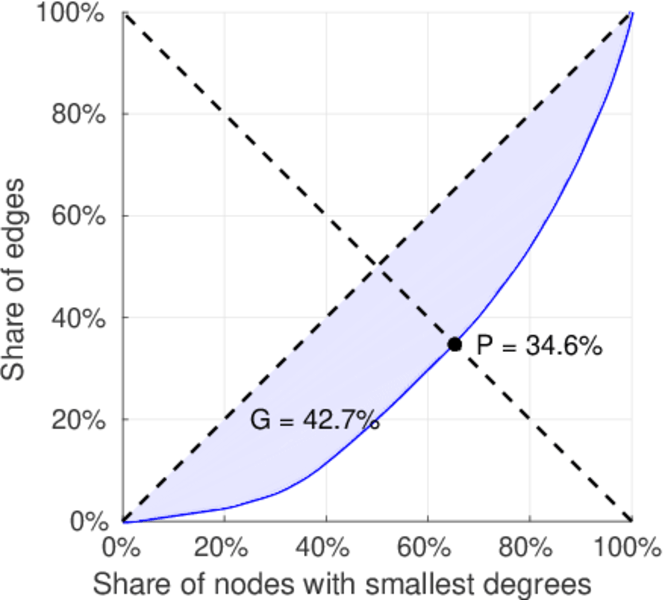
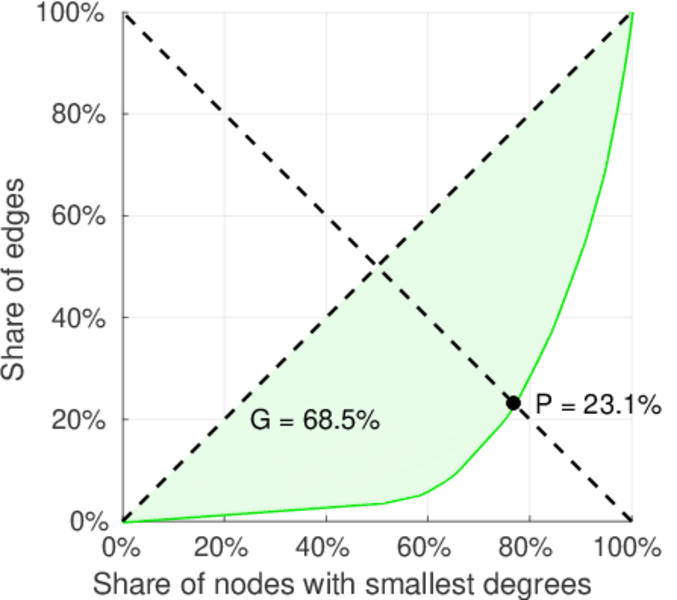
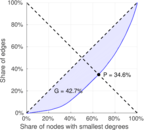
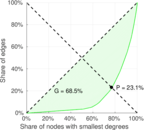
| Gini coefficient | G = | 0.426 617
|
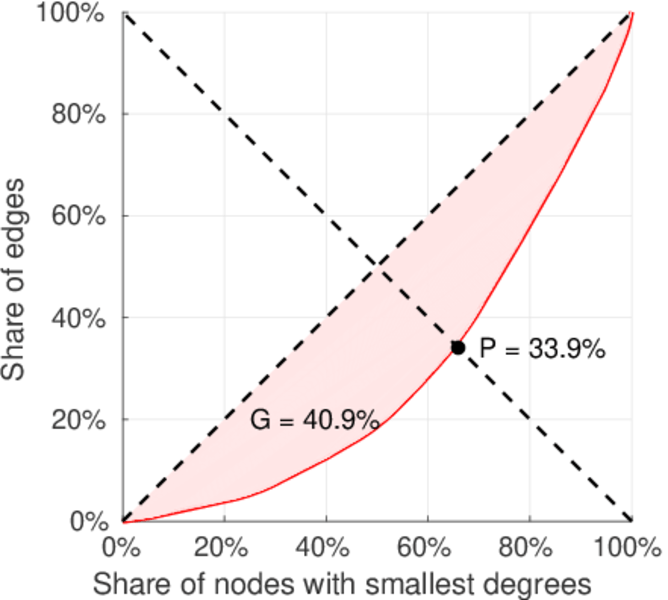
| Balanced inequality ratio | P = | 0.346 030
|
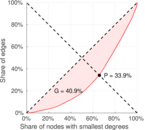
| Outdegree balanced inequality ratio | P+ = | 0.339 214
|
| Indegree balanced inequality ratio | P− = | 0.230 553
|
| Relative edge distribution entropy | Her = | 0.941 146
|
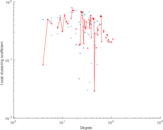
| Power law exponent | γ = | 1.345 61
|
| Tail power law exponent | γt = | 2.991 00
|
| Tail power law exponent with p | γ3 = | 2.991 00
|
| p-value | p = | 0.014 000 0
|
| Outdegree tail power law exponent with p | γ3,o = | 7.541 00
|
| Outdegree p-value | po = | 0.000 00
|
| Indegree tail power law exponent with p | γ3,i = | 3.241 00
|
| Indegree p-value | pi = | 0.023 000 0
|
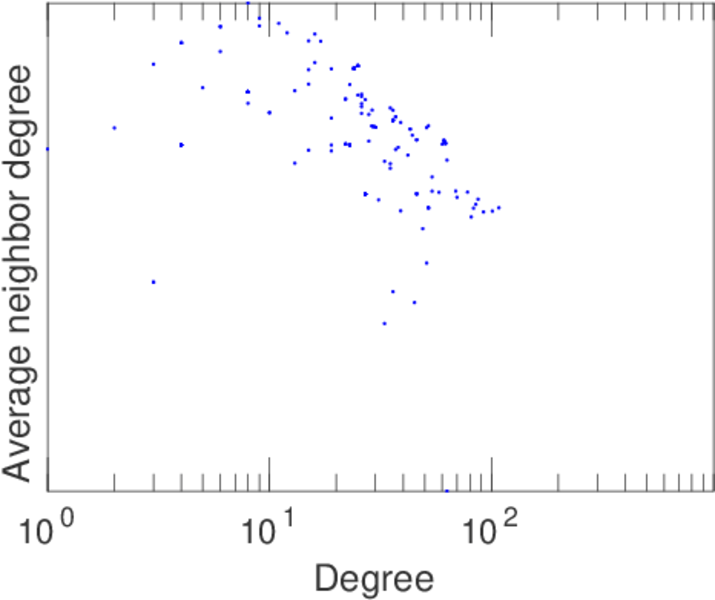
| Degree assortativity | ρ = | −0.266 385
|
| Degree assortativity p-value | pρ = | 7.214 16 × 10−80
|
| In/outdegree correlation | ρ± = | +0.042 949 4
|
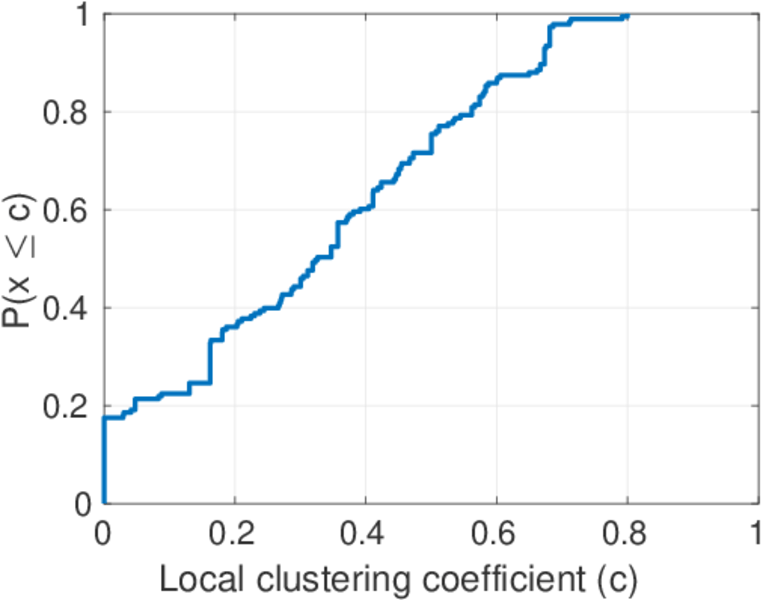
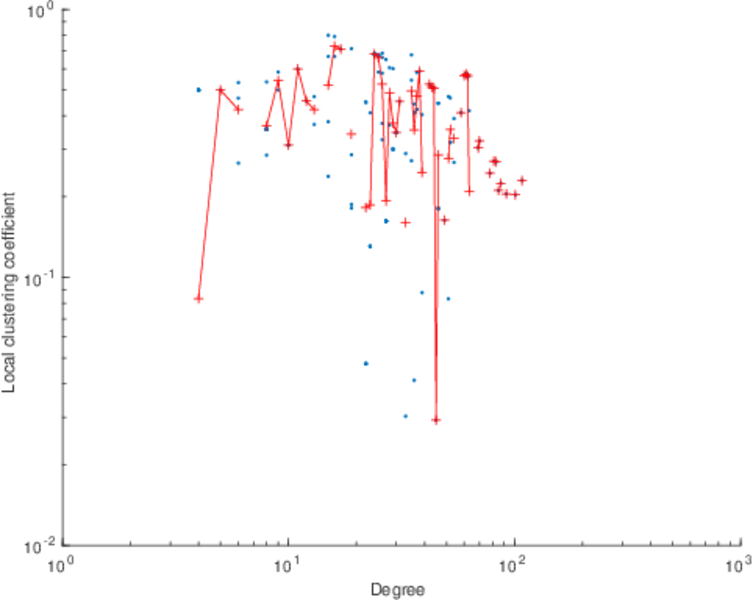
| Clustering coefficient | c = | 0.332 251
|
| Directed clustering coefficient | c± = | 0.472 259
|
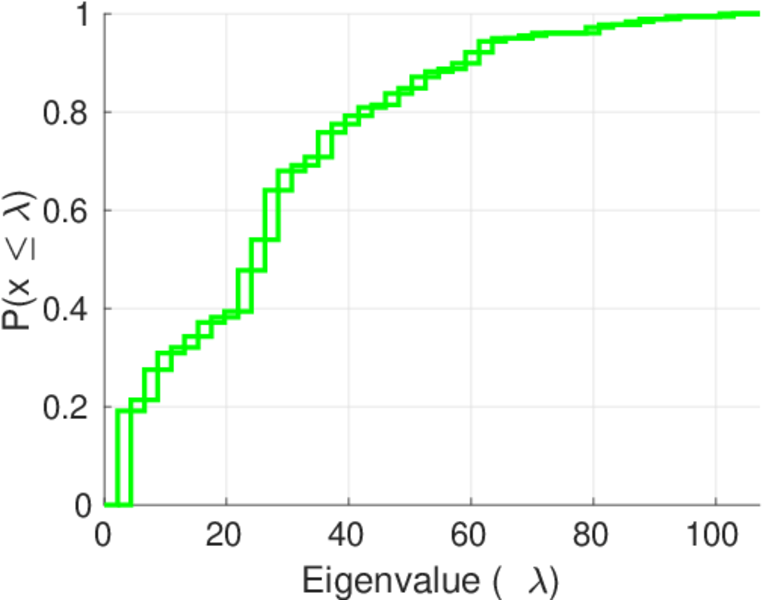
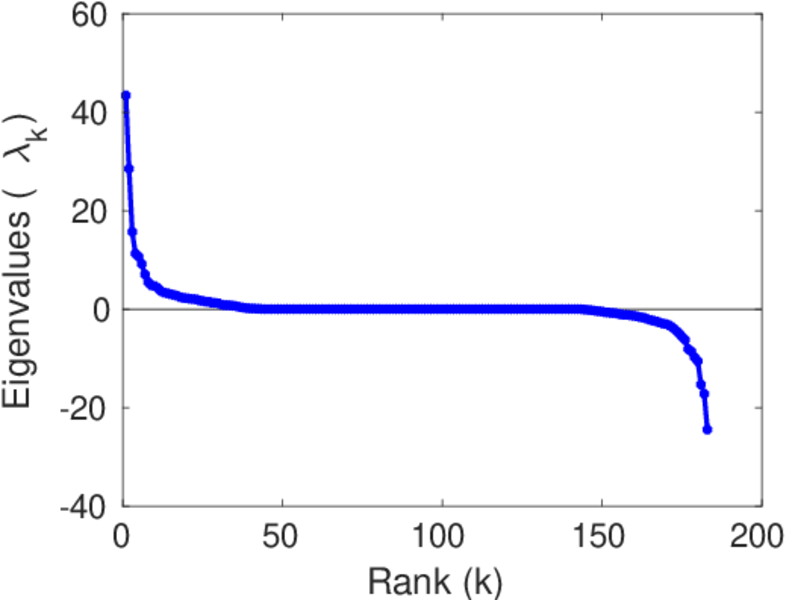
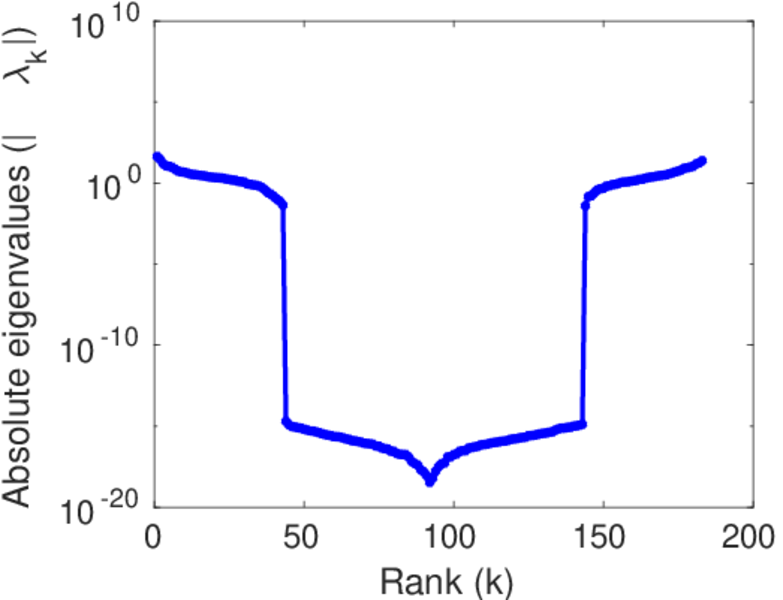
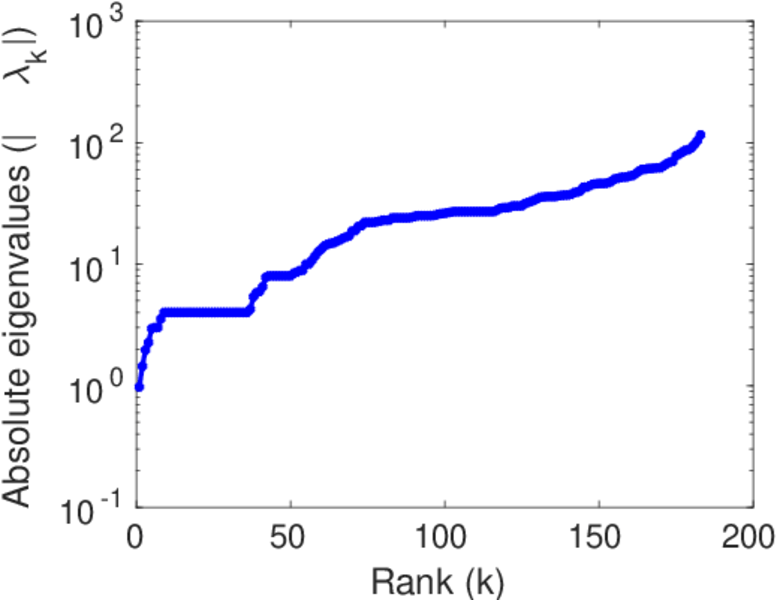
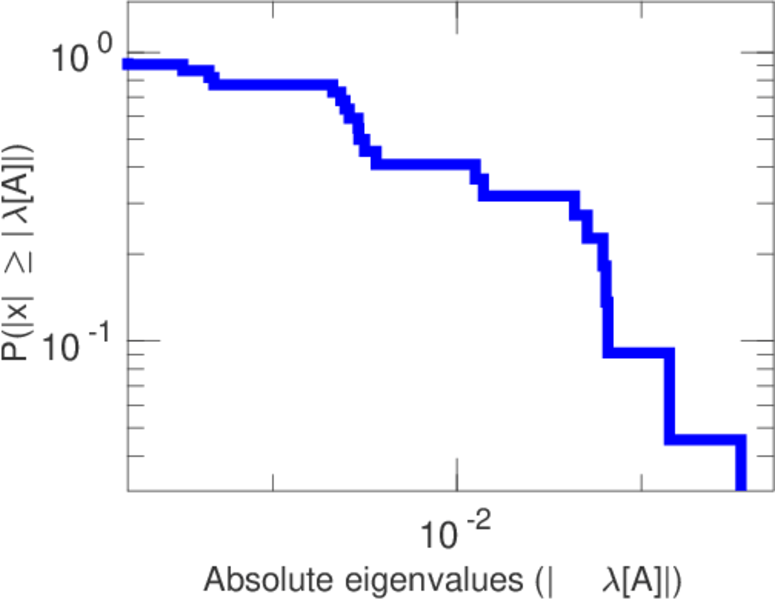
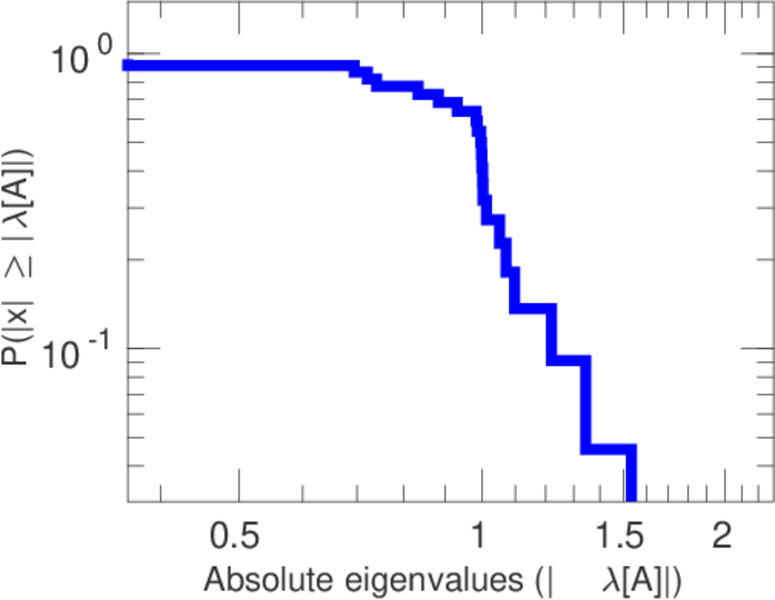
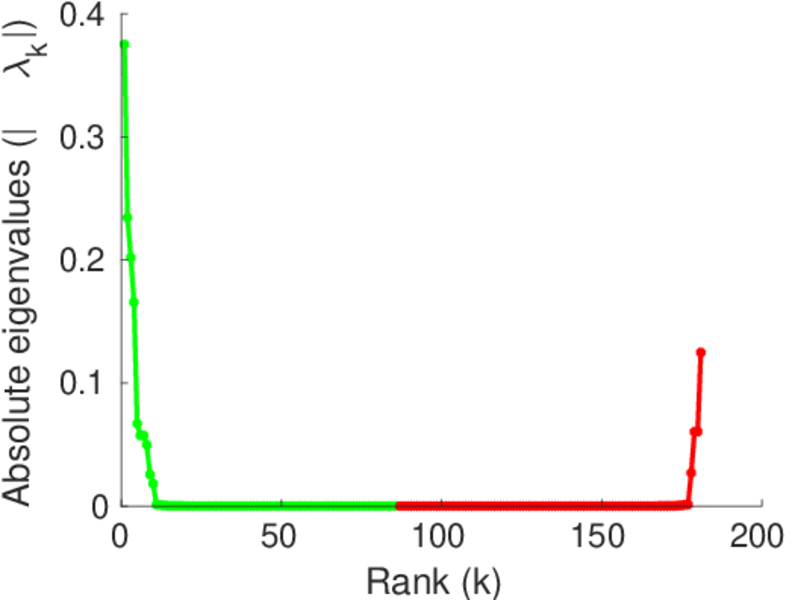
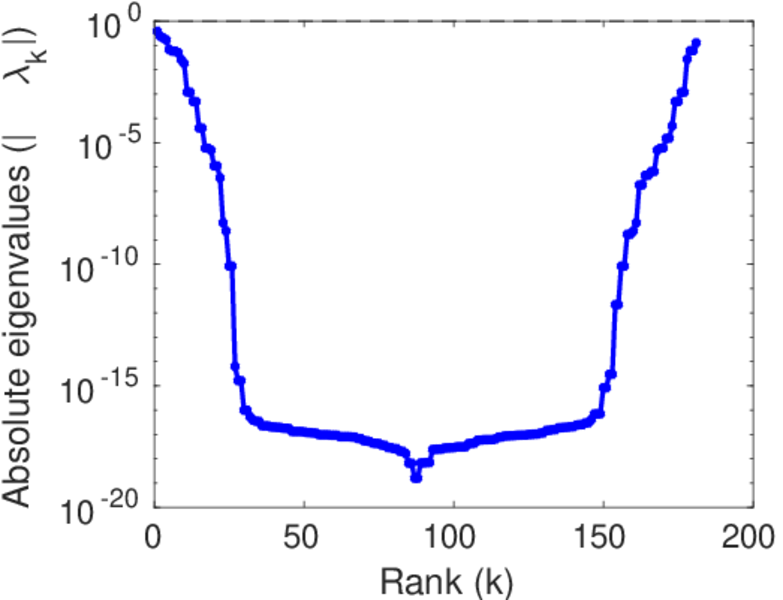
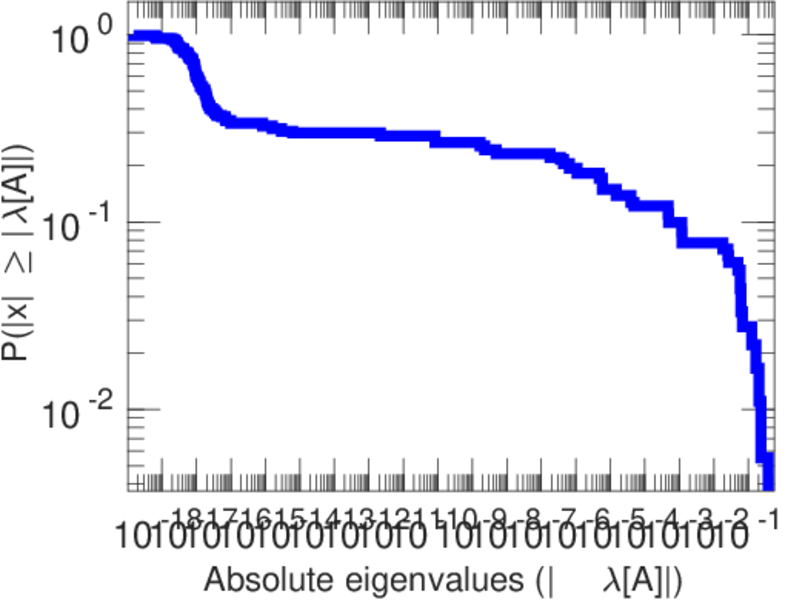
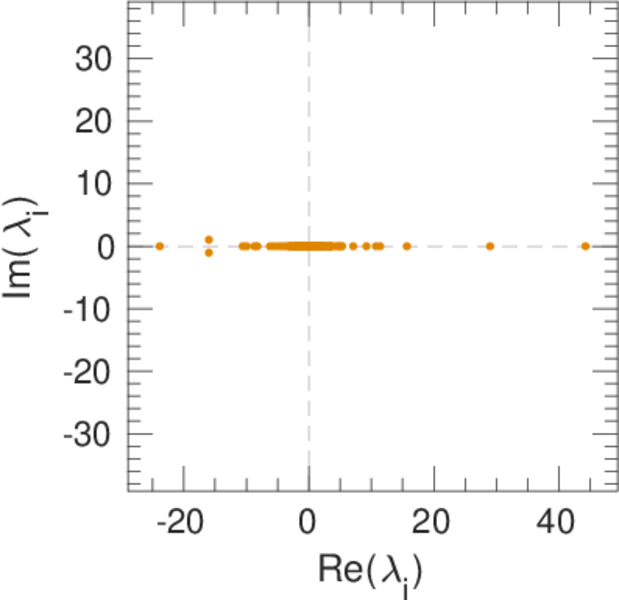
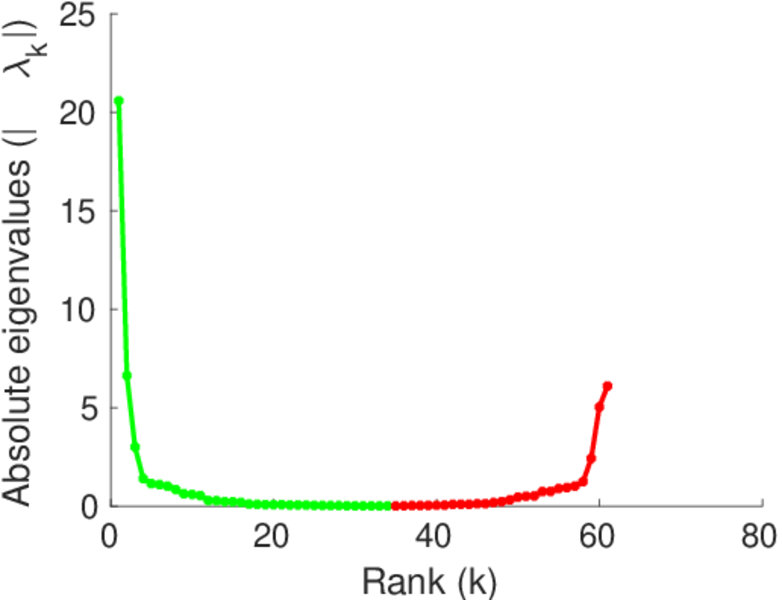
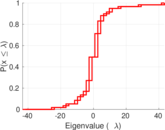
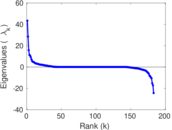
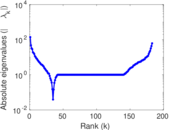
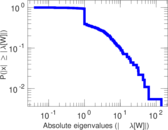
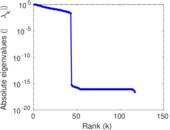
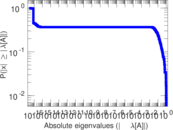
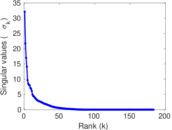
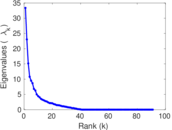
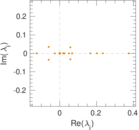
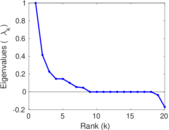
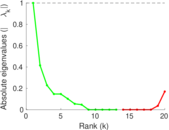
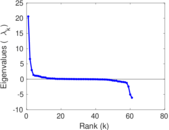
| Spectral norm | α = | 43.386 8
|
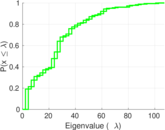
| Operator 2-norm | ν = | 31.170 6
|
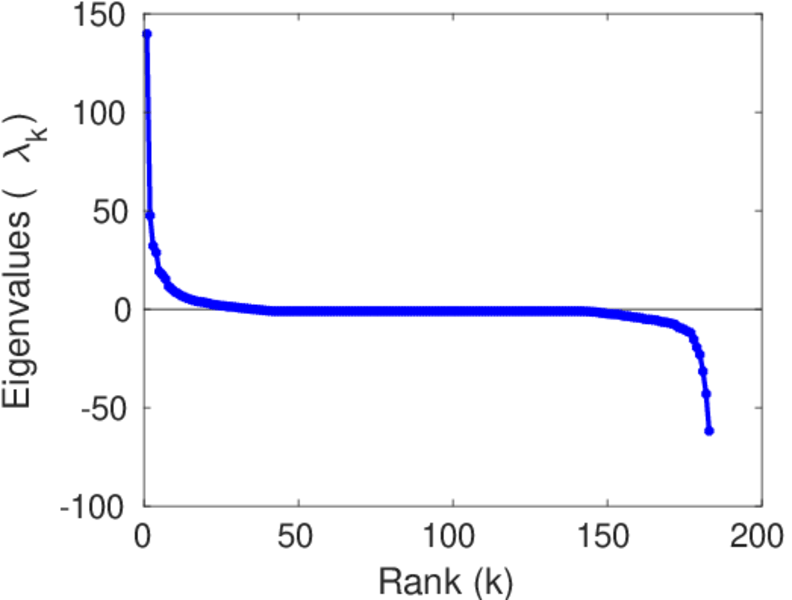
| Cyclic eigenvalue | π = | 7.000 00
|
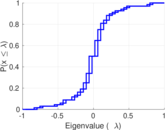
| Algebraic connectivity | a = | 0.979 703
|
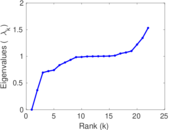
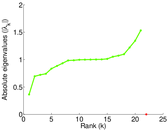
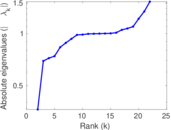
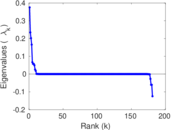
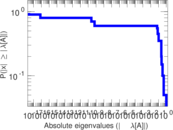
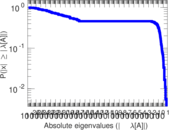
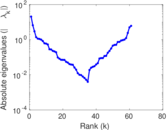
| Spectral separation | |λ1[A] / λ2[A]| = | 1.523 55
|
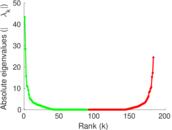
| Reciprocity | y = | 0.040 898 2
|
| Non-bipartivity | bA = | 0.435 995
|
| Normalized non-bipartivity | bN = | 0.184 147
|
| Algebraic non-bipartivity | χ = | 0.974 193
|
| Spectral bipartite frustration | bK = | 0.009 088 36
|
| Controllability | C = | 99
|
| Relative controllability | Cr = | 0.540 984
|
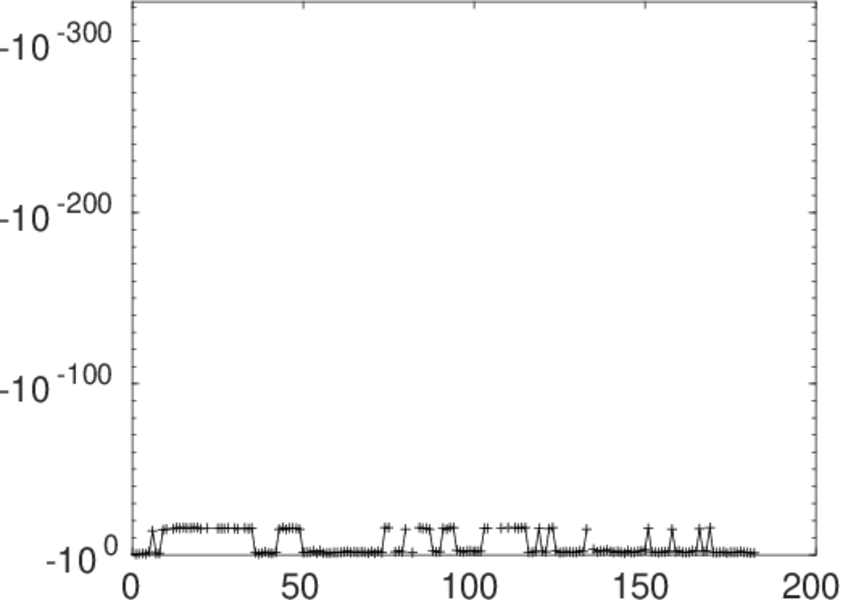
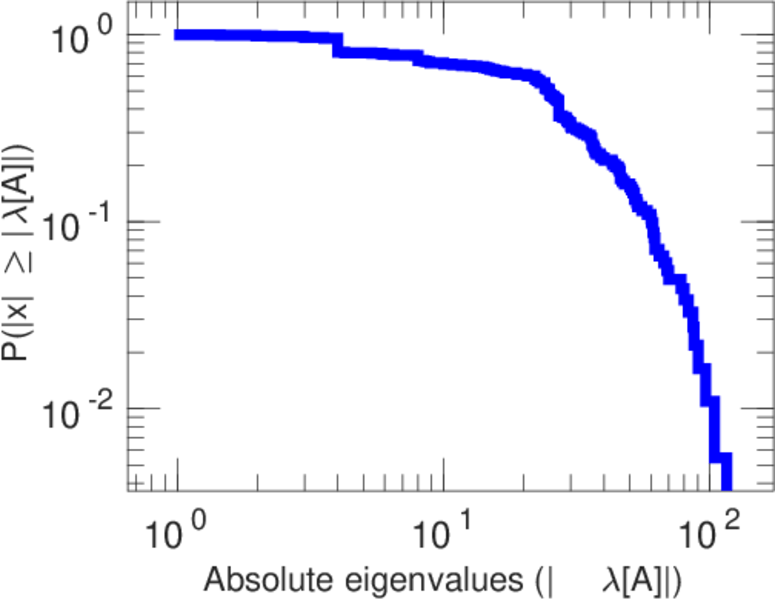
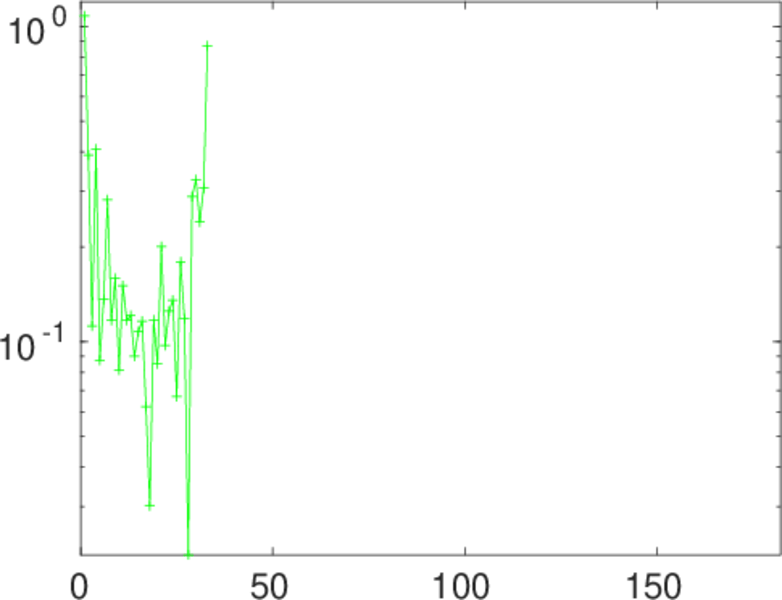
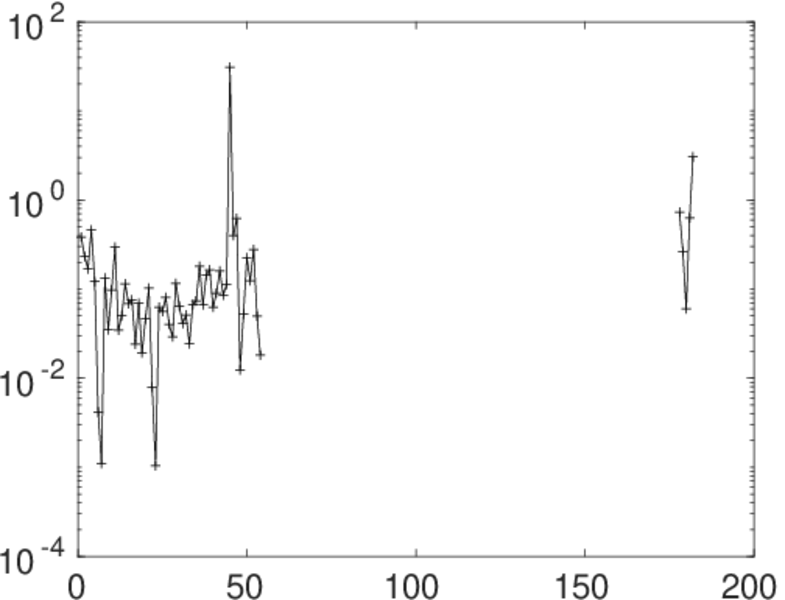
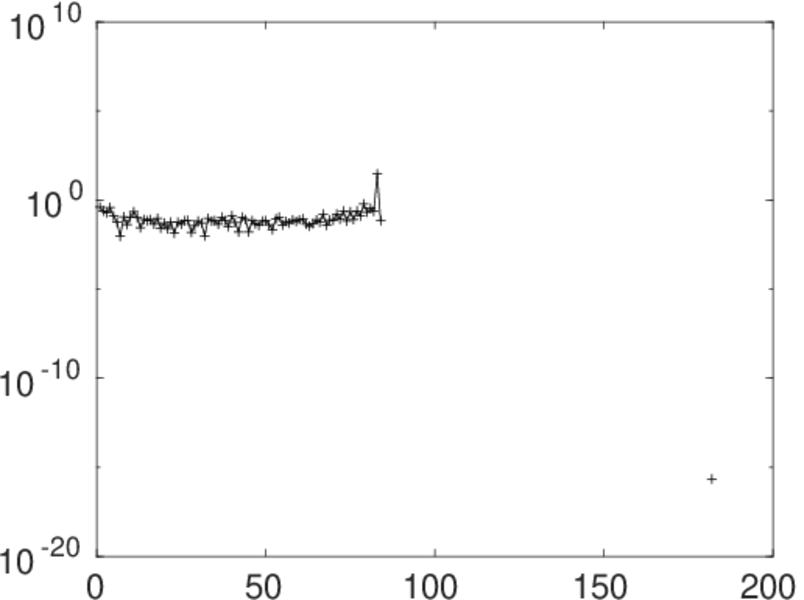
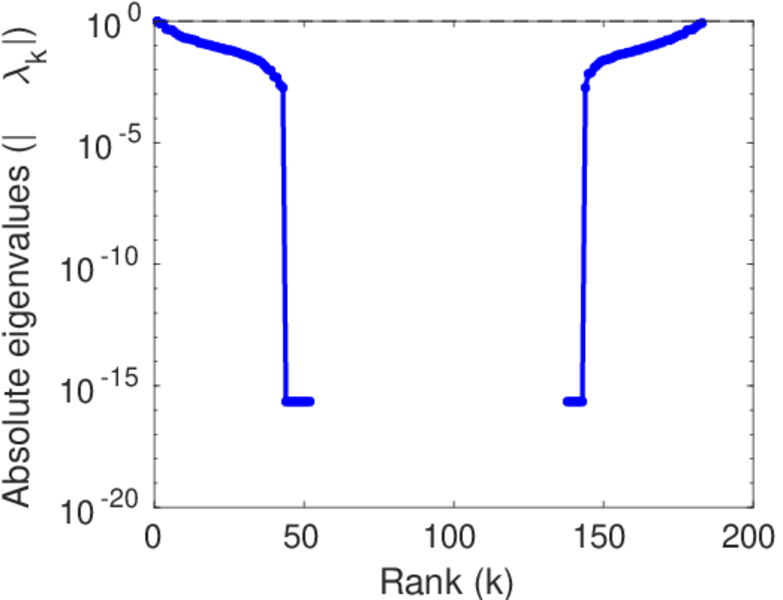
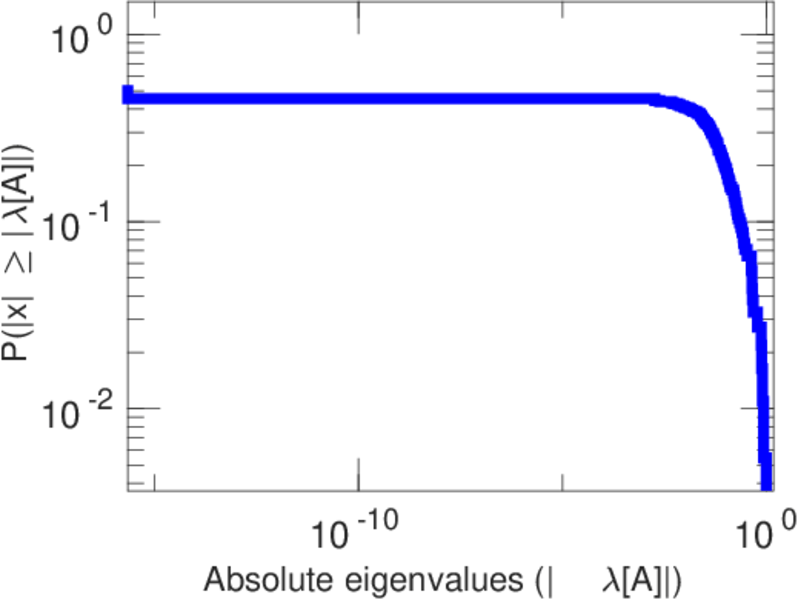
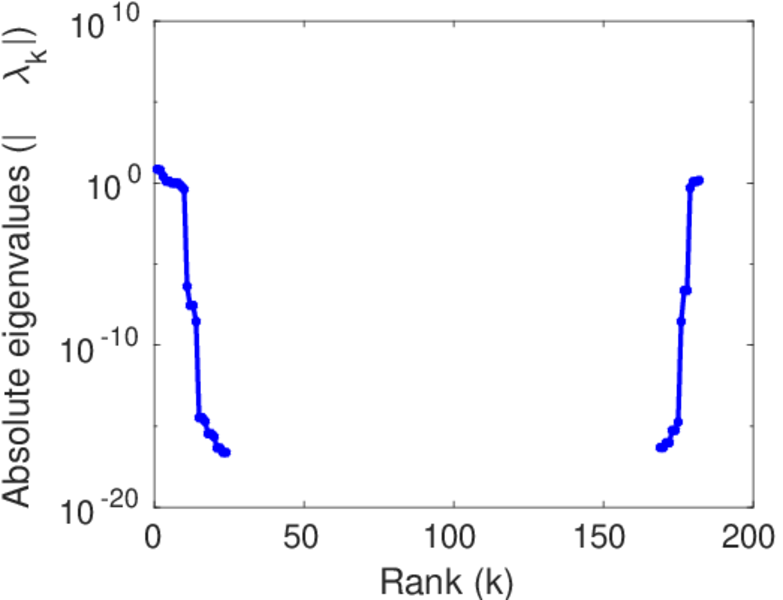
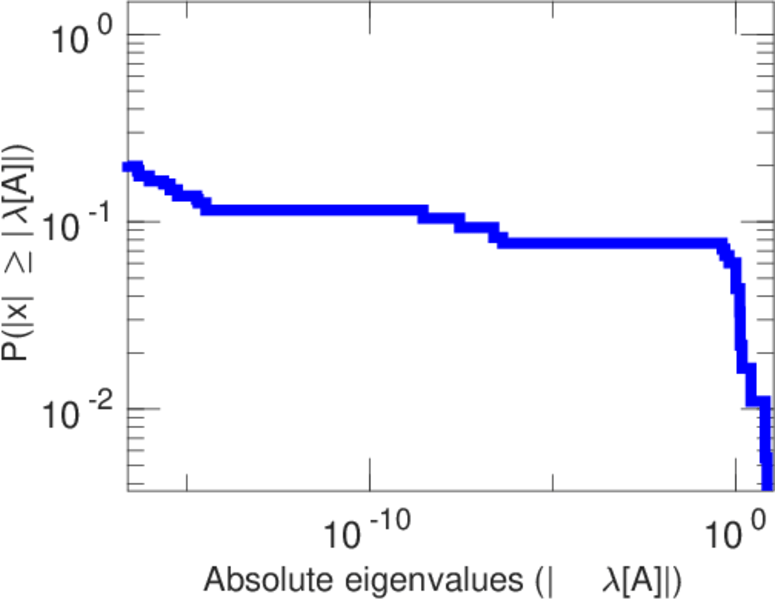
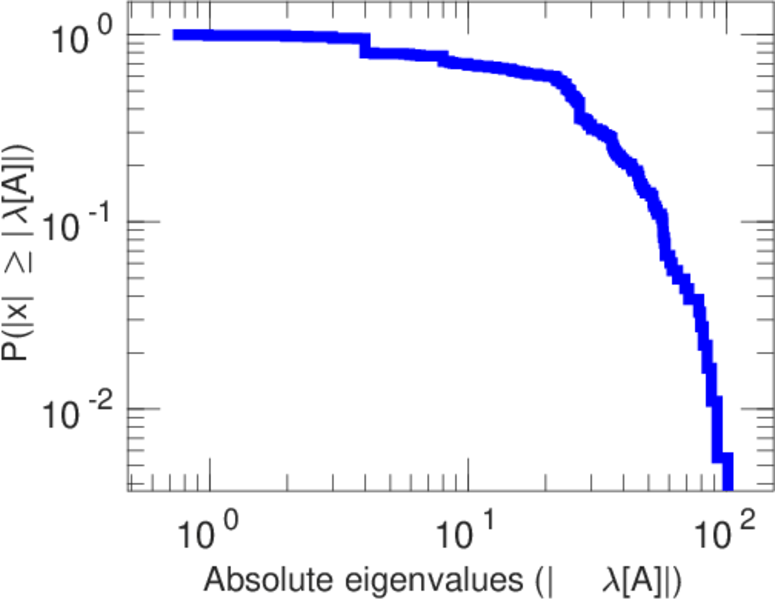
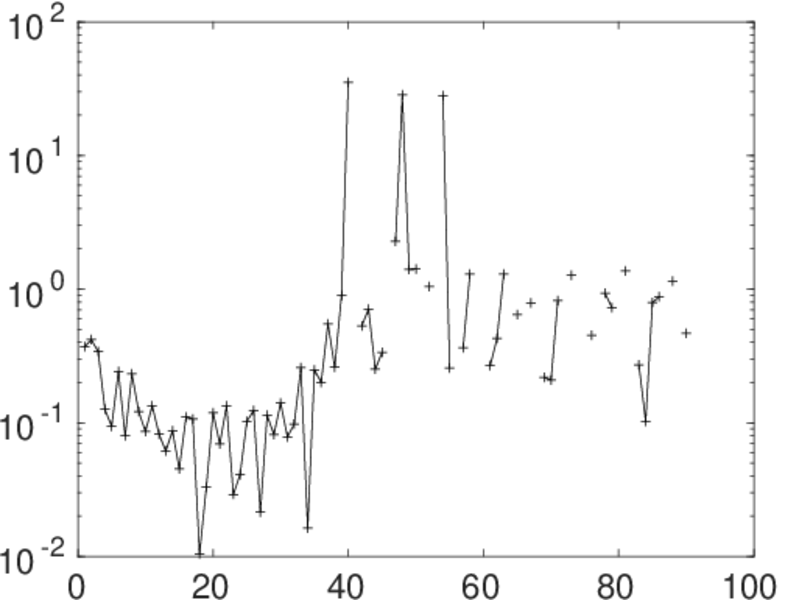
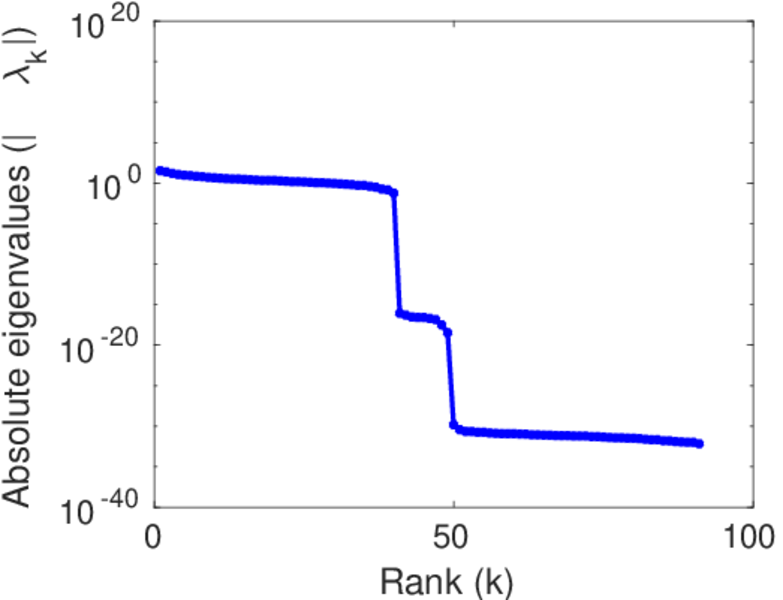
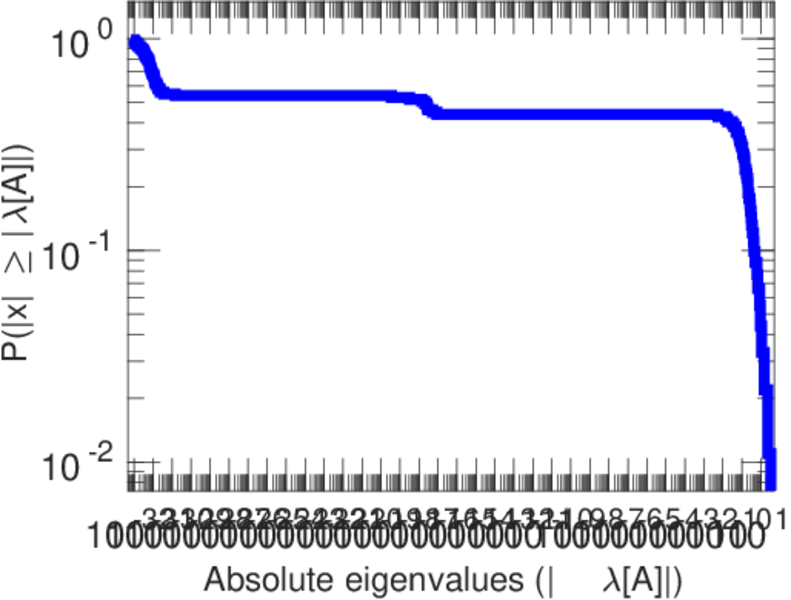
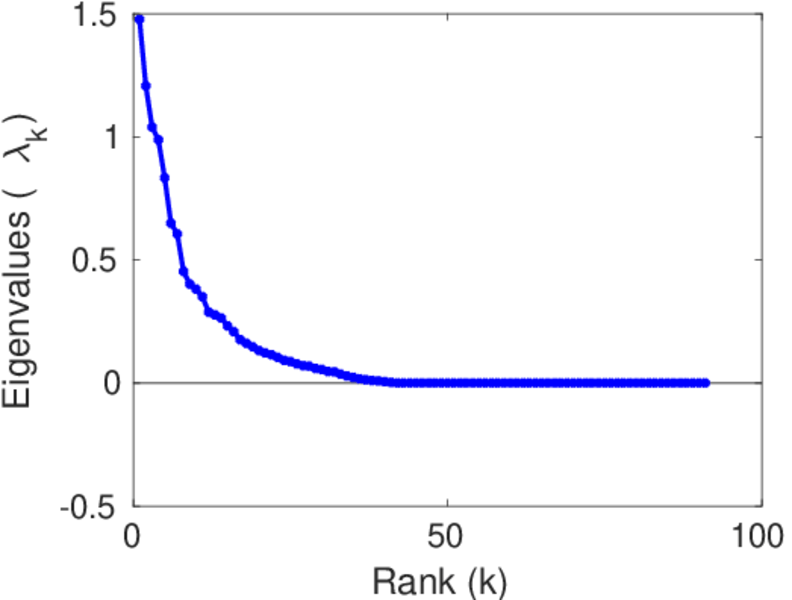
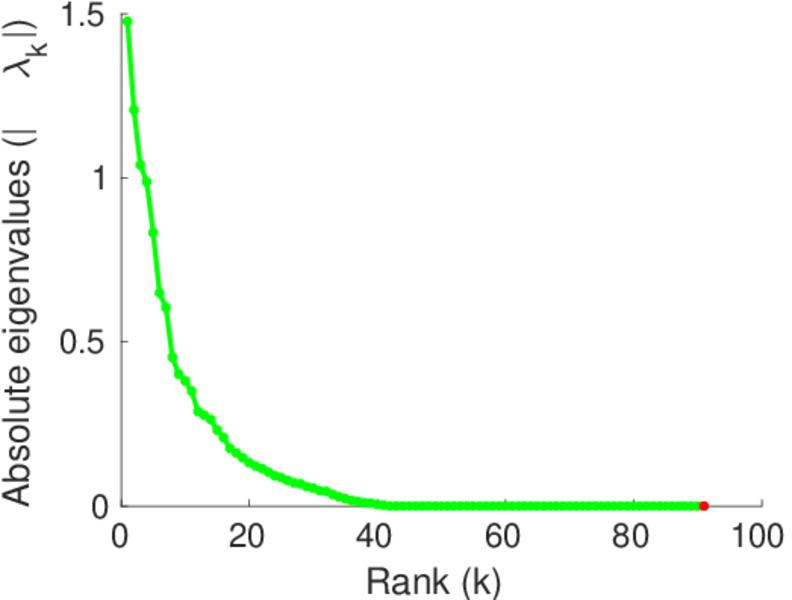
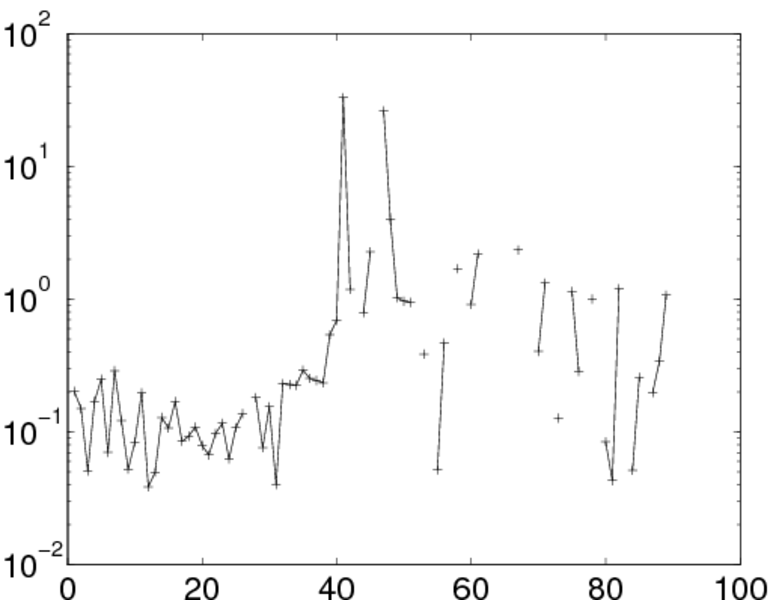
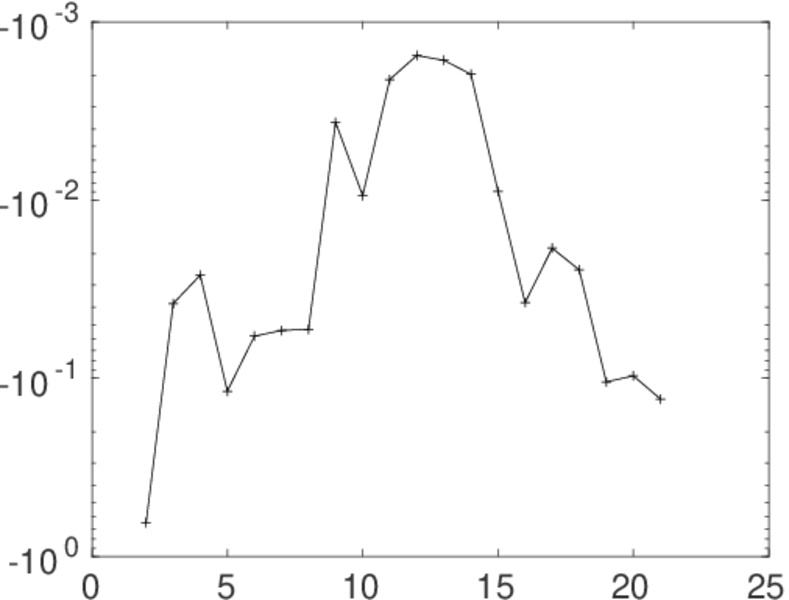
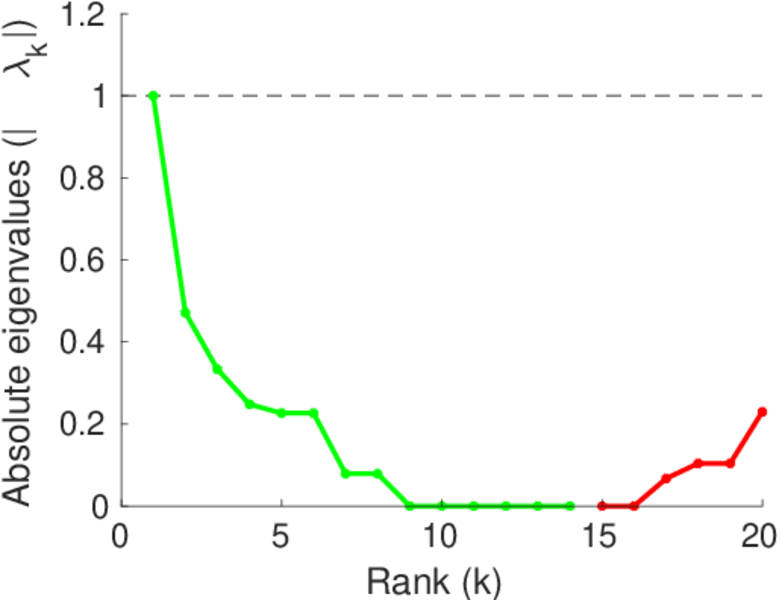
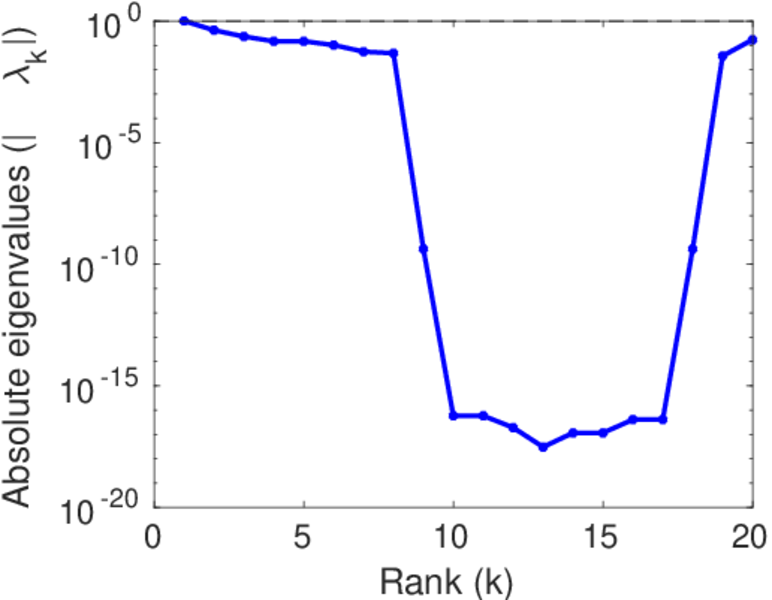
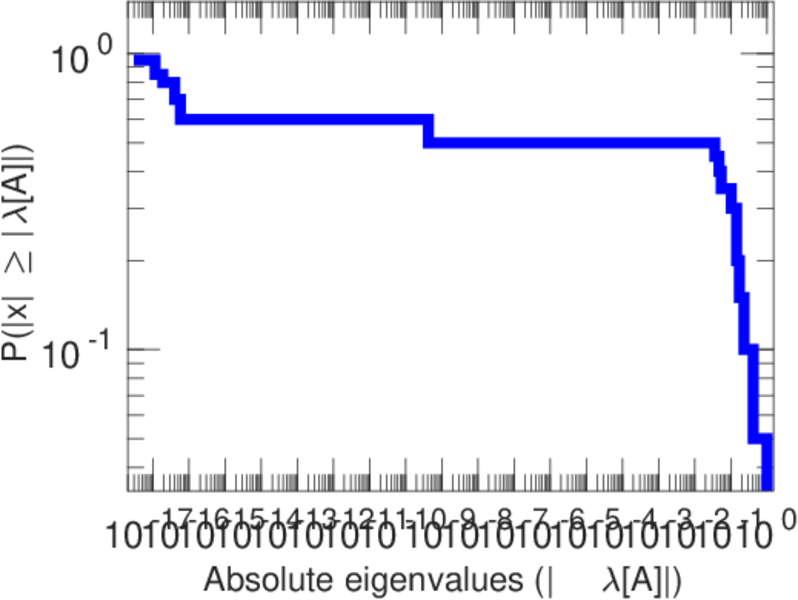
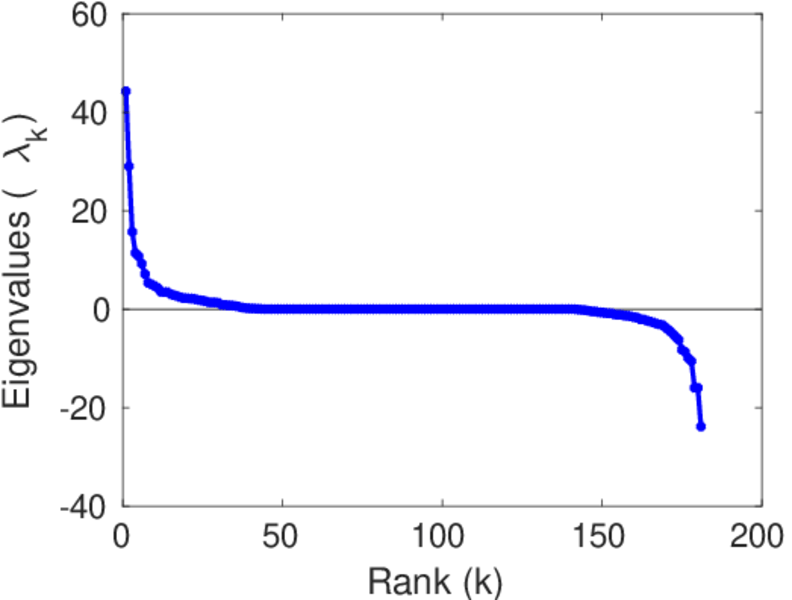
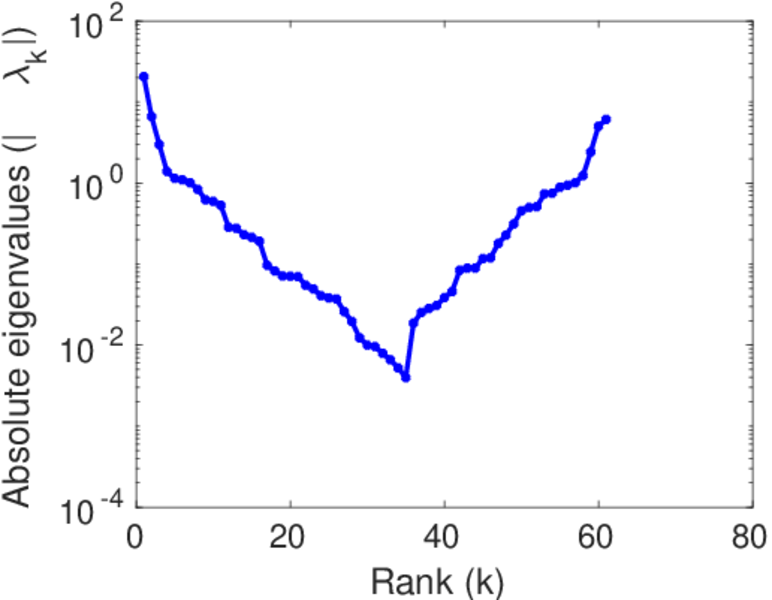
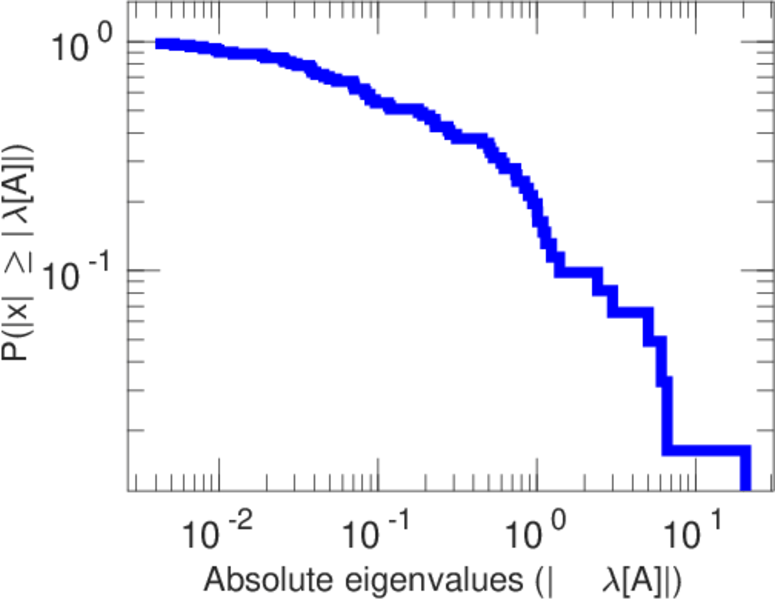
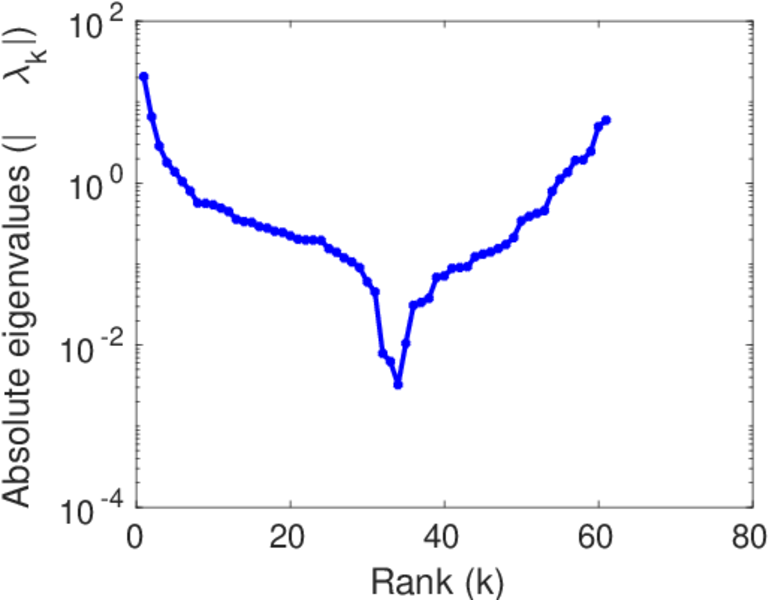
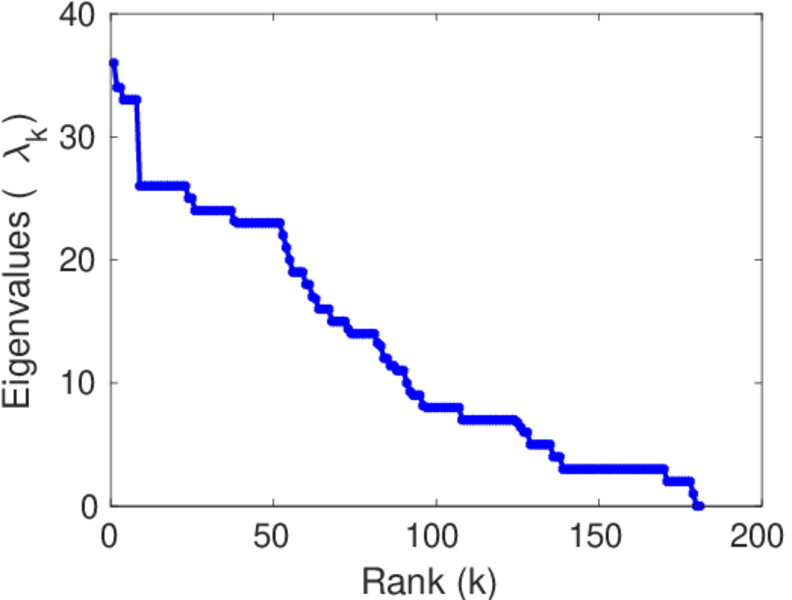
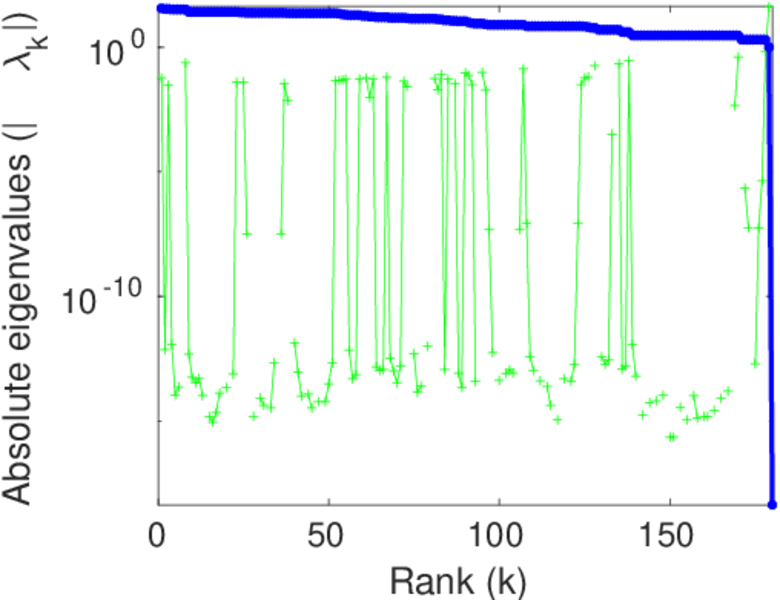
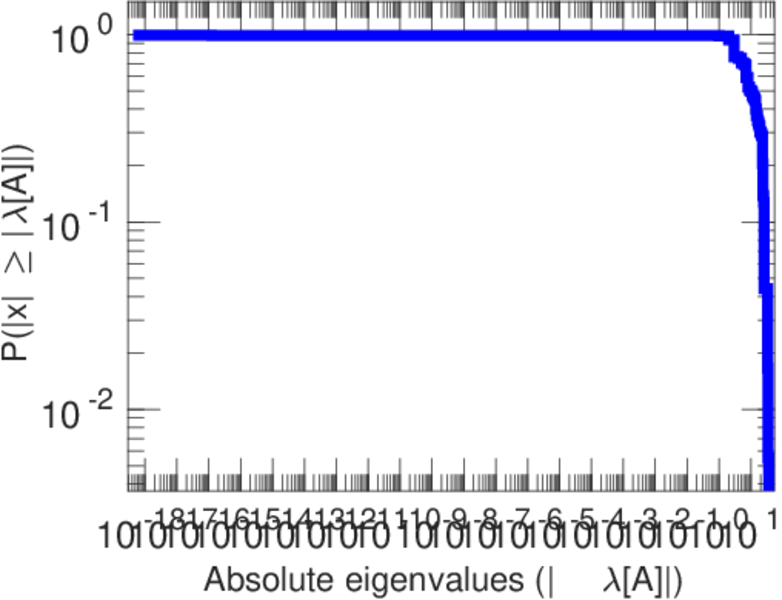
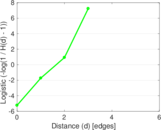
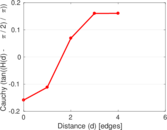
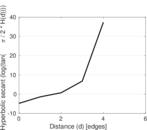
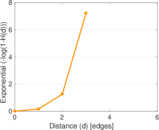
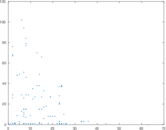
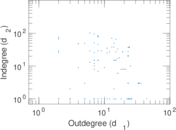
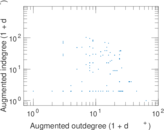
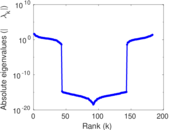
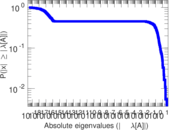
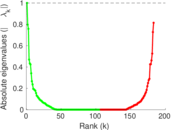
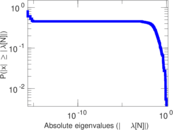
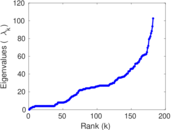
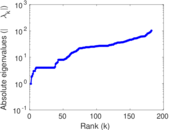
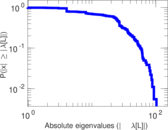
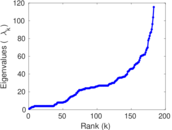
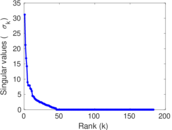
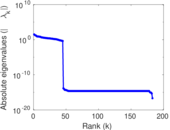
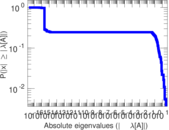
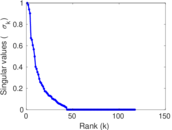
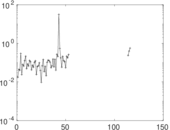
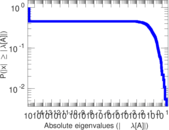
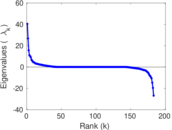
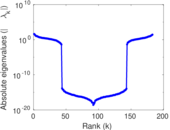
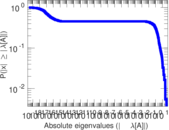
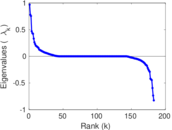
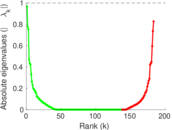
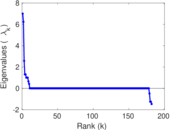
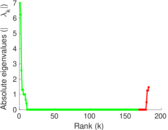
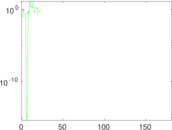
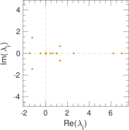
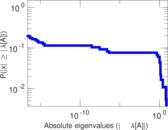
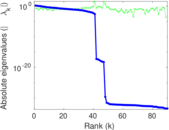
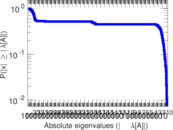
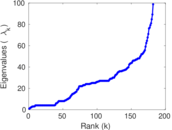
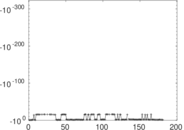
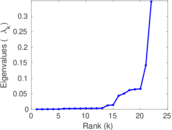
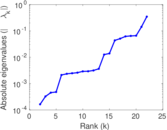
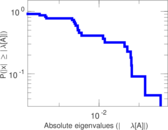
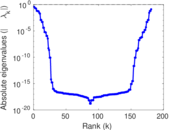
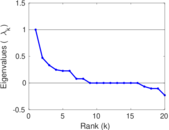
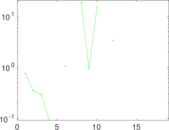
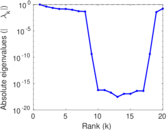
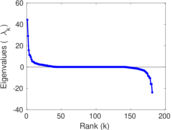
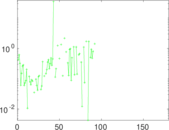
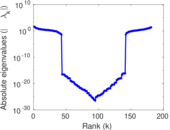
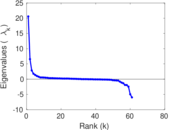
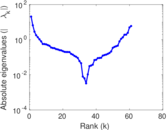
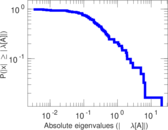
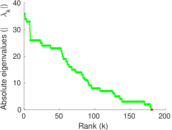
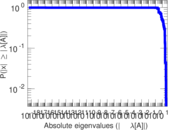
Plots


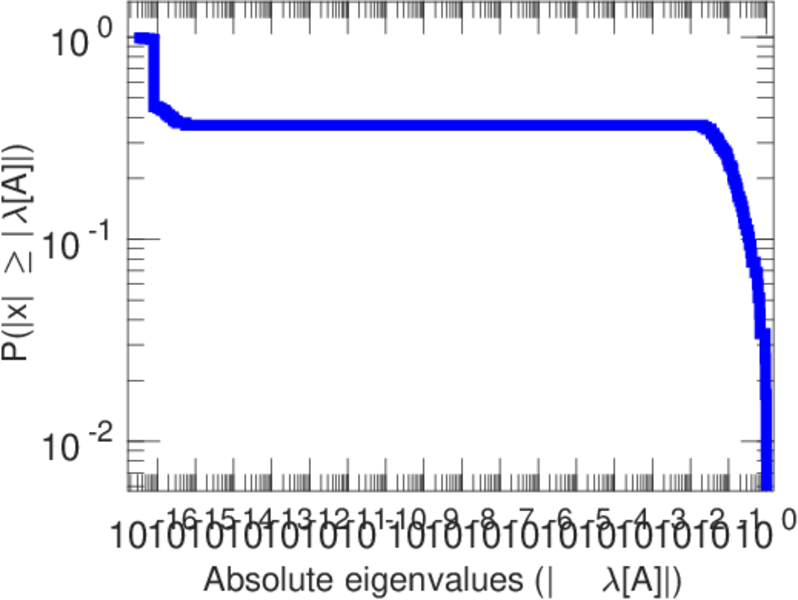
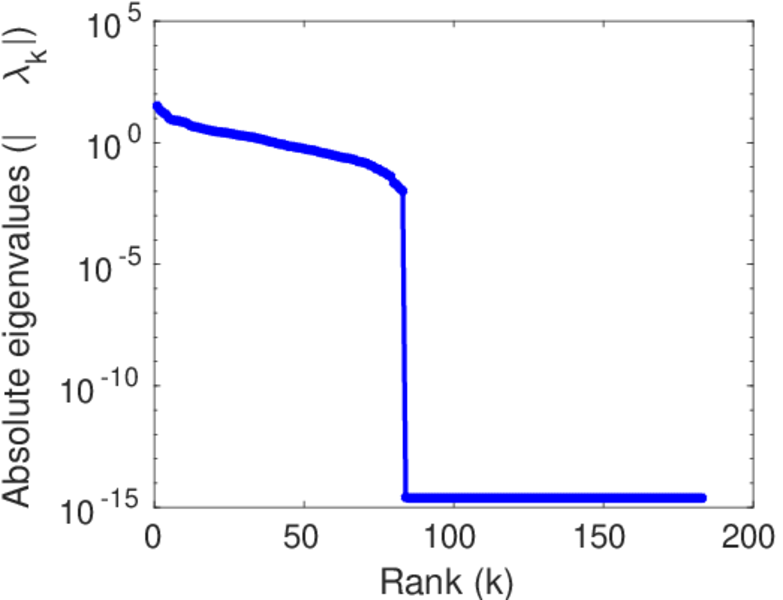
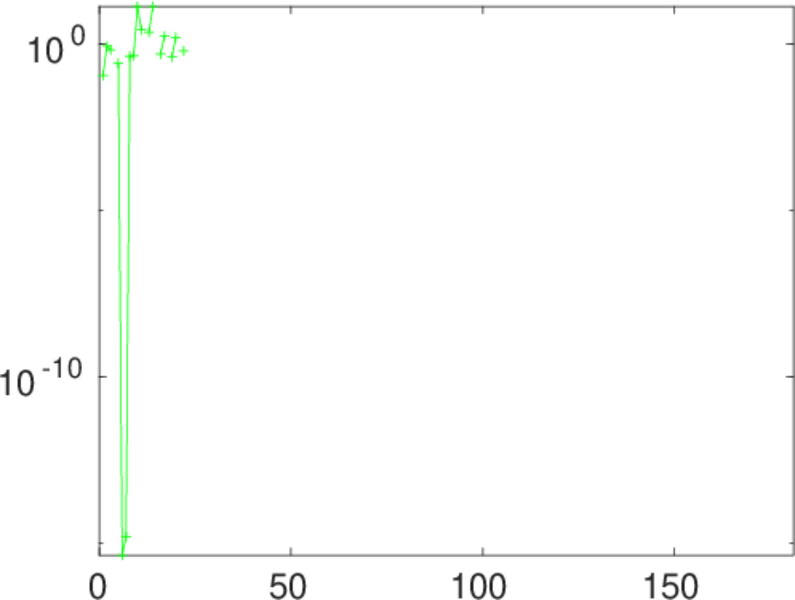
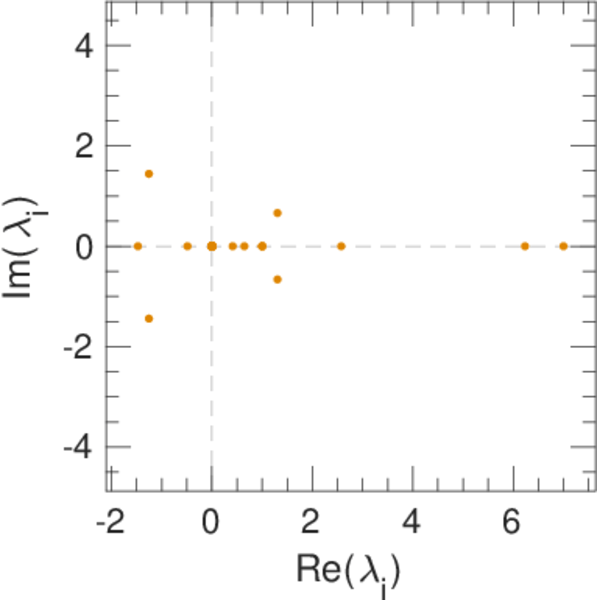
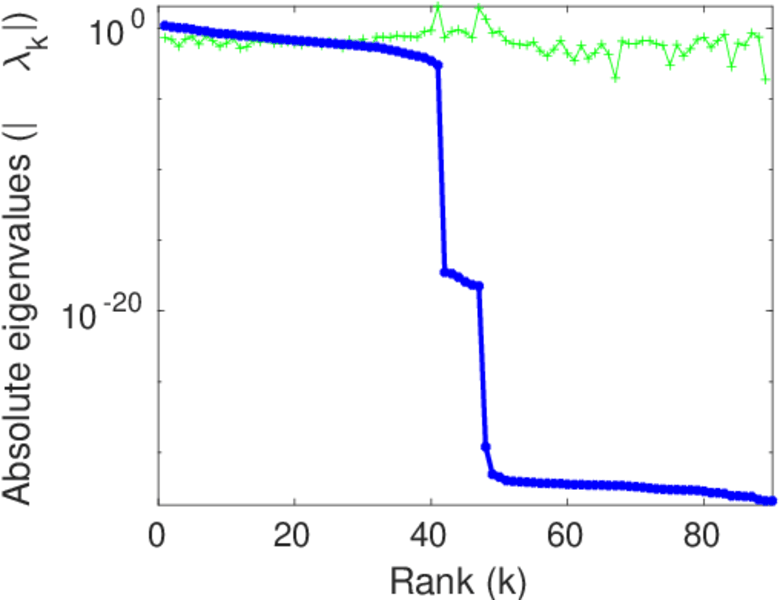
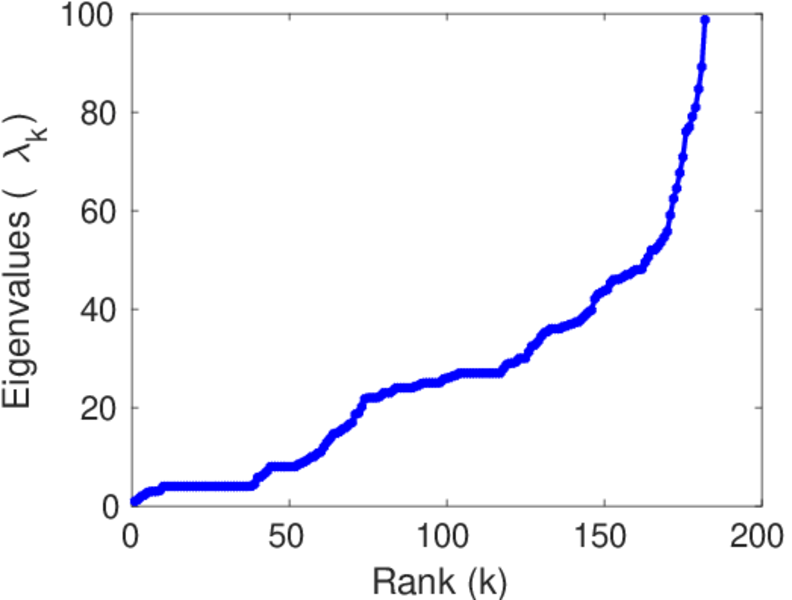
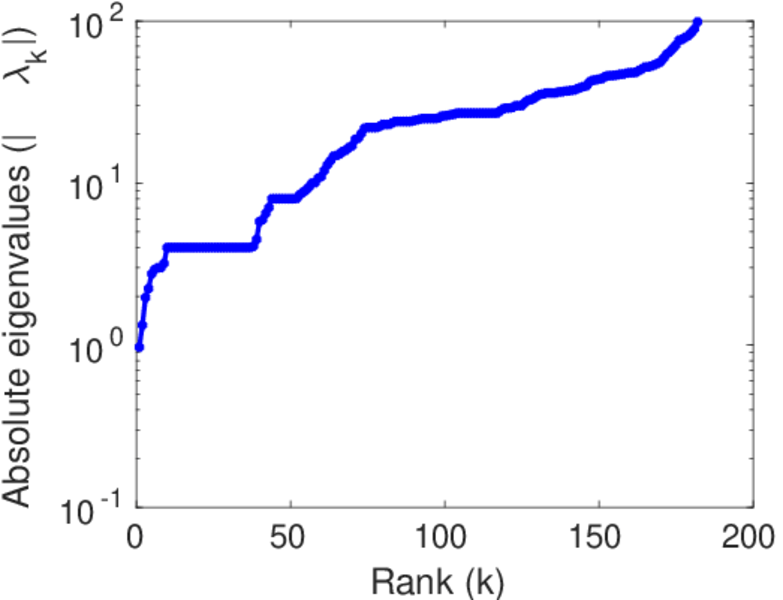
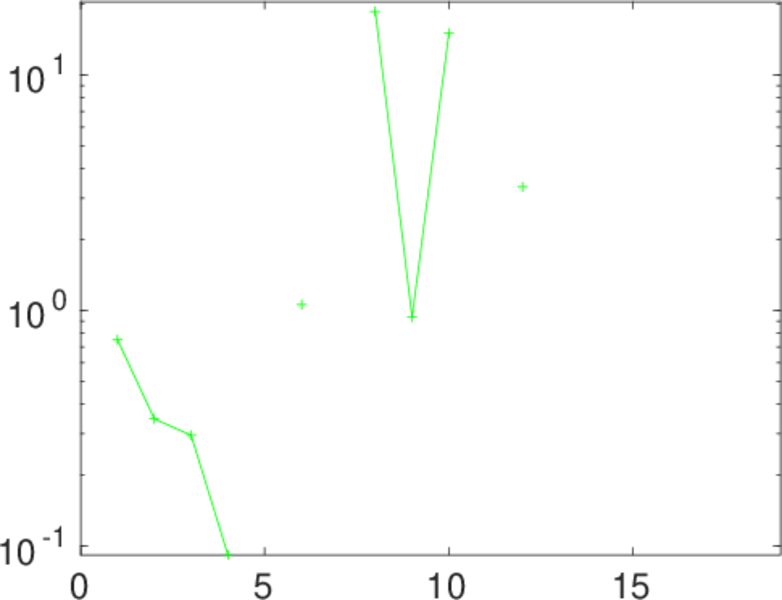
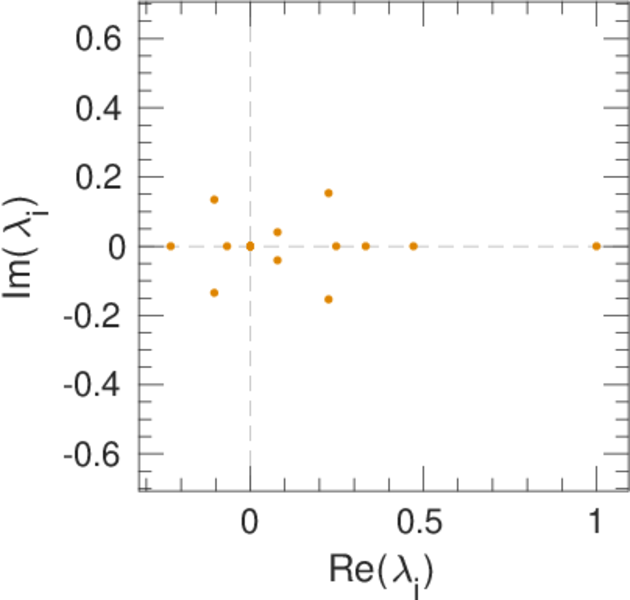
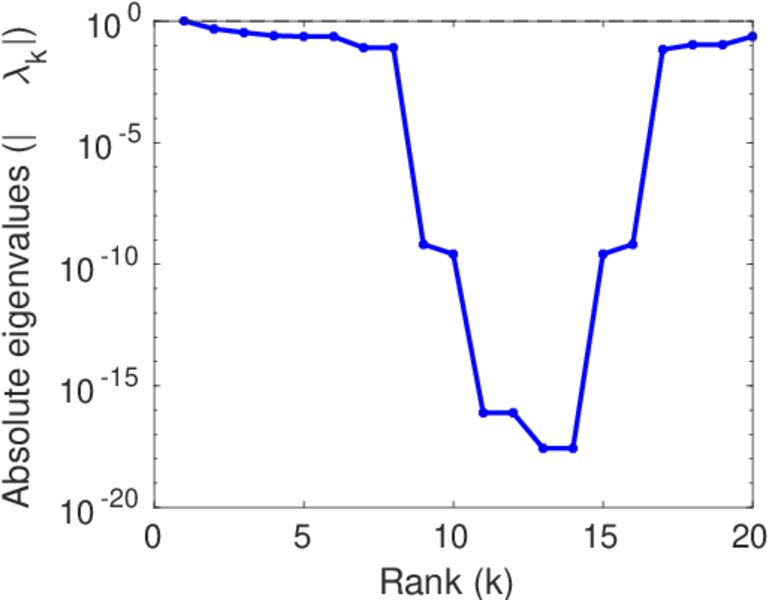
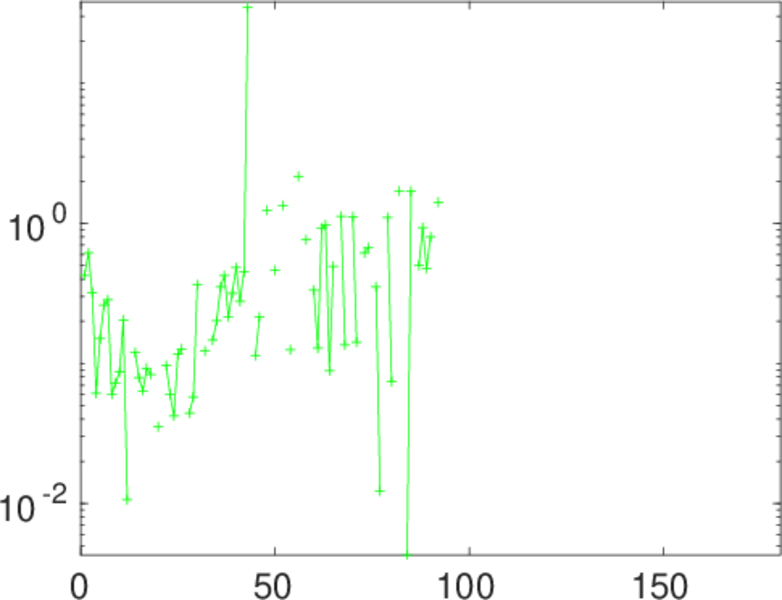
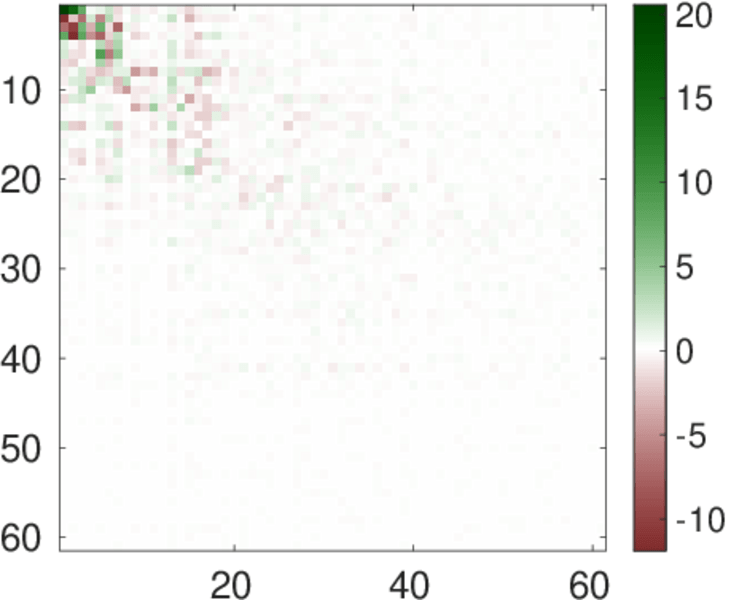
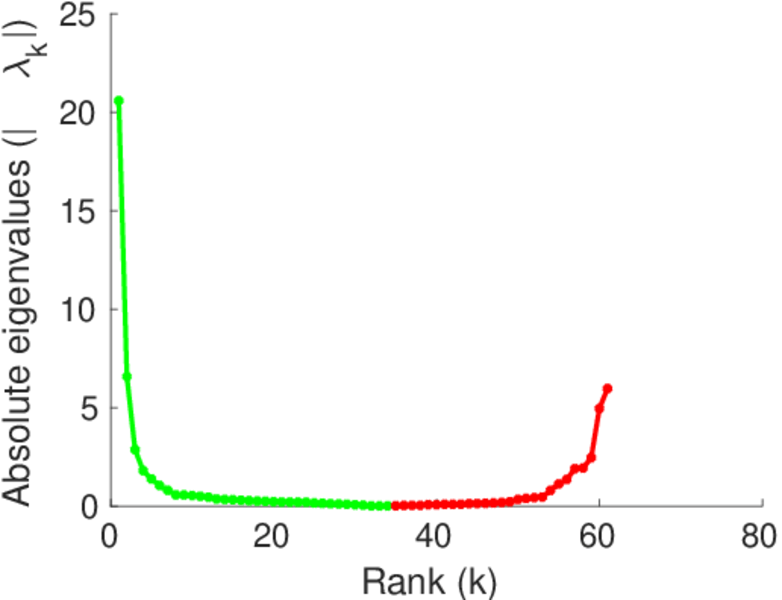
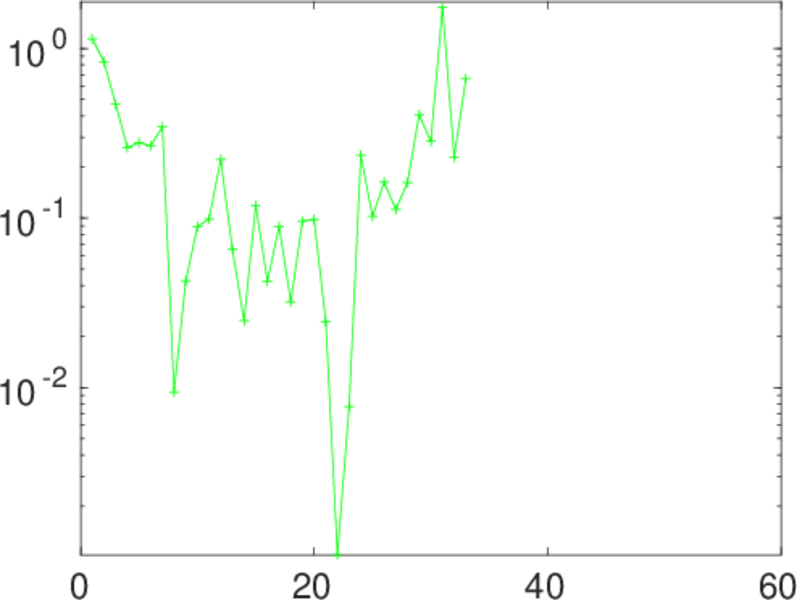
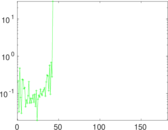
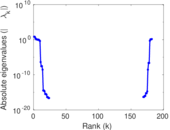
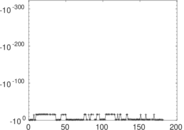
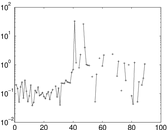
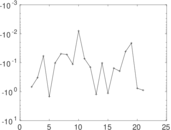
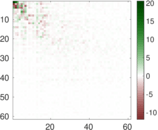
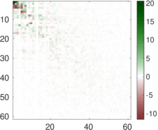
Matrix decompositions plots


Downloads
References
|
[1]
|
Jérôme Kunegis.
KONECT – The Koblenz Network Collection.
In Proc. Int. Conf. on World Wide Web Companion, pages
1343–1350, 2013.
[ http ]
|
|
[2]
|
Neo D. Martinez, John J. Magnuson, Timothy. Kratz, and M. Sierszen.
Artifacts or attributes? effects of resolution on the Little Rock
Lake food web.
Ecol. Monographs, 61:367–392, 1991.
|
 KONECT ‣ Networks ‣
Buy Me a Coffee
KONECT ‣ Networks ‣
Buy Me a Coffee