Crime

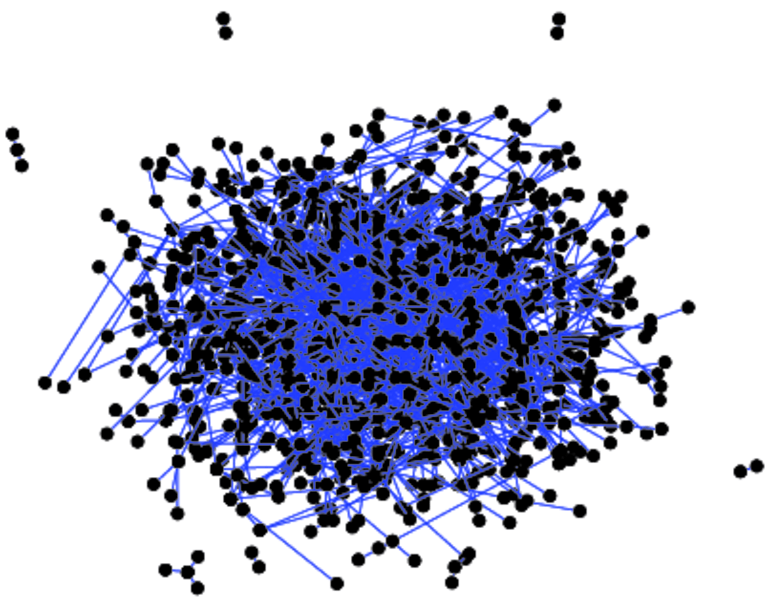
This bipartite network contains persons who appeared in at least one crime case as either a suspect, a victim, a witness or both a suspect and victim at the same time. A left node represents a person and a right node represents a crime. An edge between two nodes shows that the left node was involved in the crime represented by the right node.

Metadata

CodeMC
Internal namemoreno_crime
NameCrime
Data sourcehttp://moreno.ss.uci.edu/data.html#crime
AvailabilityDataset is available for download
Consistency checkDataset passed all tests
Category
Interaction network
Node meaningPerson, crime
Edge meaningInvolvment
Network formatBipartite, undirected
Edge typeUnweighted, no multiple edges

Statistics

Size n =1,380
Left size n1 =829
Right size n2 =551
Volume m =1,476
Wedge count s =4,816
Claw count z =12,667
Cross count x =39,133
Square count q =143
4-Tour count T4 =23,424
Maximum degree dmax =25
Maximum left degree d1max =25
Maximum right degree d2max =18
Average degree d =2.139 13
Average left degree d1 =1.780 46
Average right degree d2 =2.678 77
Fill p =0.003 231 32
Size of LCC N =1,260
Diameter δ =32
50-Percentile effective diameter δ0.5 =12.851 7
90-Percentile effective diameter δ0.9 =19.474 5
Median distance δM =13
Mean distance δm =13.368 7
Gini coefficient G =0.403 524
Balanced inequality ratio P =0.349 932
Left balanced inequality ratio P1 =0.359 079
Right balanced inequality ratio P2 =0.371 951
Relative edge distribution entropy Her =0.956 503
Power law exponent γ =3.008 15
Tail power law exponent γt =3.901 00
Tail power law exponent with p γ3 =3.901 00
p-value p =0.756 000
Left tail power law exponent with p γ3,1 =2.451 00
Left p-value p1 =0.137 000
Right tail power law exponent with p γ3,2 =3.591 00
Right p-value p2 =0.363 000
Degree assortativity ρ =−0.183 074
Degree assortativity p-value pρ =1.365 51 × 10−12
Spectral norm α =5.586 85
Algebraic connectivity a =0.001 541 74
Spectral separation 1[A] / λ2[A]| =1.082 35
Controllability C =480
Relative controllability Cr =0.347 826

Plots

Fruchterman–Reingold graph drawing

Degree distribution

Cumulative degree distribution

Lorenz curve

Spectral distribution of the adjacency matrix

Spectral distribution of the normalized adjacency matrix

Spectral distribution of the Laplacian

Spectral graph drawing based on the adjacency matrix

Spectral graph drawing based on the Laplacian

Spectral graph drawing based on the normalized adjacency matrix

Degree assortativity

Zipf plot

Hop distribution

Double Laplacian graph drawing

Delaunay graph drawing

Matrix decompositions plots

Downloads

References

[1] Jérôme Kunegis. KONECT – The Koblenz Network Collection. In Proc. Int. Conf. on World Wide Web Companion, pages 1343–1350, 2013. [ http ]