Southern women (large)

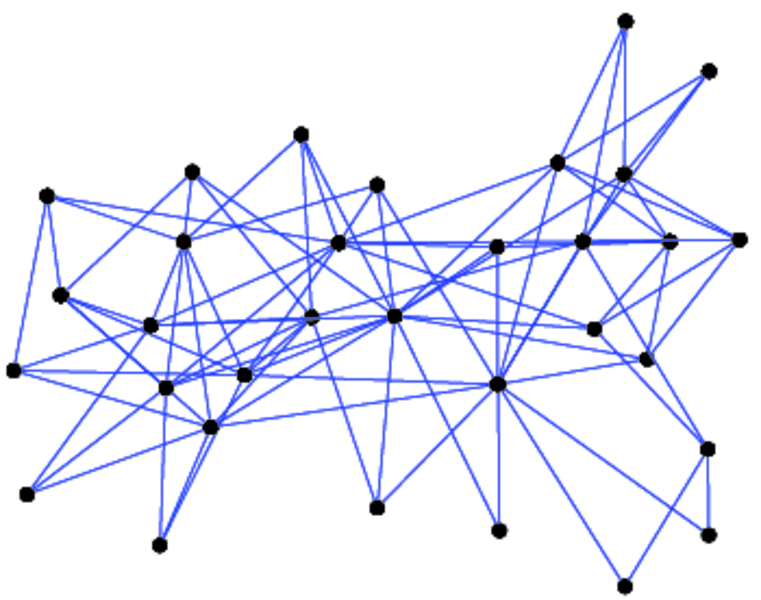
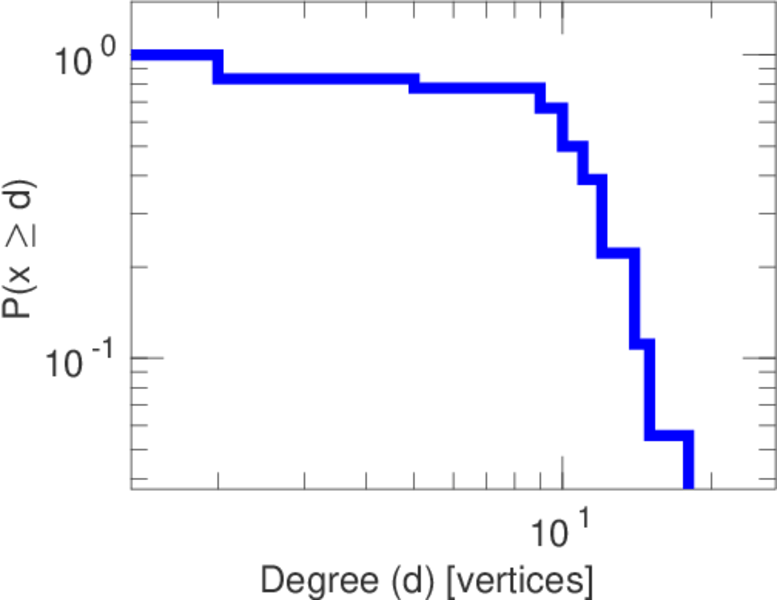
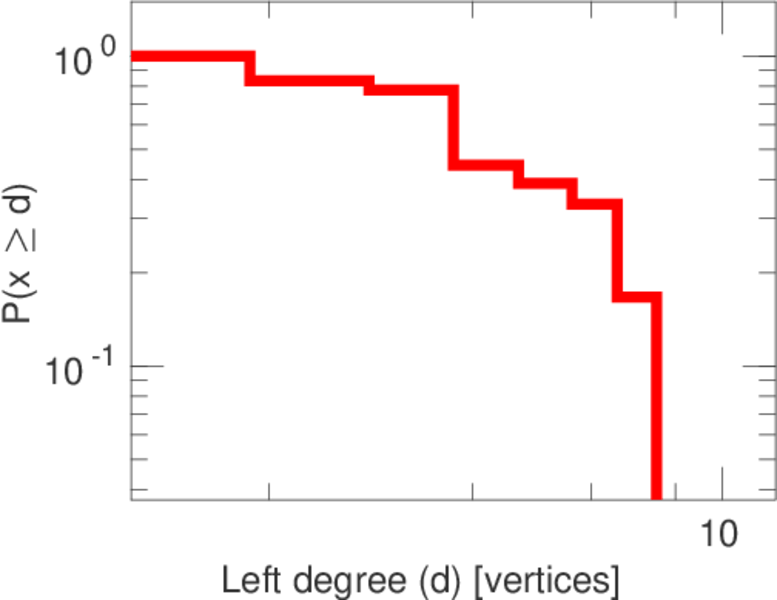
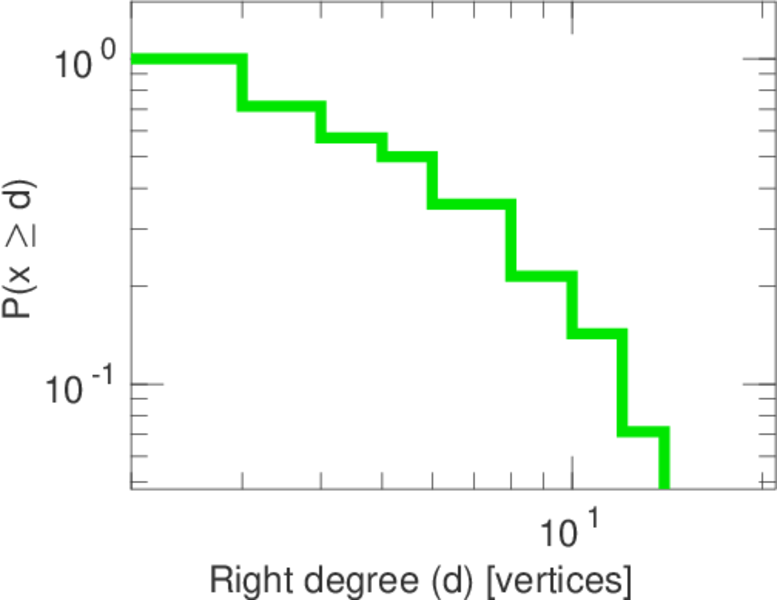
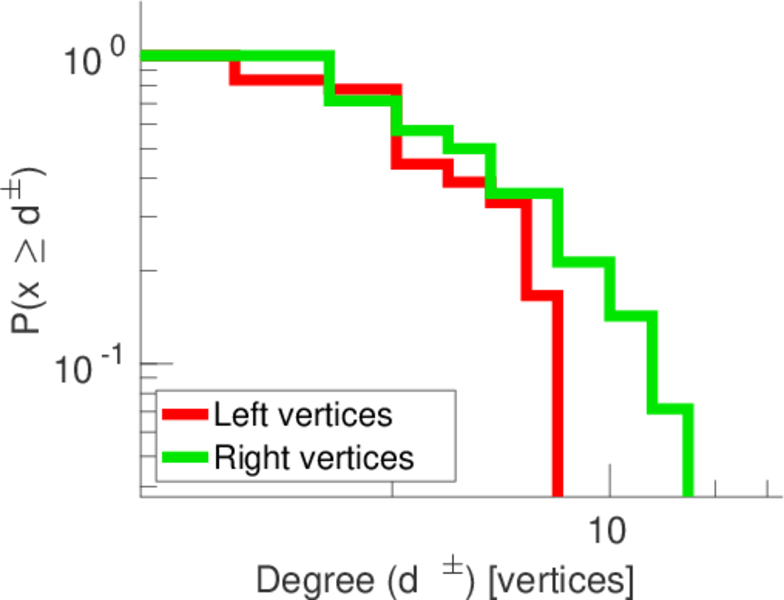
This bipartite dataset shows the participation of 18 white women in 14 social events over a nine-month period. The data was collected in the Southern United States of America in the 1930s. There is an edge for every woman who participates in an event. The first column contains the women, the second column contains the events.

Metadata

CodeSW
Internal nameopsahl-southernwomen
NameSouthern women (large)
Data sourcehttp://toreopsahl.com/datasets/#southernwomen
AvailabilityDataset is available for download
Consistency checkDataset passed all tests
Category
Interaction network
Node meaningWoman, event
Edge meaningParticipation
Network formatBipartite, undirected
Edge typeUnweighted, no multiple edges
Snapshot Is a snapshot and likely to not contain all data
Join Is the join of an underlying network

Statistics

Size n =32
Left size n1 =18
Right size n2 =14
Volume m =89
Wedge count s =397
Claw count z =1,206
Cross count x =2,224
Square count q =341
4-Tour count T4 =5,050
Maximum degree dmax =14
Maximum left degree d1max =8
Maximum right degree d2max =14
Average degree d =5.562 50
Average left degree d1 =4.944 44
Average right degree d2 =6.357 14
Fill p =0.353 175
Size of LCC N =32
Diameter δ =5
50-Percentile effective diameter δ0.5 =1.943 40
90-Percentile effective diameter δ0.9 =3.151 88
Median distance δM =2
Mean distance δm =2.413 41
Gini coefficient G =0.244 694
Balanced inequality ratio P =0.393 258
Left balanced inequality ratio P1 =0.370 787
Right balanced inequality ratio P2 =0.348 315
Relative edge distribution entropy Her =0.964 788
Power law exponent γ =2.113 52
Tail power law exponent γt =4.691 00
Tail power law exponent with p γ3 =4.691 00
p-value p =0.103 000
Left tail power law exponent with p γ3,1 =8.991 00
Left p-value p1 =0.174 000
Right tail power law exponent with p γ3,2 =2.291 00
Right p-value p2 =0.303 000
Degree assortativity ρ =−0.278 319
Degree assortativity p-value pρ =0.008 267 82
Spectral norm α =6.741 91
Algebraic connectivity a =0.932 001
Spectral separation 1[A] / λ2[A]| =1.539 21
Controllability C =4
Relative controllability Cr =0.125 000

Plots

Fruchterman–Reingold graph drawing

Degree distribution

Cumulative degree distribution

Lorenz curve

Spectral distribution of the adjacency matrix

Spectral distribution of the normalized adjacency matrix

Spectral distribution of the Laplacian

Spectral graph drawing based on the adjacency matrix

Spectral graph drawing based on the Laplacian

Spectral graph drawing based on the normalized adjacency matrix

Degree assortativity

Zipf plot

Hop distribution

Double Laplacian graph drawing

Delaunay graph drawing

Matrix decompositions plots

Downloads

References

[1] Jérôme Kunegis. KONECT – The Koblenz Network Collection. In Proc. Int. Conf. on World Wide Web Companion, pages 1343–1350, 2013. [ http ]
[2] Allison Davis, Burleigh B. Gardner, and Mary R. Gardner. Deep South; a Social Anthropological Study of Caste and Class. The Univ. of Chicago Press, 1941.