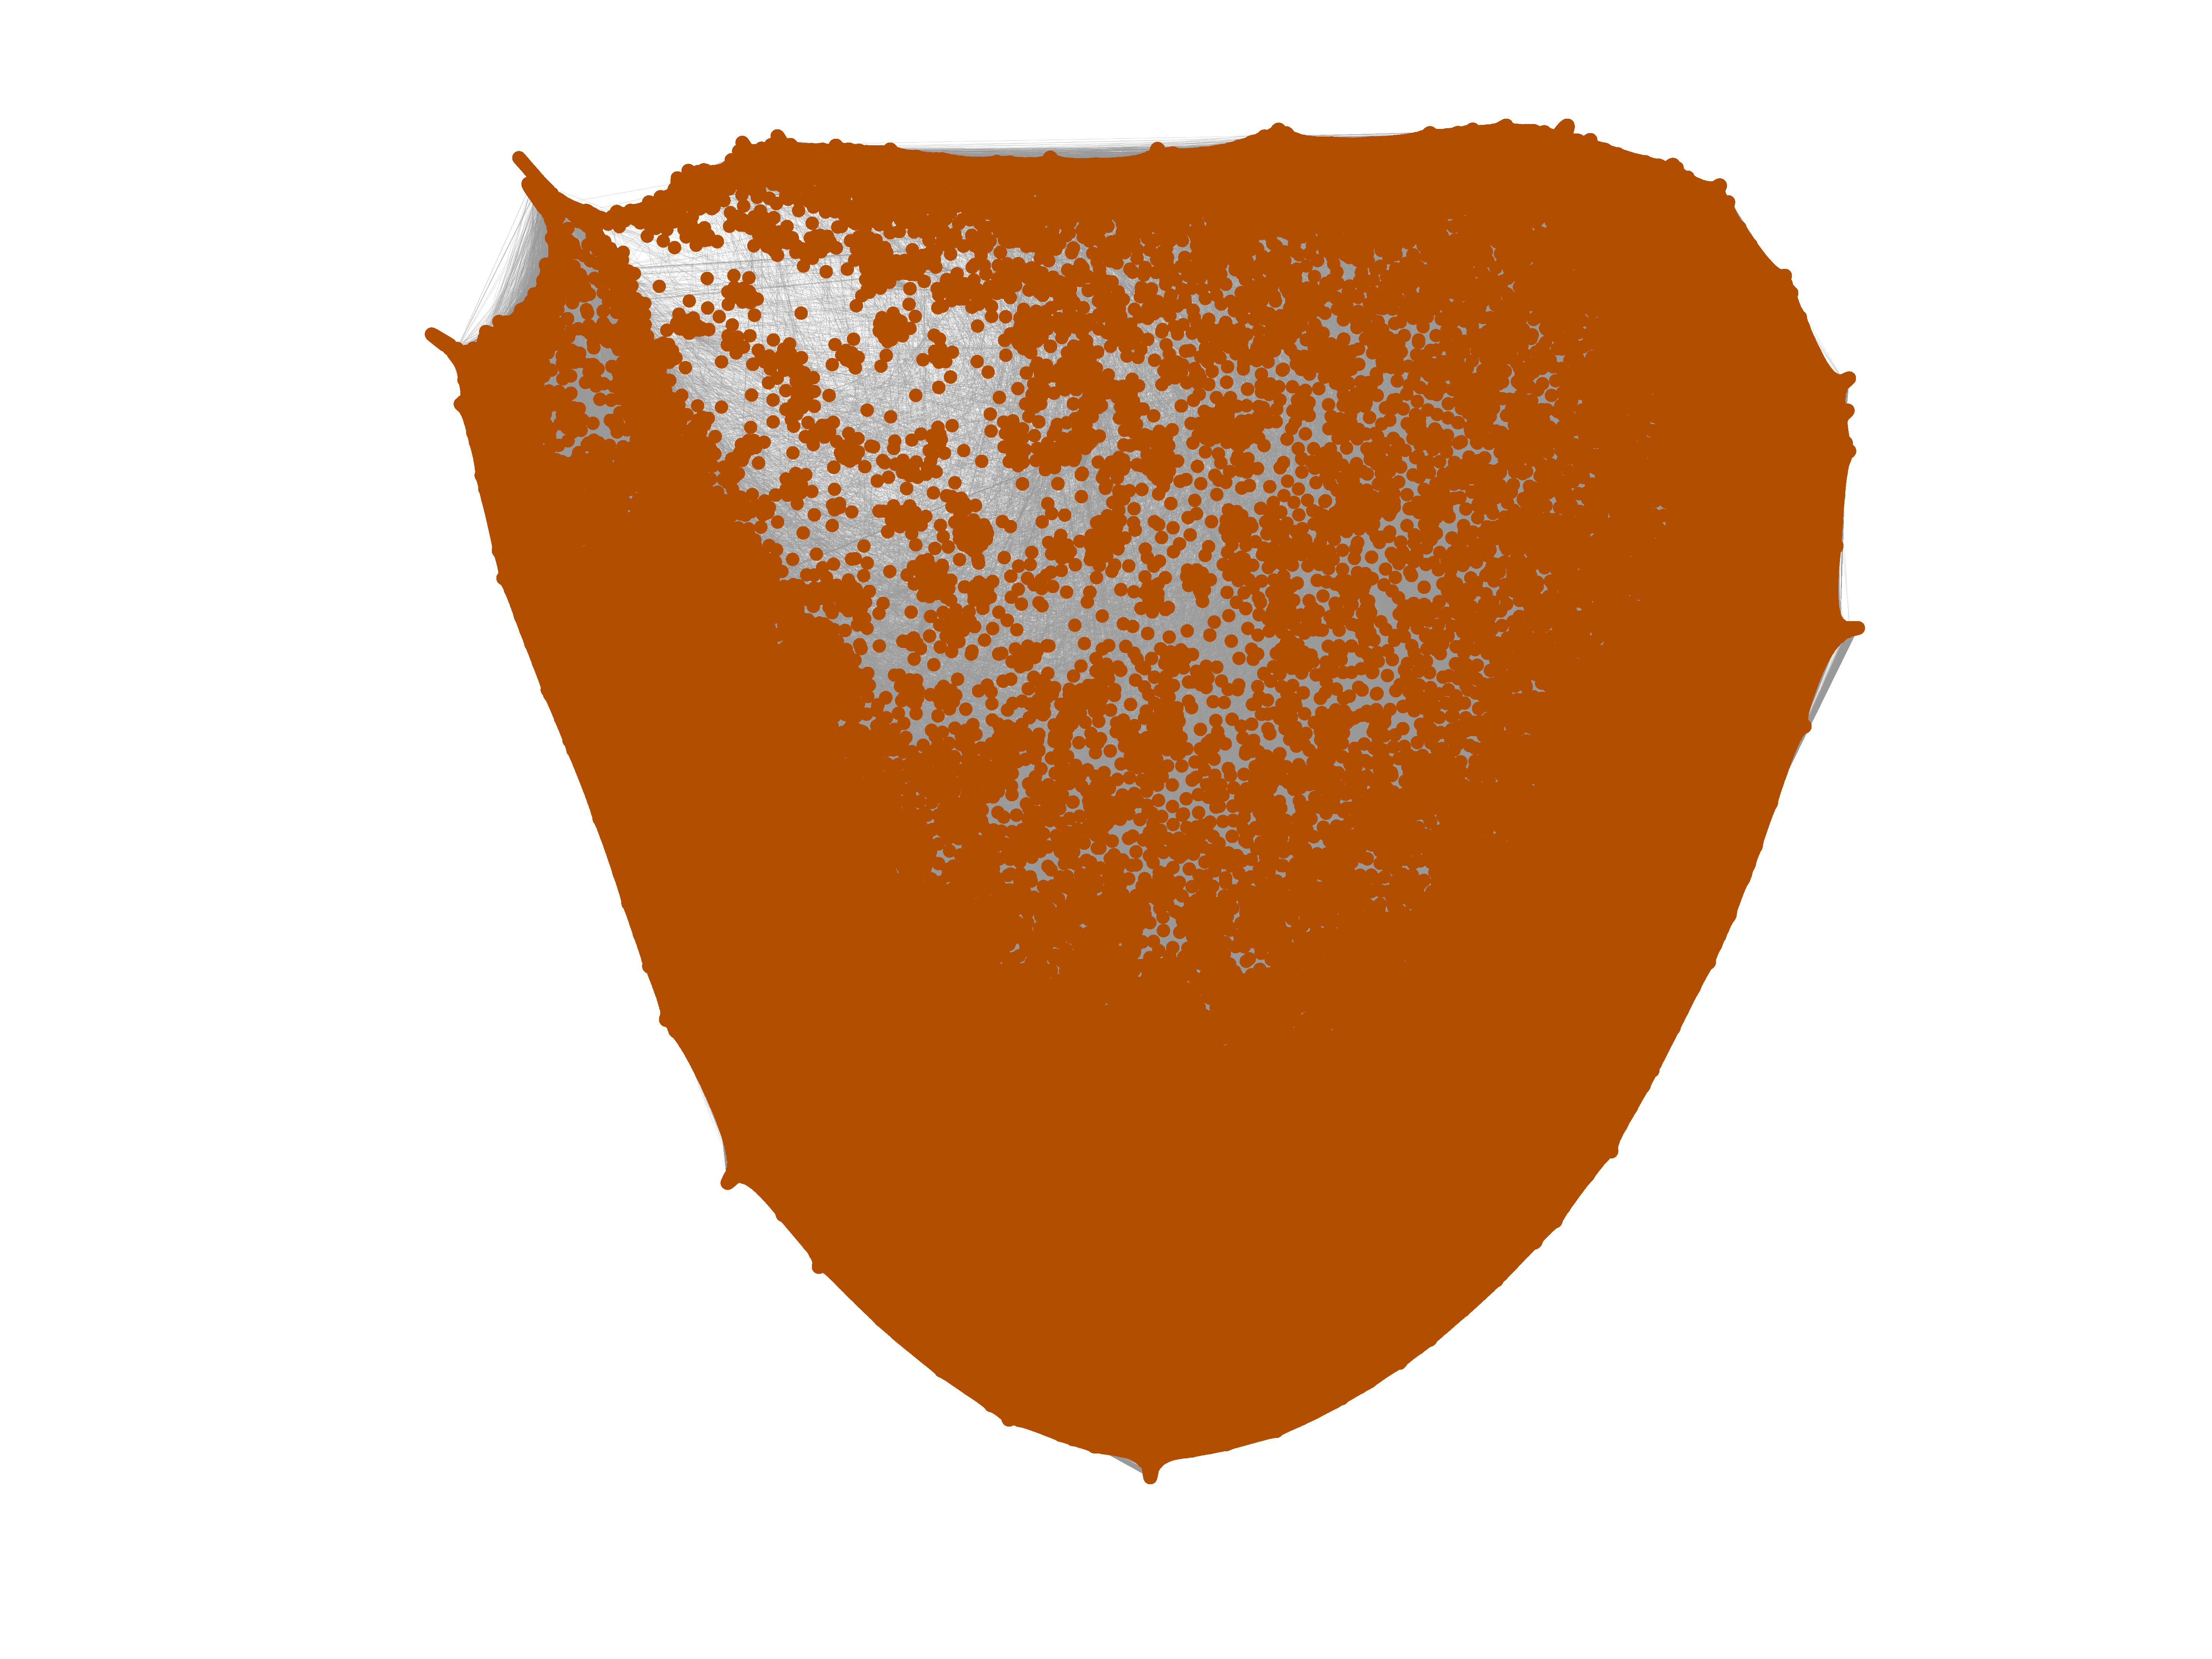
vi.sualize.us user–item
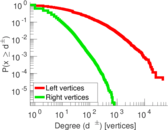
This is the bipartite picture tagging network of vi.sualize.us. Left nodes
represent users and right nodes represents pictures. An edge connects a user
with a picture he has tagged.
Metadata
Statistics
| Size | n = | 512,524
|
| Left size | n1 = | 17,122
|
| Right size | n2 = | 495,402
|
| Volume | m = | 2,298,816
|
| Unique edge count | m̿ = | 997,840
|
| Wedge count | s = | 489,164,625
|
| Square count | q = | 19,336,325
|
| 4-Tour count | T4 = | 2,113,369,668
|
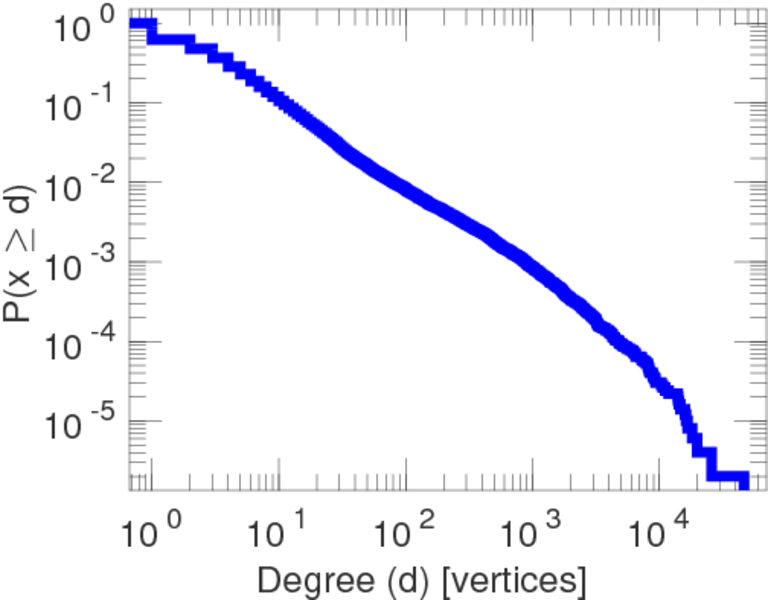
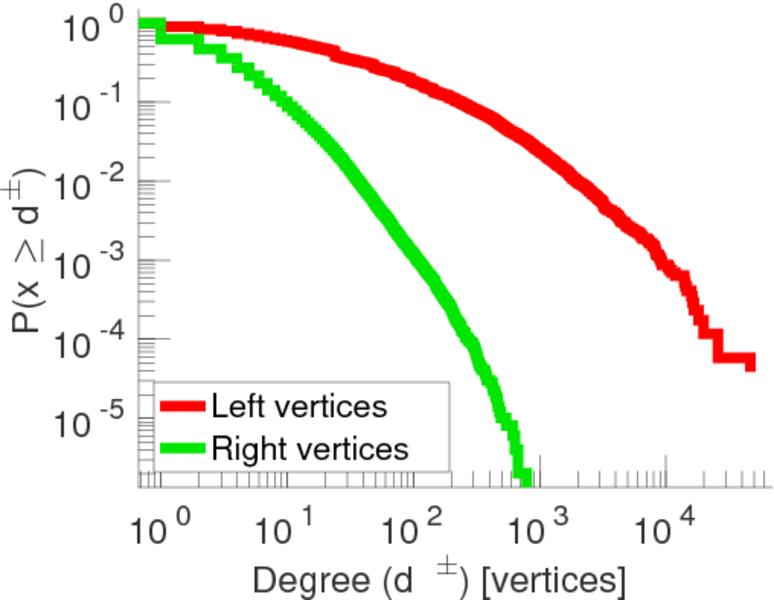
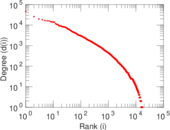
| Maximum degree | dmax = | 46,571
|
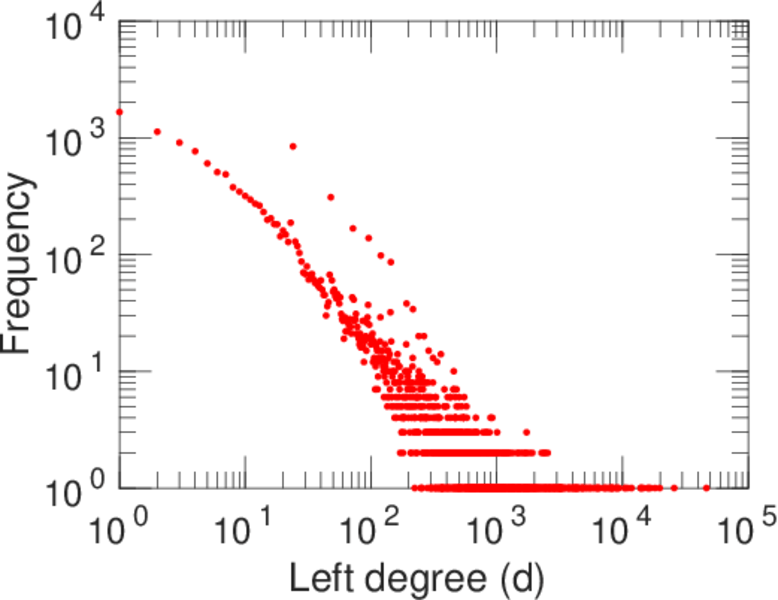
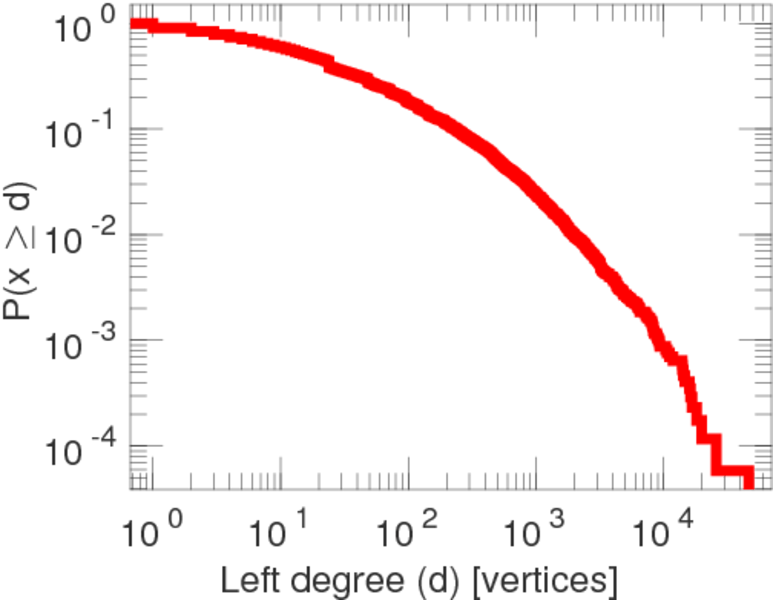
| Maximum left degree | d1max = | 46,571
|
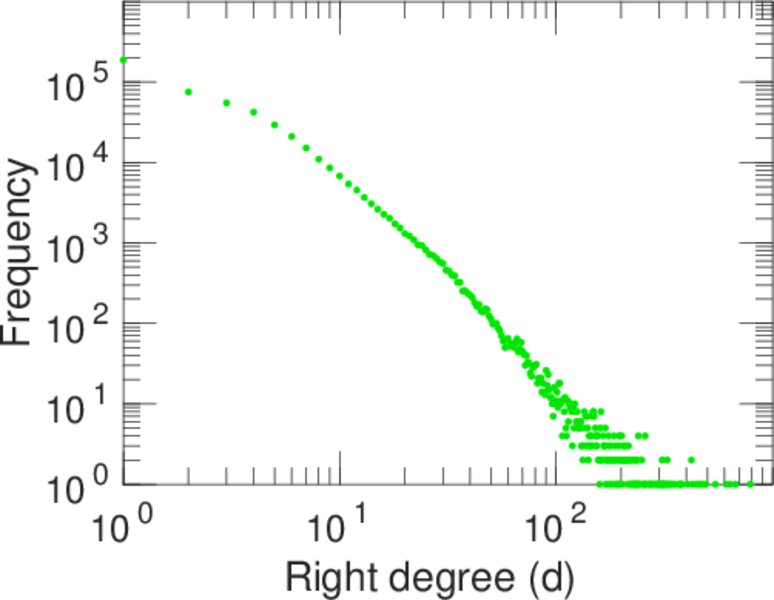
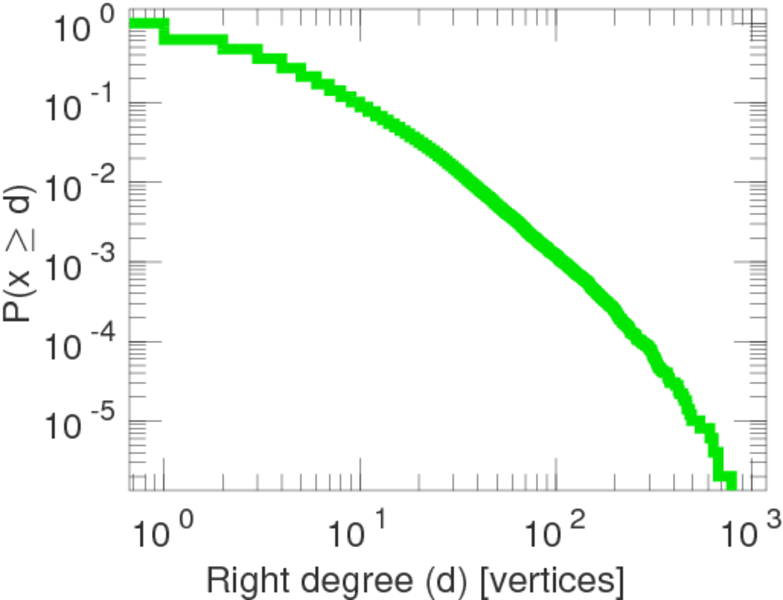
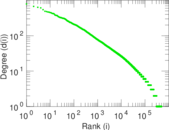
| Maximum right degree | d2max = | 790
|
| Average degree | d = | 8.970 57
|
| Average left degree | d1 = | 134.261
|
| Average right degree | d2 = | 4.640 30
|
| Fill | p = | 0.000 117 638
|
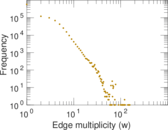
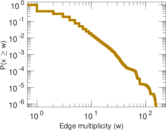
| Average edge multiplicity | m̃ = | 2.303 79
|
| Size of LCC | N = | 506,648
|
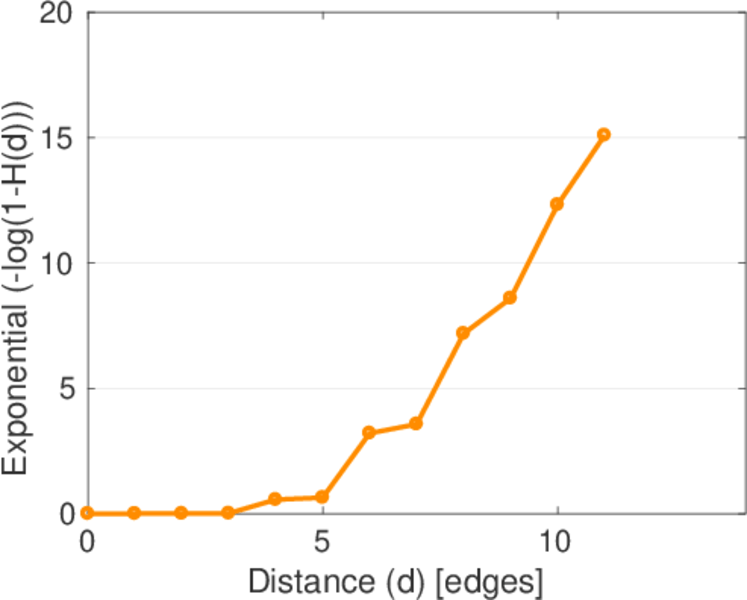
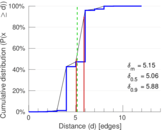
| Diameter | δ = | 14
|
| 50-Percentile effective diameter | δ0.5 = | 5.057 31
|
| 90-Percentile effective diameter | δ0.9 = | 5.878 07
|
| Median distance | δM = | 6
|
| Mean distance | δm = | 5.154 40
|
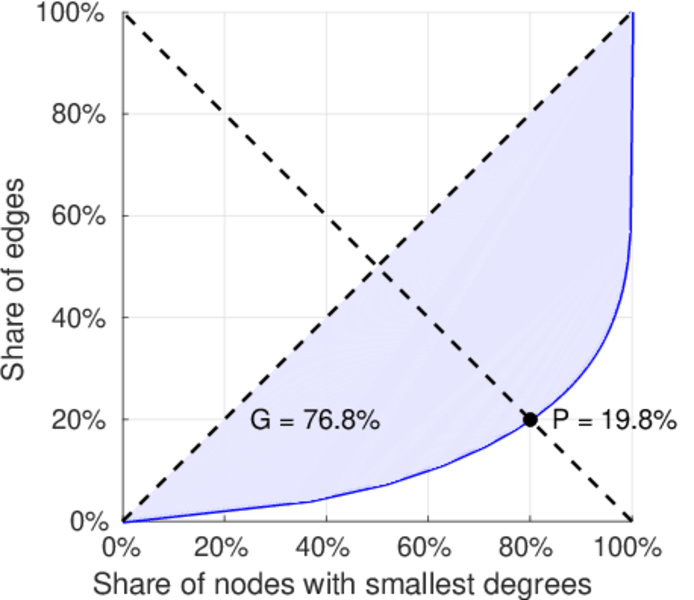
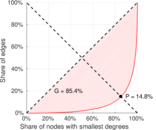
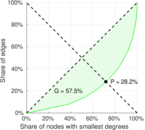
| Gini coefficient | G = | 0.776 842
|
| Balanced inequality ratio | P = | 0.191 994
|
| Left balanced inequality ratio | P1 = | 0.148 075
|
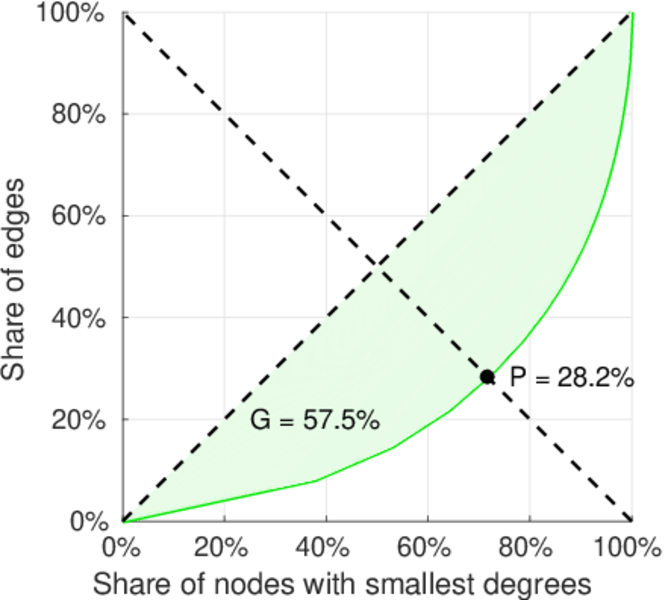
| Right balanced inequality ratio | P2 = | 0.282 309
|
| Relative edge distribution entropy | Her = | 0.838 461
|
| Power law exponent | γ = | 3.355 72
|
| Tail power law exponent | γt = | 2.201 00
|
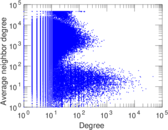
| Degree assortativity | ρ = | −0.074 900 8
|
| Degree assortativity p-value | pρ = | 0.000 00
|
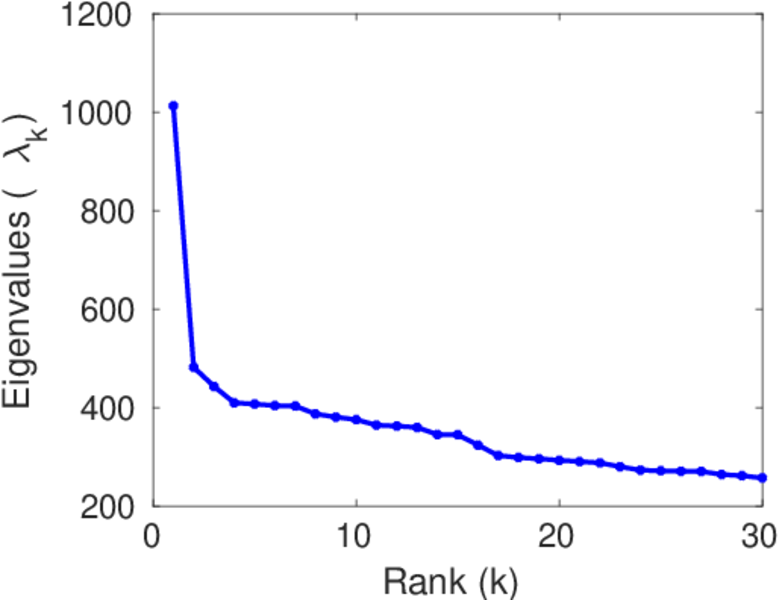
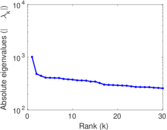
| Spectral norm | α = | 1,012.77
|
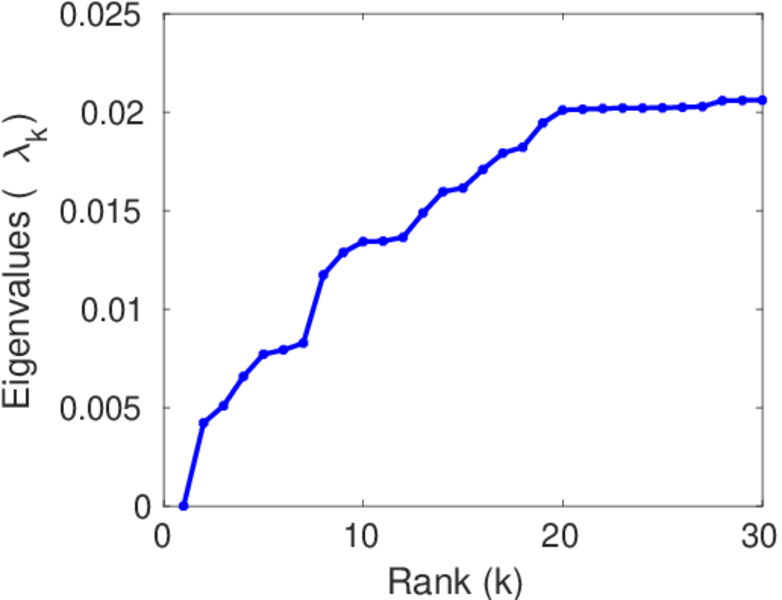
| Algebraic connectivity | a = | 0.004 221 18
|
| Spectral separation | |λ1[A] / λ2[A]| = | 2.101 98
|
| Controllability | C = | 478,505
|
| Relative controllability | Cr = | 0.933 625
|
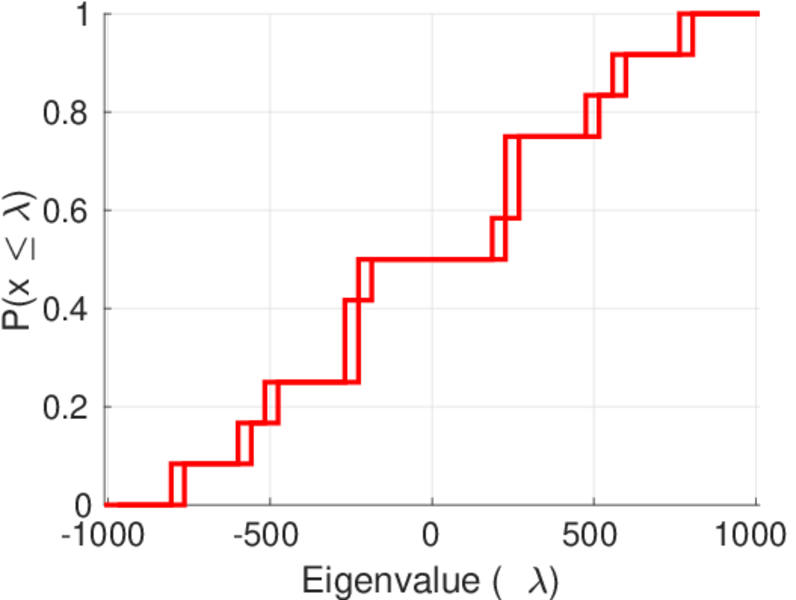
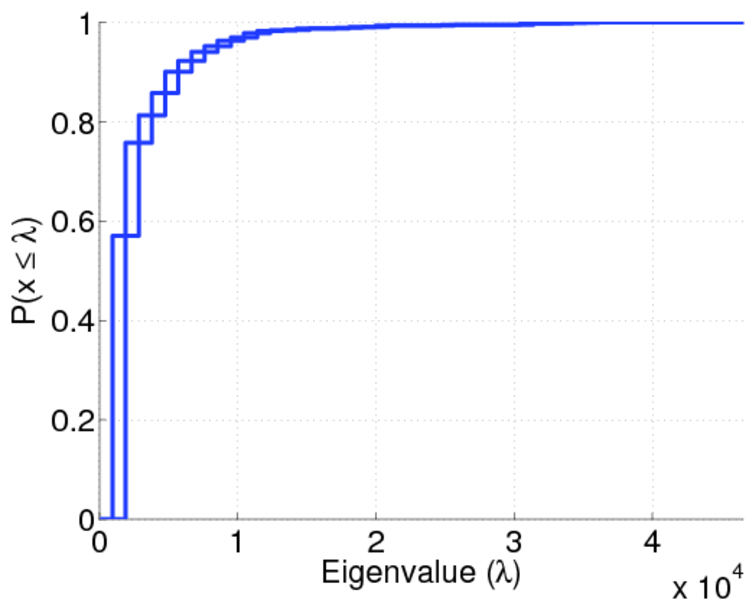
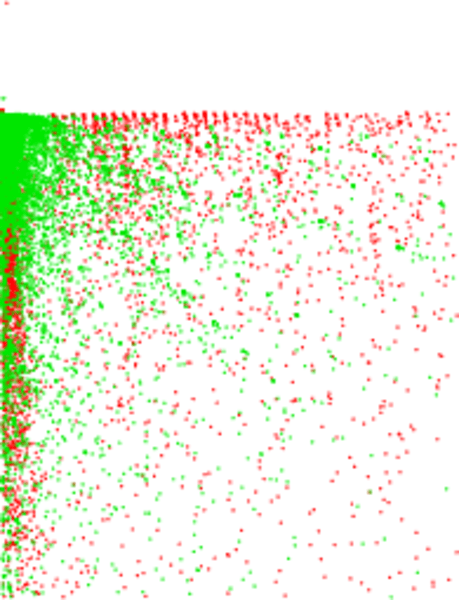
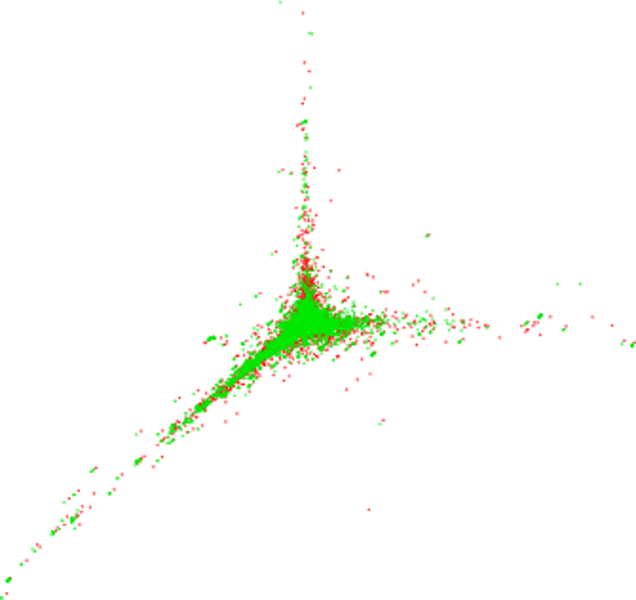
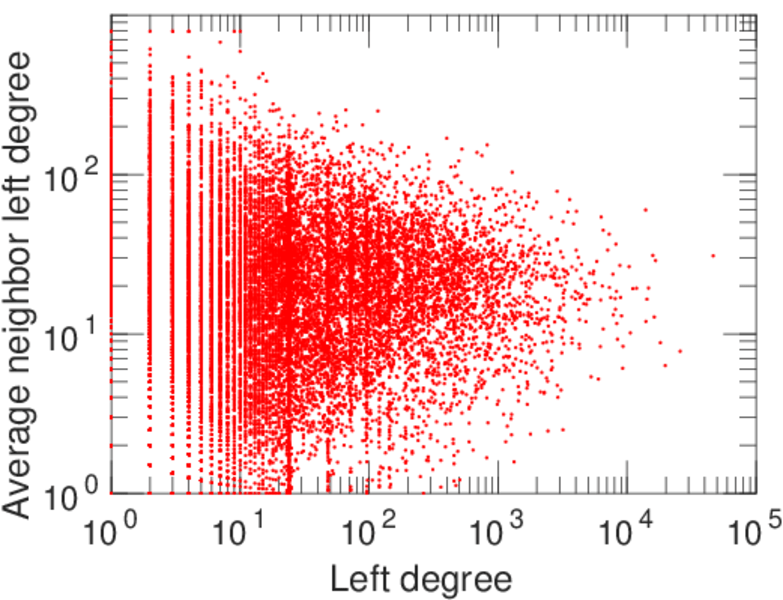
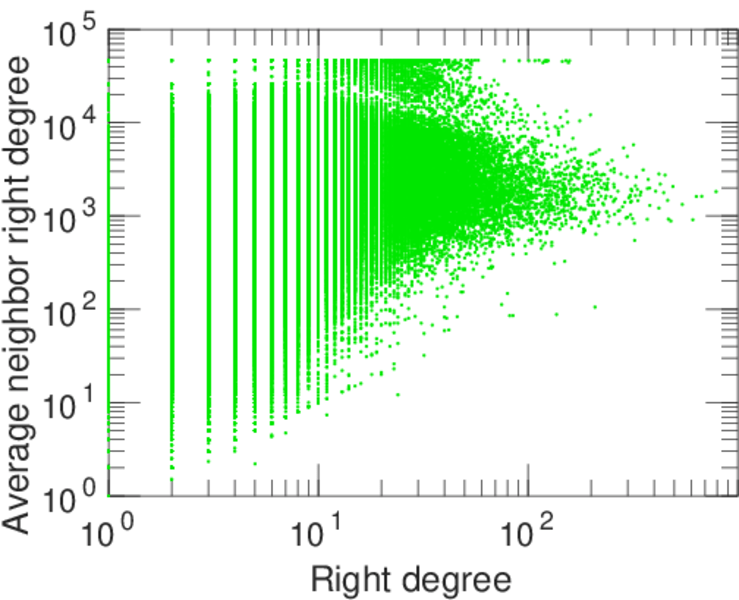
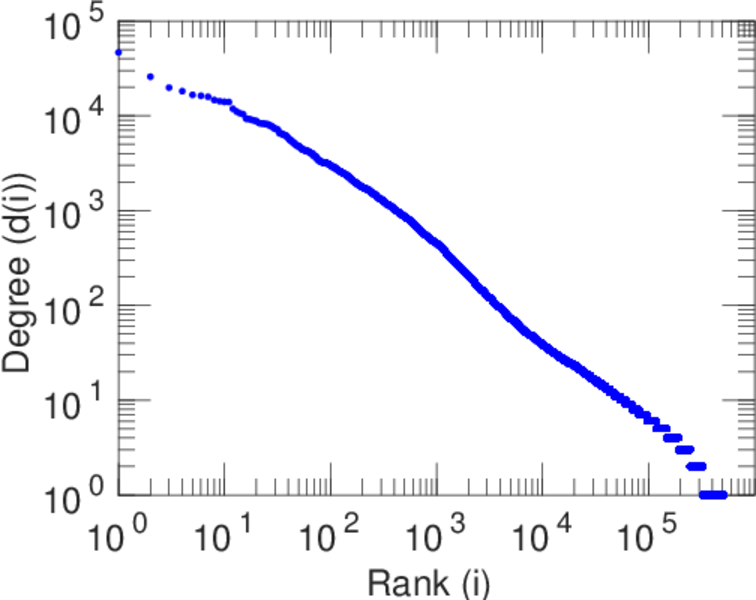
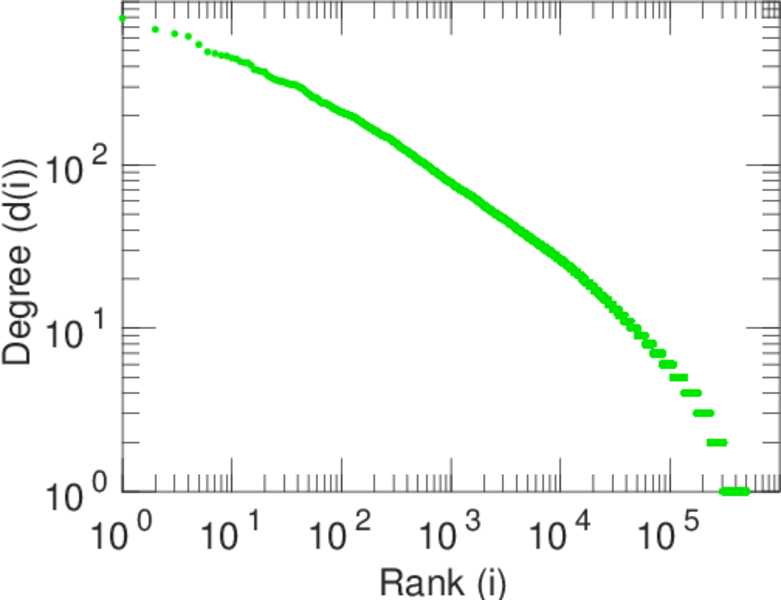
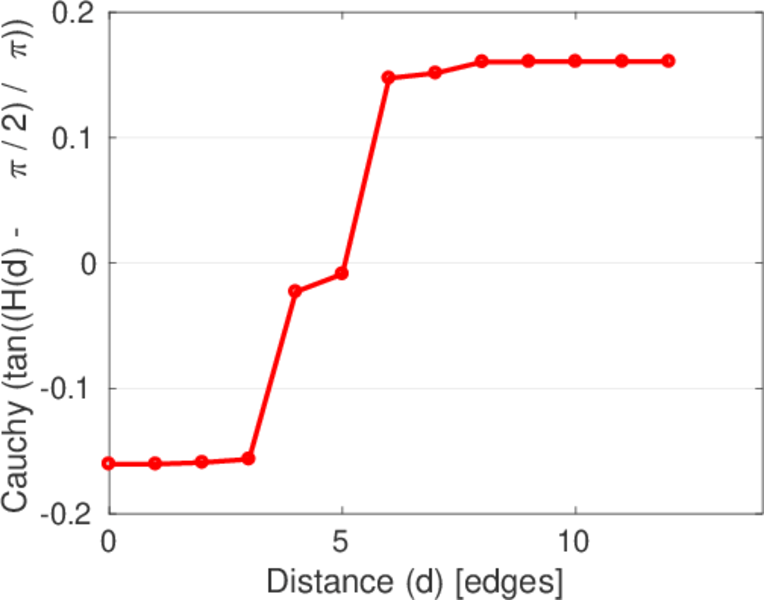
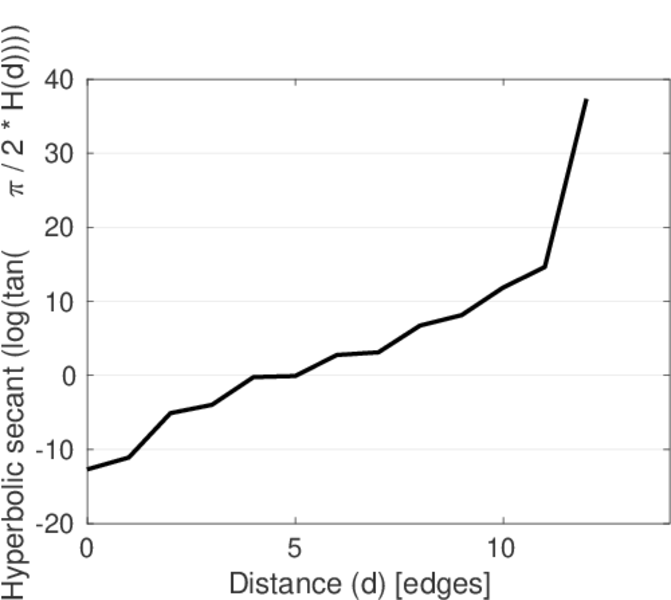
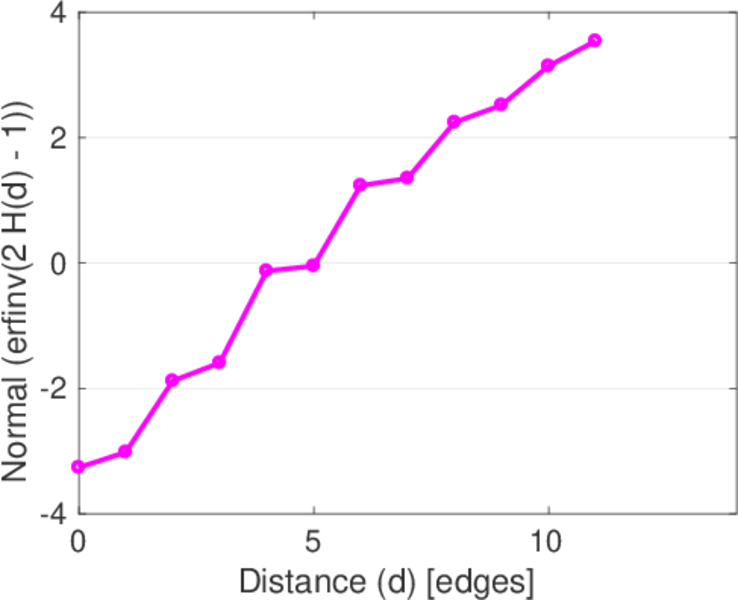
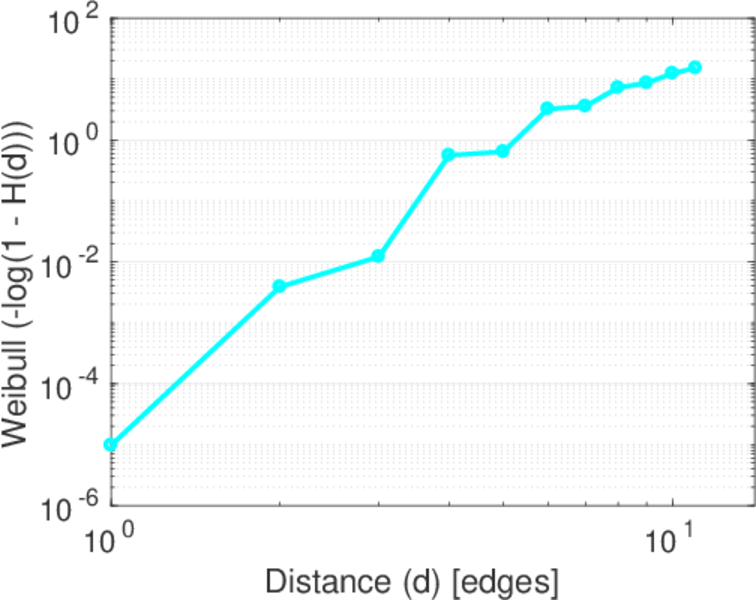
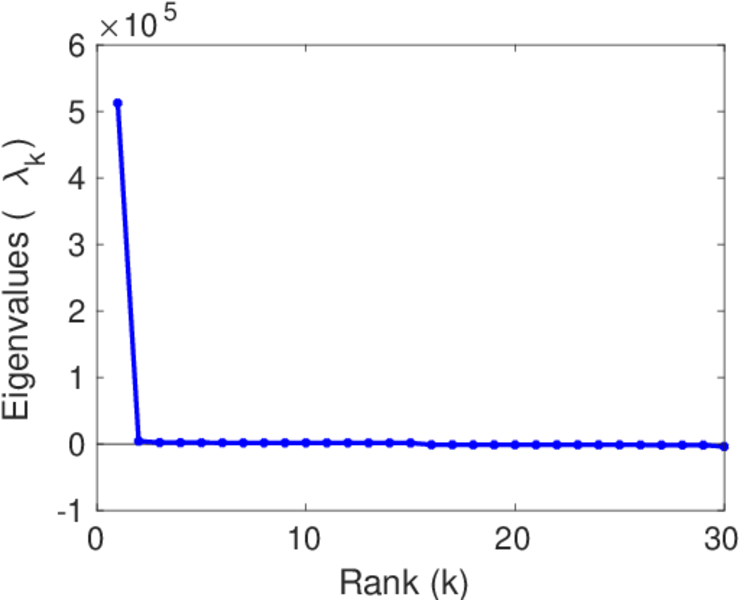
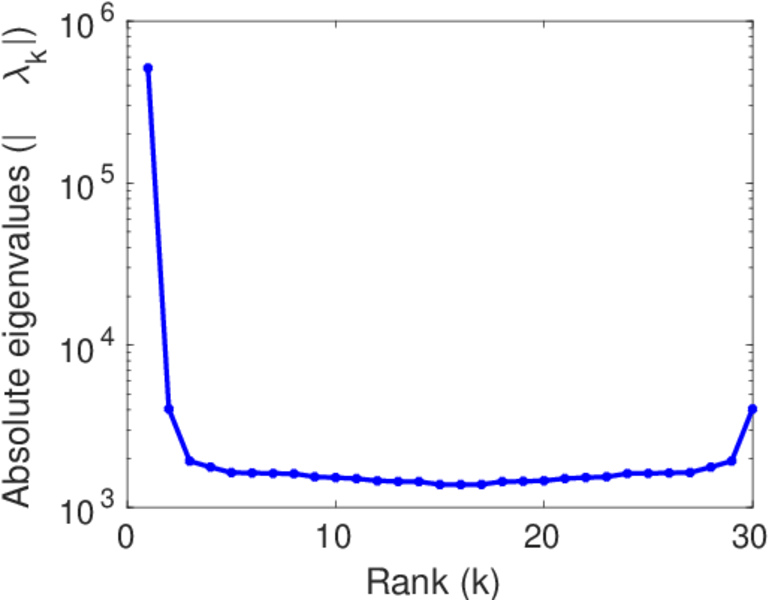
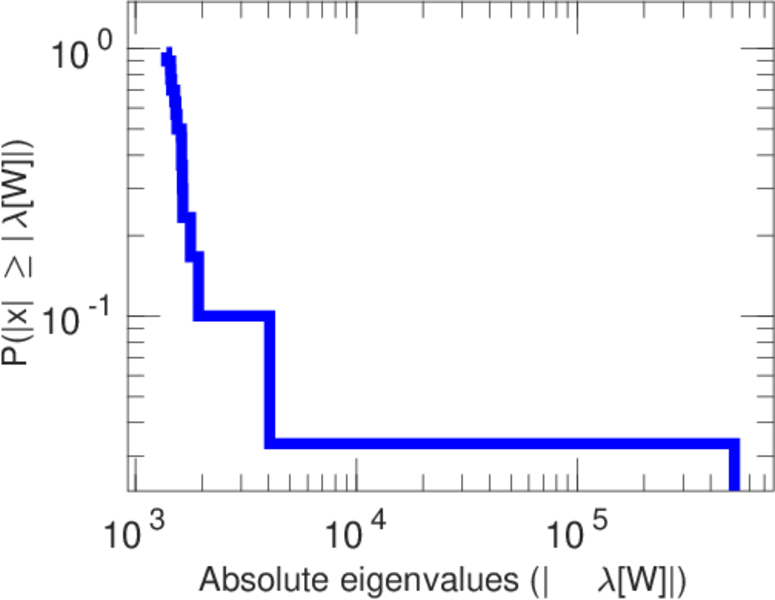
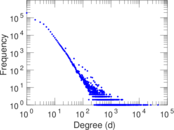
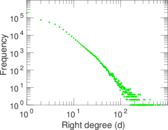
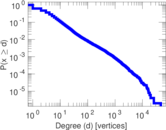
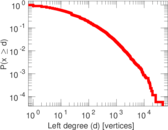
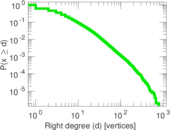
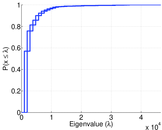
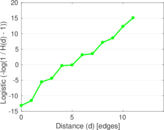
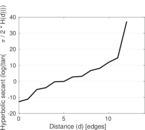
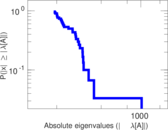
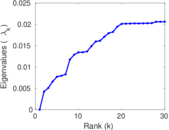
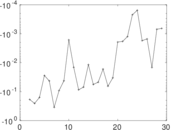
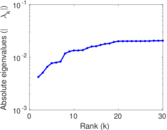
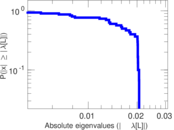
Plots


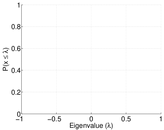
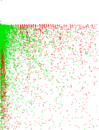
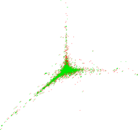
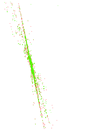


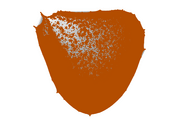

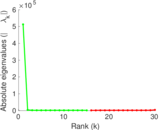
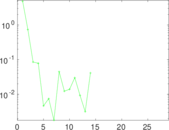
Matrix decompositions plots


Downloads
References
|
[1]
|
Jérôme Kunegis.
KONECT – The Koblenz Network Collection.
In Proc. Int. Conf. on World Wide Web Companion, pages
1343–1350, 2013.
[ http ]
|
|
[2]
|
Nicolas Neubauer and Klaus Obermayer.
Analysis of the Visualize.us folksonomy.
Unpublished, 2010.
|
 KONECT ‣ Networks ‣
Buy Me a Coffee
KONECT ‣ Networks ‣
Buy Me a Coffee