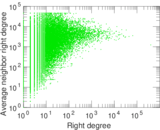
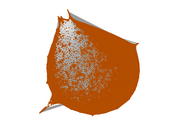
vi.sualize.us user–tag
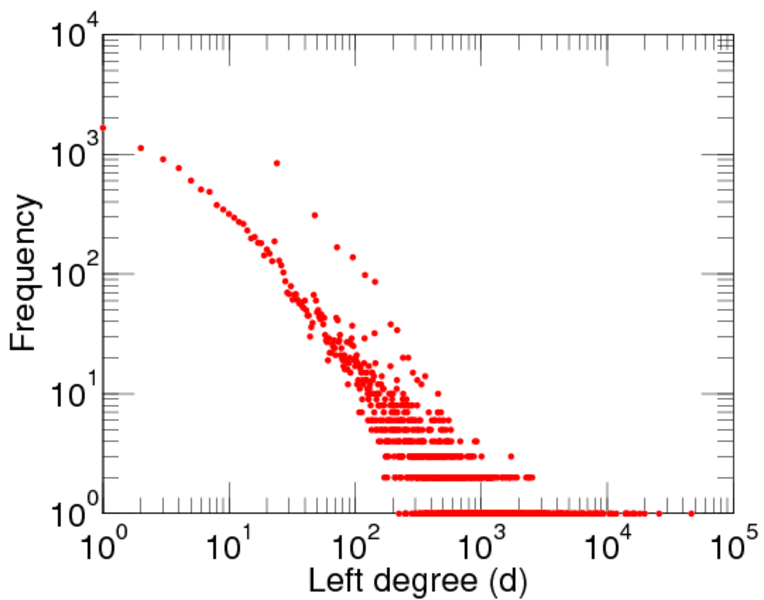
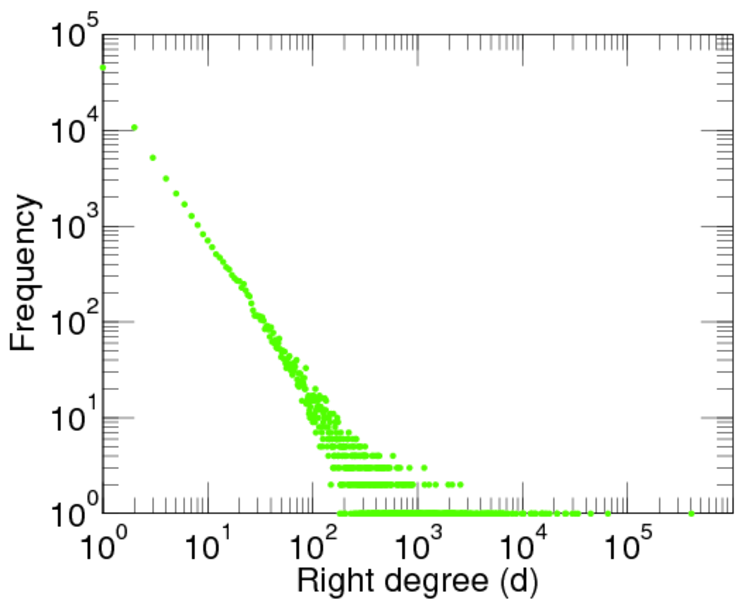
This is the bipartite picture tagging network of vi.sualize.us. Left nodes
represent users and right nodes represent tags. An edge connects a user and a
tag he has used.
Metadata
Statistics
| Size | n = | 99,157
|
| Left size | n1 = | 17,122
|
| Right size | n2 = | 82,035
|
| Volume | m = | 2,298,816
|
| Unique edge count | m̿ = | 449,503
|
| Wedge count | s = | 211,070,075
|
| Claw count | z = | 290,844,387,003
|
| Cross count | x = | 596,462,431,865,815
|
| Square count | q = | 519,071,489
|
| 4-Tour count | T4 = | 4,997,987,030
|
| Maximum degree | dmax = | 405,429
|
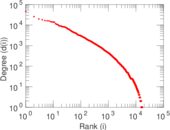
| Maximum left degree | d1max = | 46,571
|
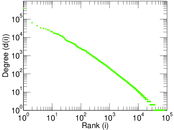
| Maximum right degree | d2max = | 405,429
|
| Average degree | d = | 46.367 2
|
| Average left degree | d1 = | 134.261
|
| Average right degree | d2 = | 28.022 4
|
| Fill | p = | 0.000 320 021
|
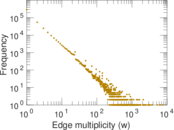
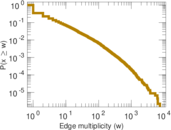
| Average edge multiplicity | m̃ = | 5.114 13
|
| Size of LCC | N = | 98,486
|
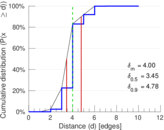
| Diameter | δ = | 12
|
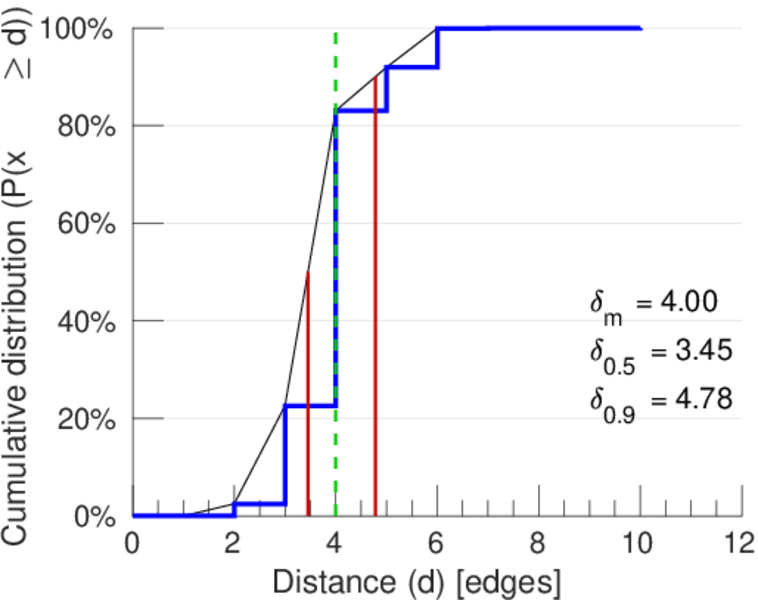
| 50-Percentile effective diameter | δ0.5 = | 3.453 47
|
| 90-Percentile effective diameter | δ0.9 = | 4.781 47
|
| Median distance | δM = | 4
|
| Mean distance | δm = | 4.001 17
|
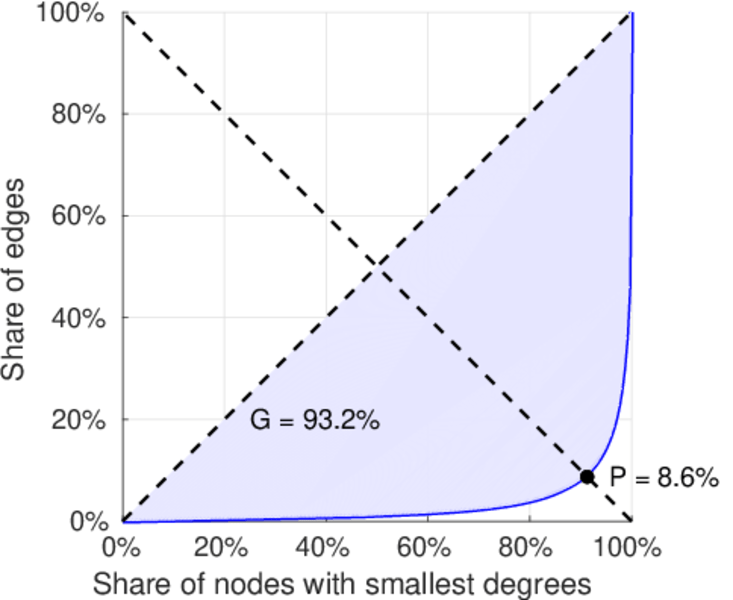
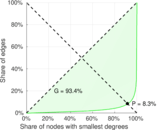
| Gini coefficient | G = | 0.940 143
|
| Balanced inequality ratio | P = | 0.082 228 4
|
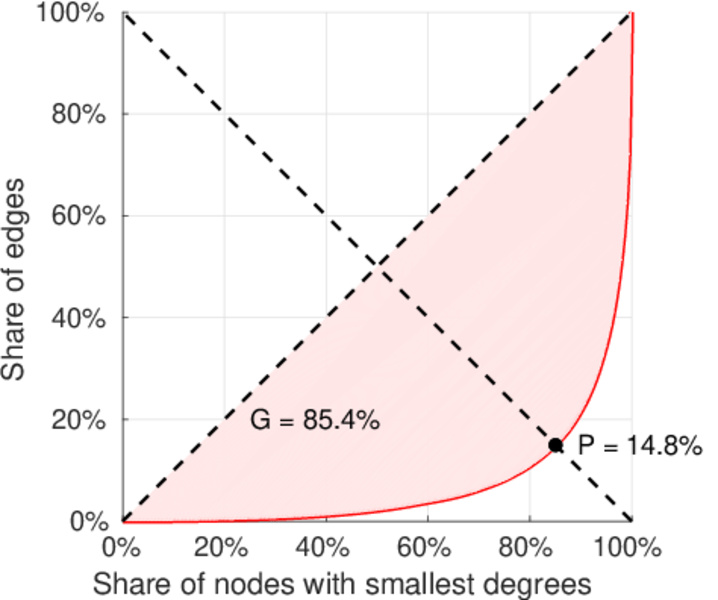
| Left balanced inequality ratio | P1 = | 0.148 075
|
| Right balanced inequality ratio | P2 = | 0.083 396 4
|
| Relative edge distribution entropy | Her = | 0.810 950
|
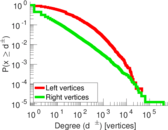
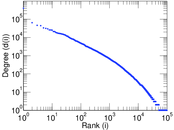
| Power law exponent | γ = | 2.439 72
|
| Tail power law exponent | γt = | 1.701 00
|
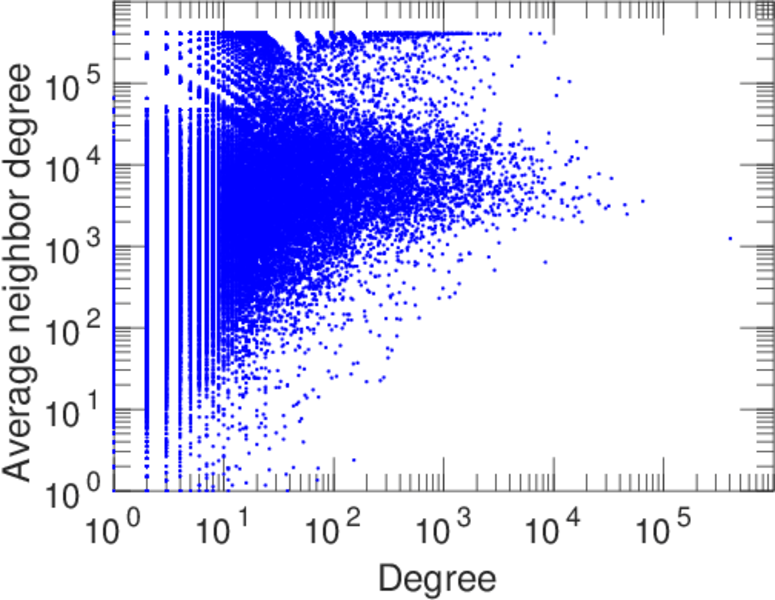
| Degree assortativity | ρ = | −0.106 507
|
| Degree assortativity p-value | pρ = | 0.000 00
|
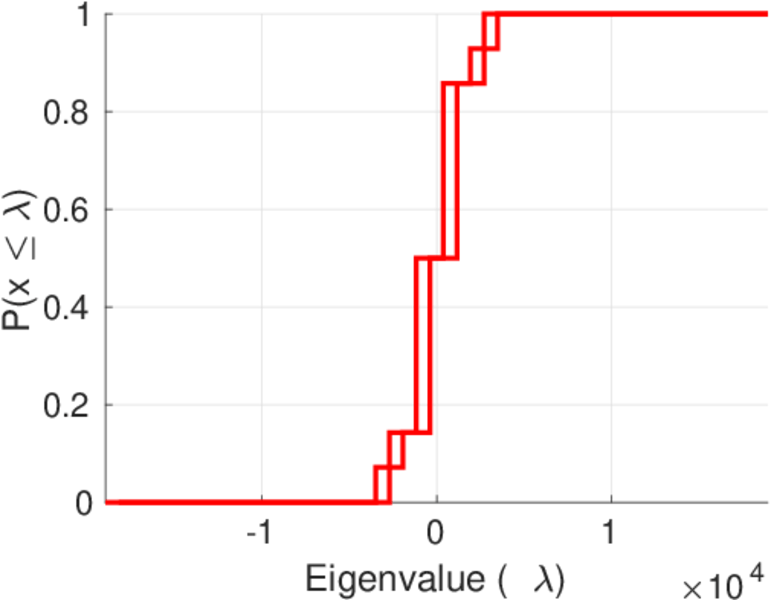
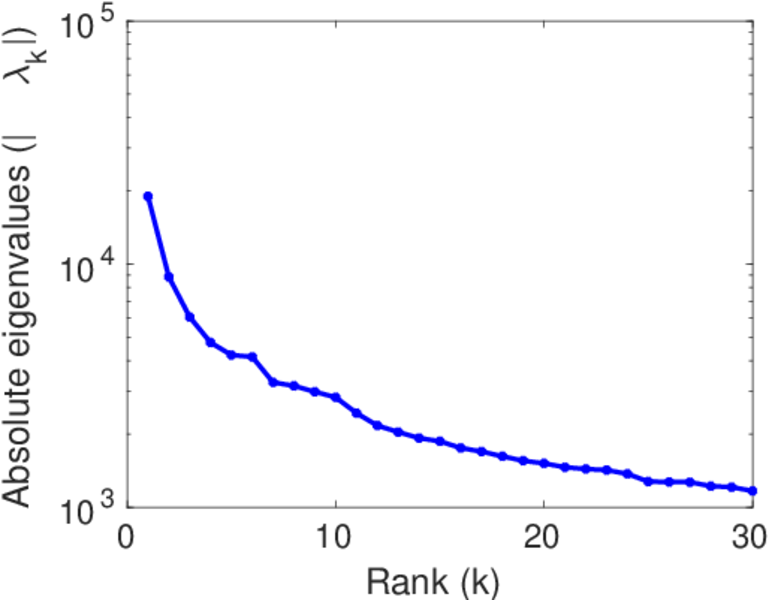
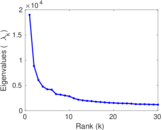
| Spectral norm | α = | 18,991.5
|
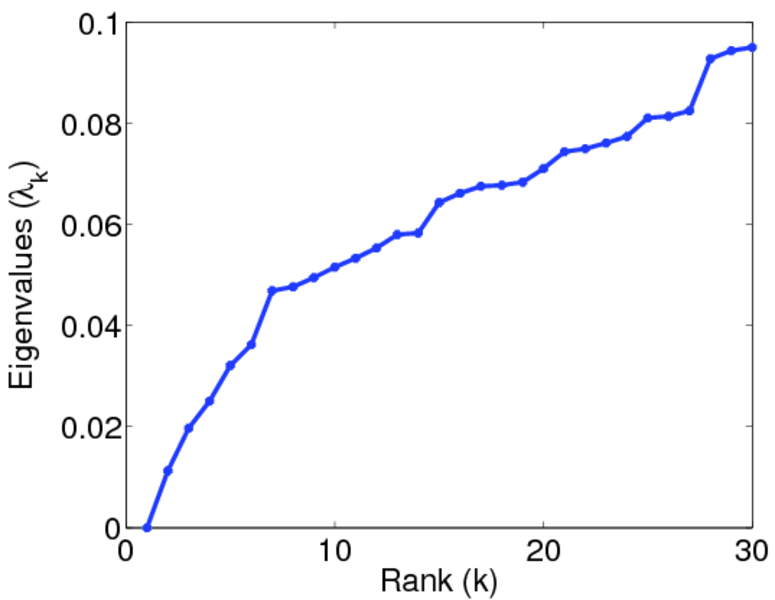
| Algebraic connectivity | a = | 0.011 268 9
|
| Spectral separation | |λ1[A] / λ2[A]| = | 2.145 22
|
| Controllability | C = | 76,829
|
| Relative controllability | Cr = | 0.774 822
|
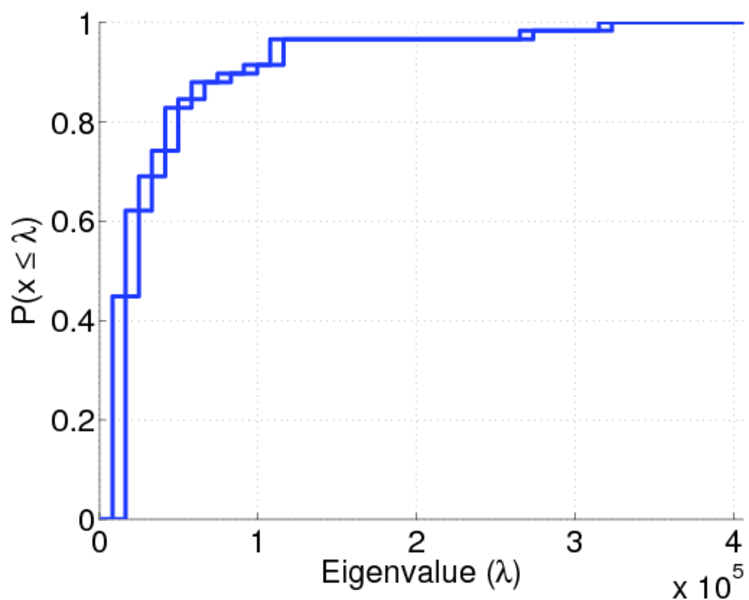
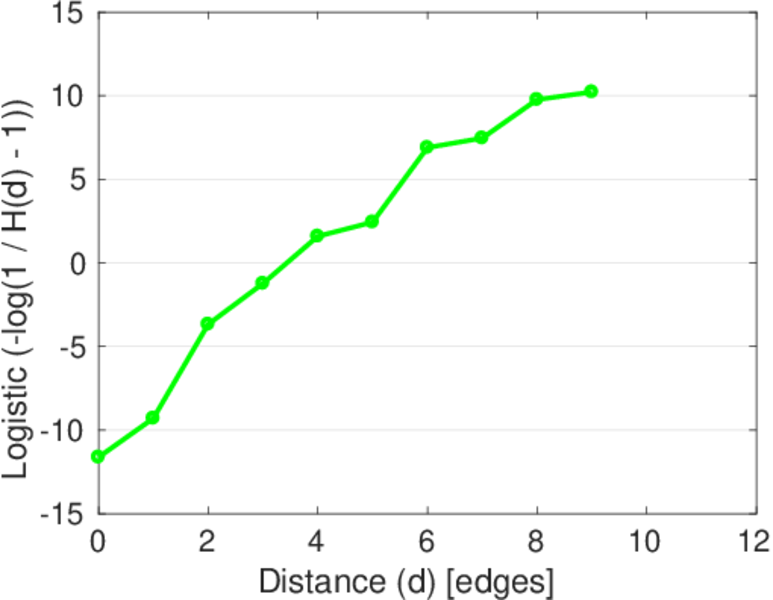
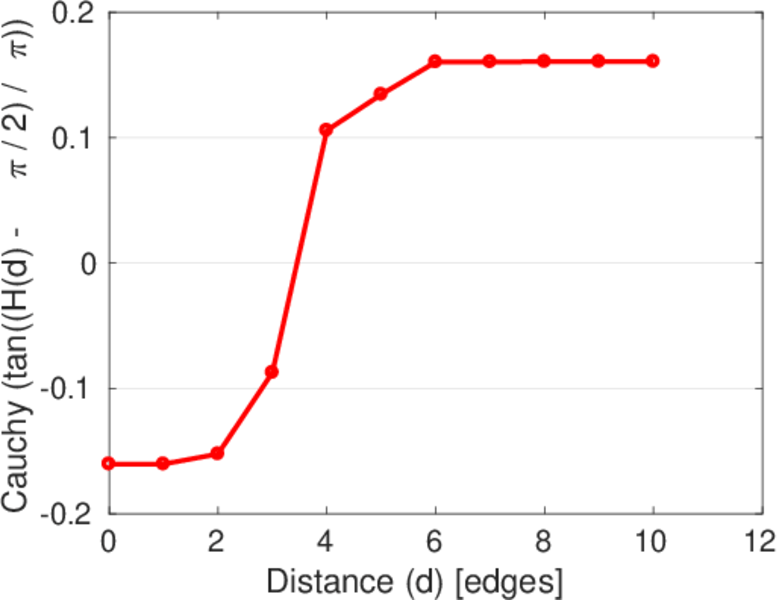
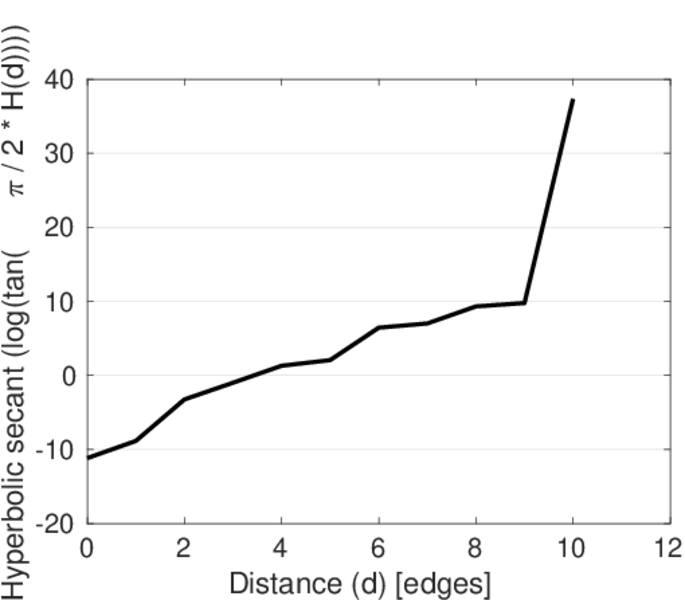
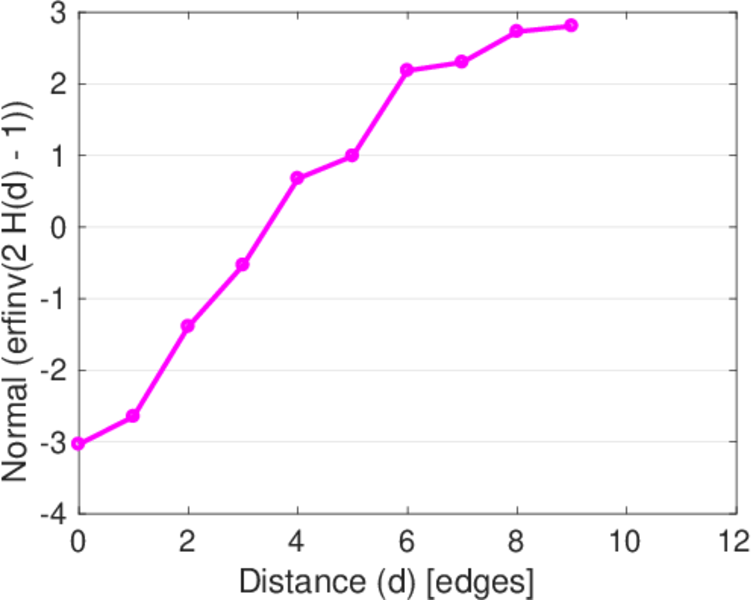
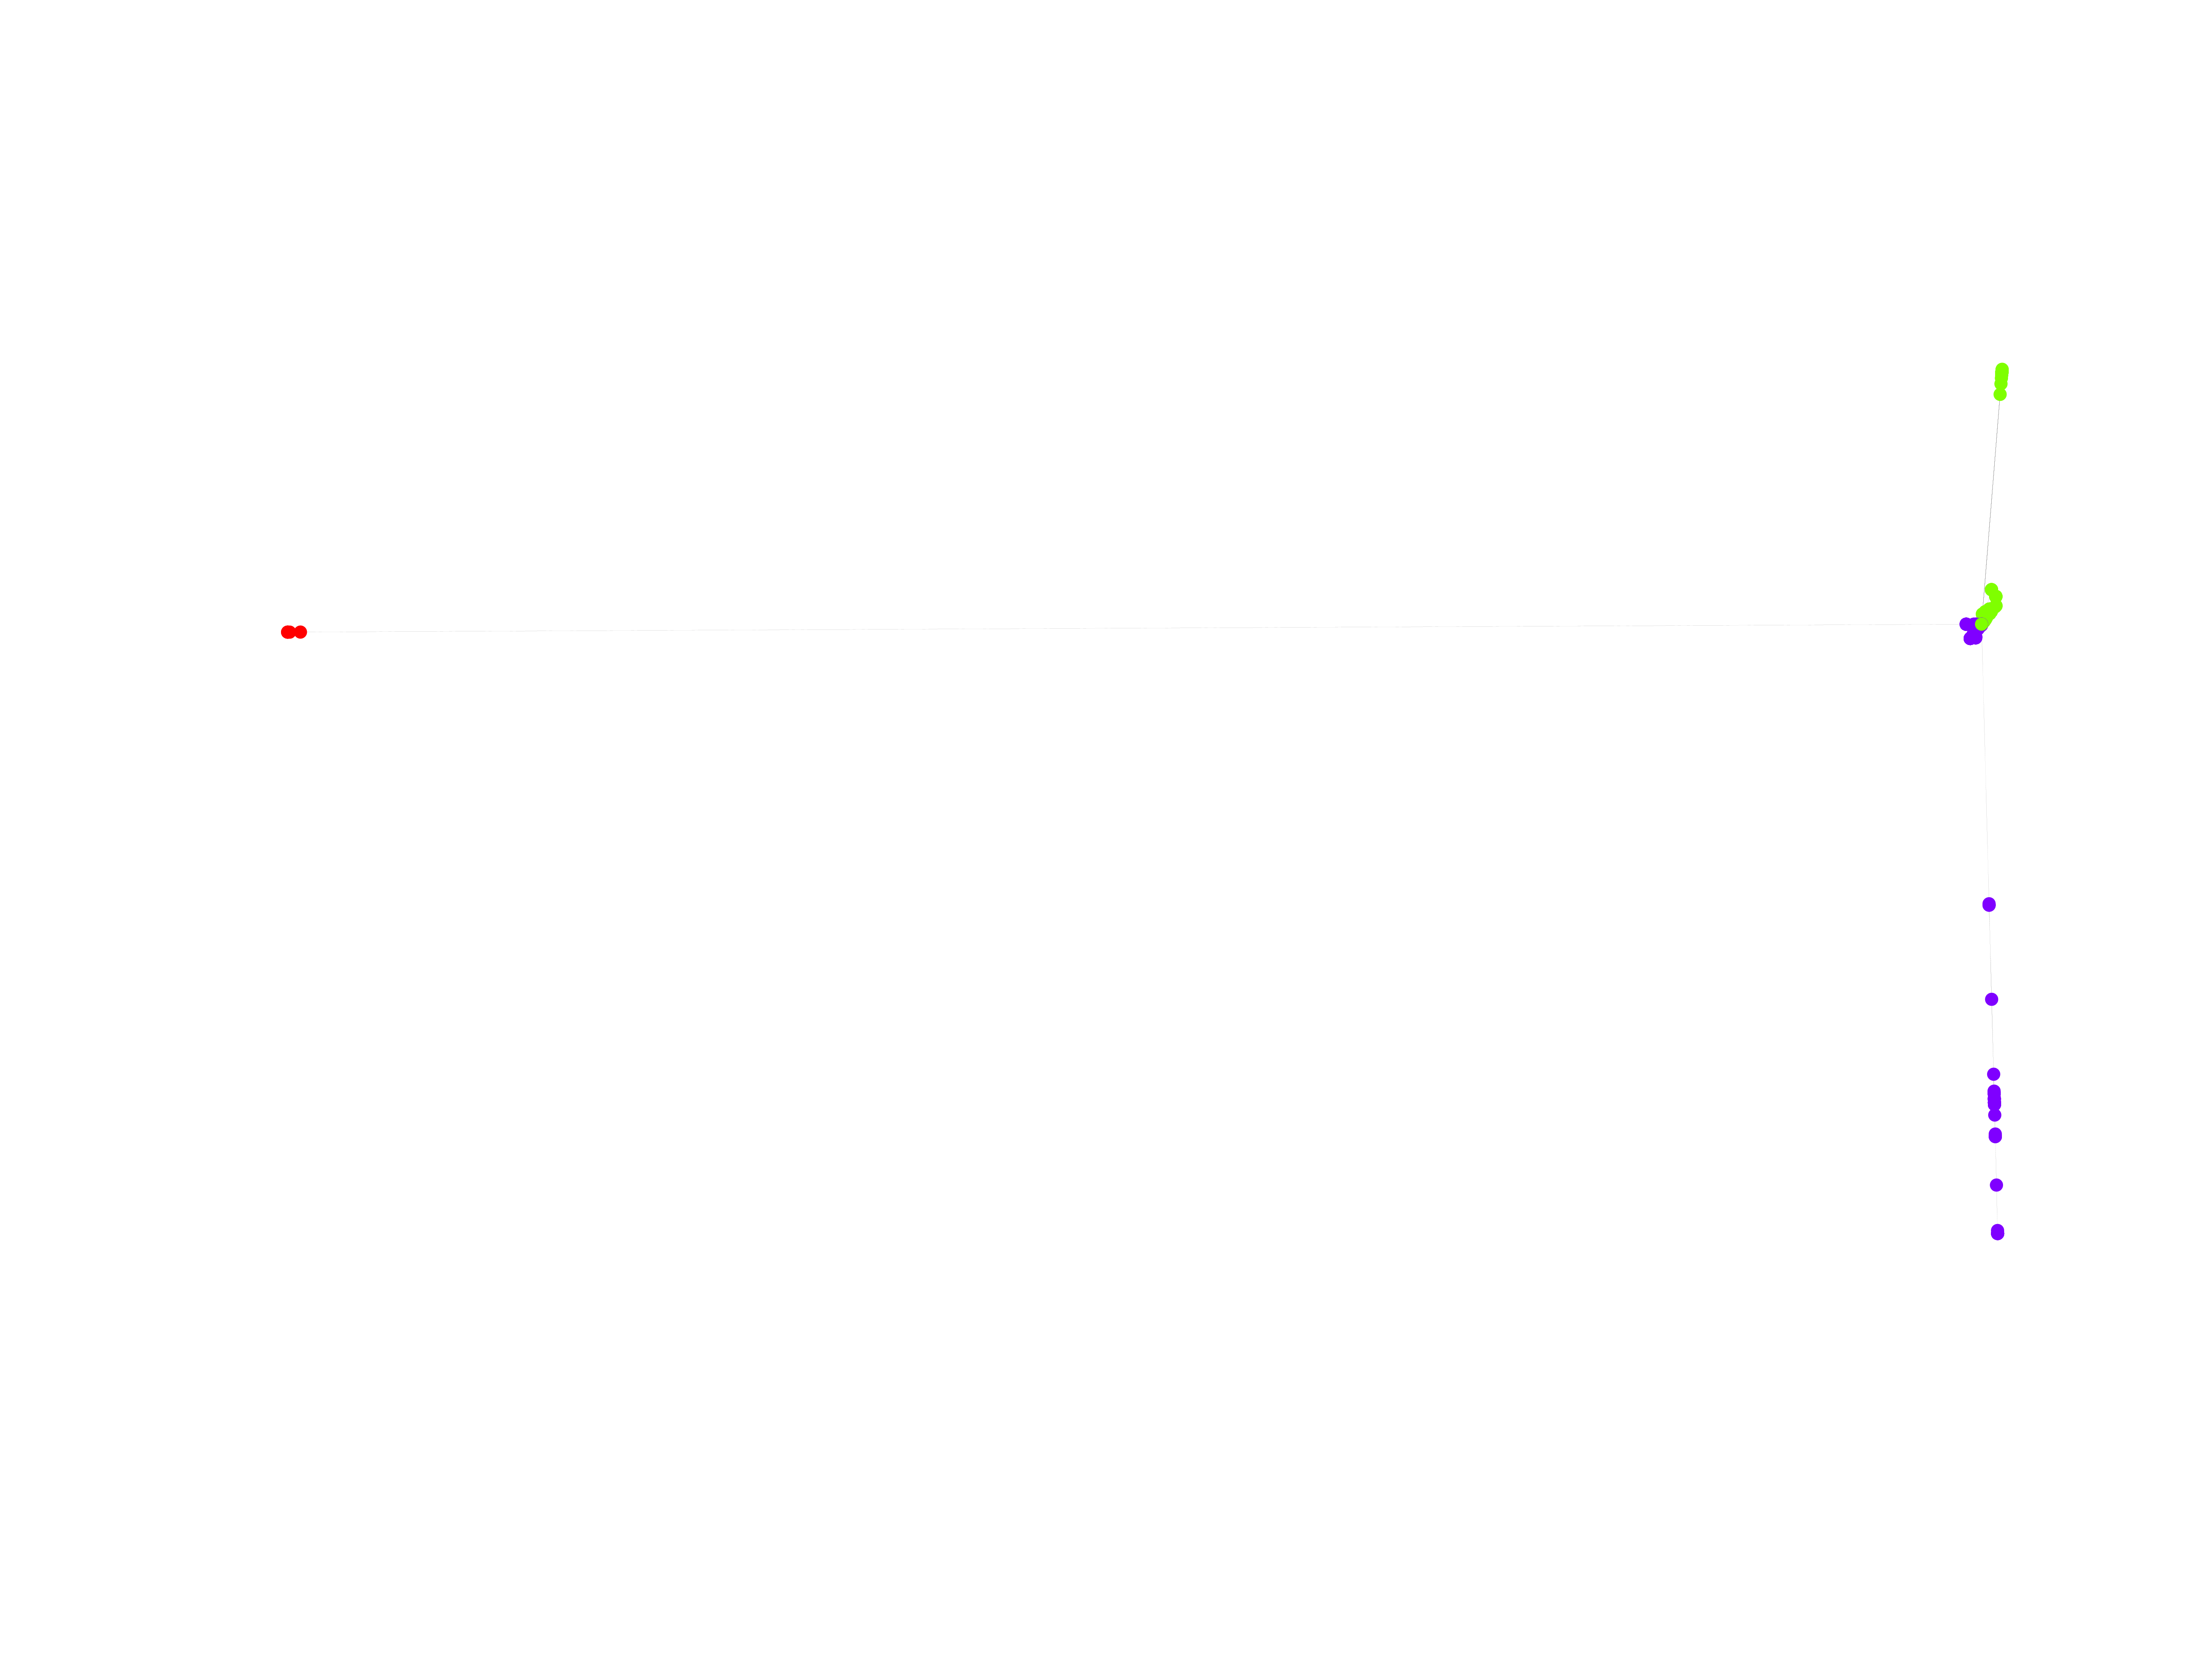
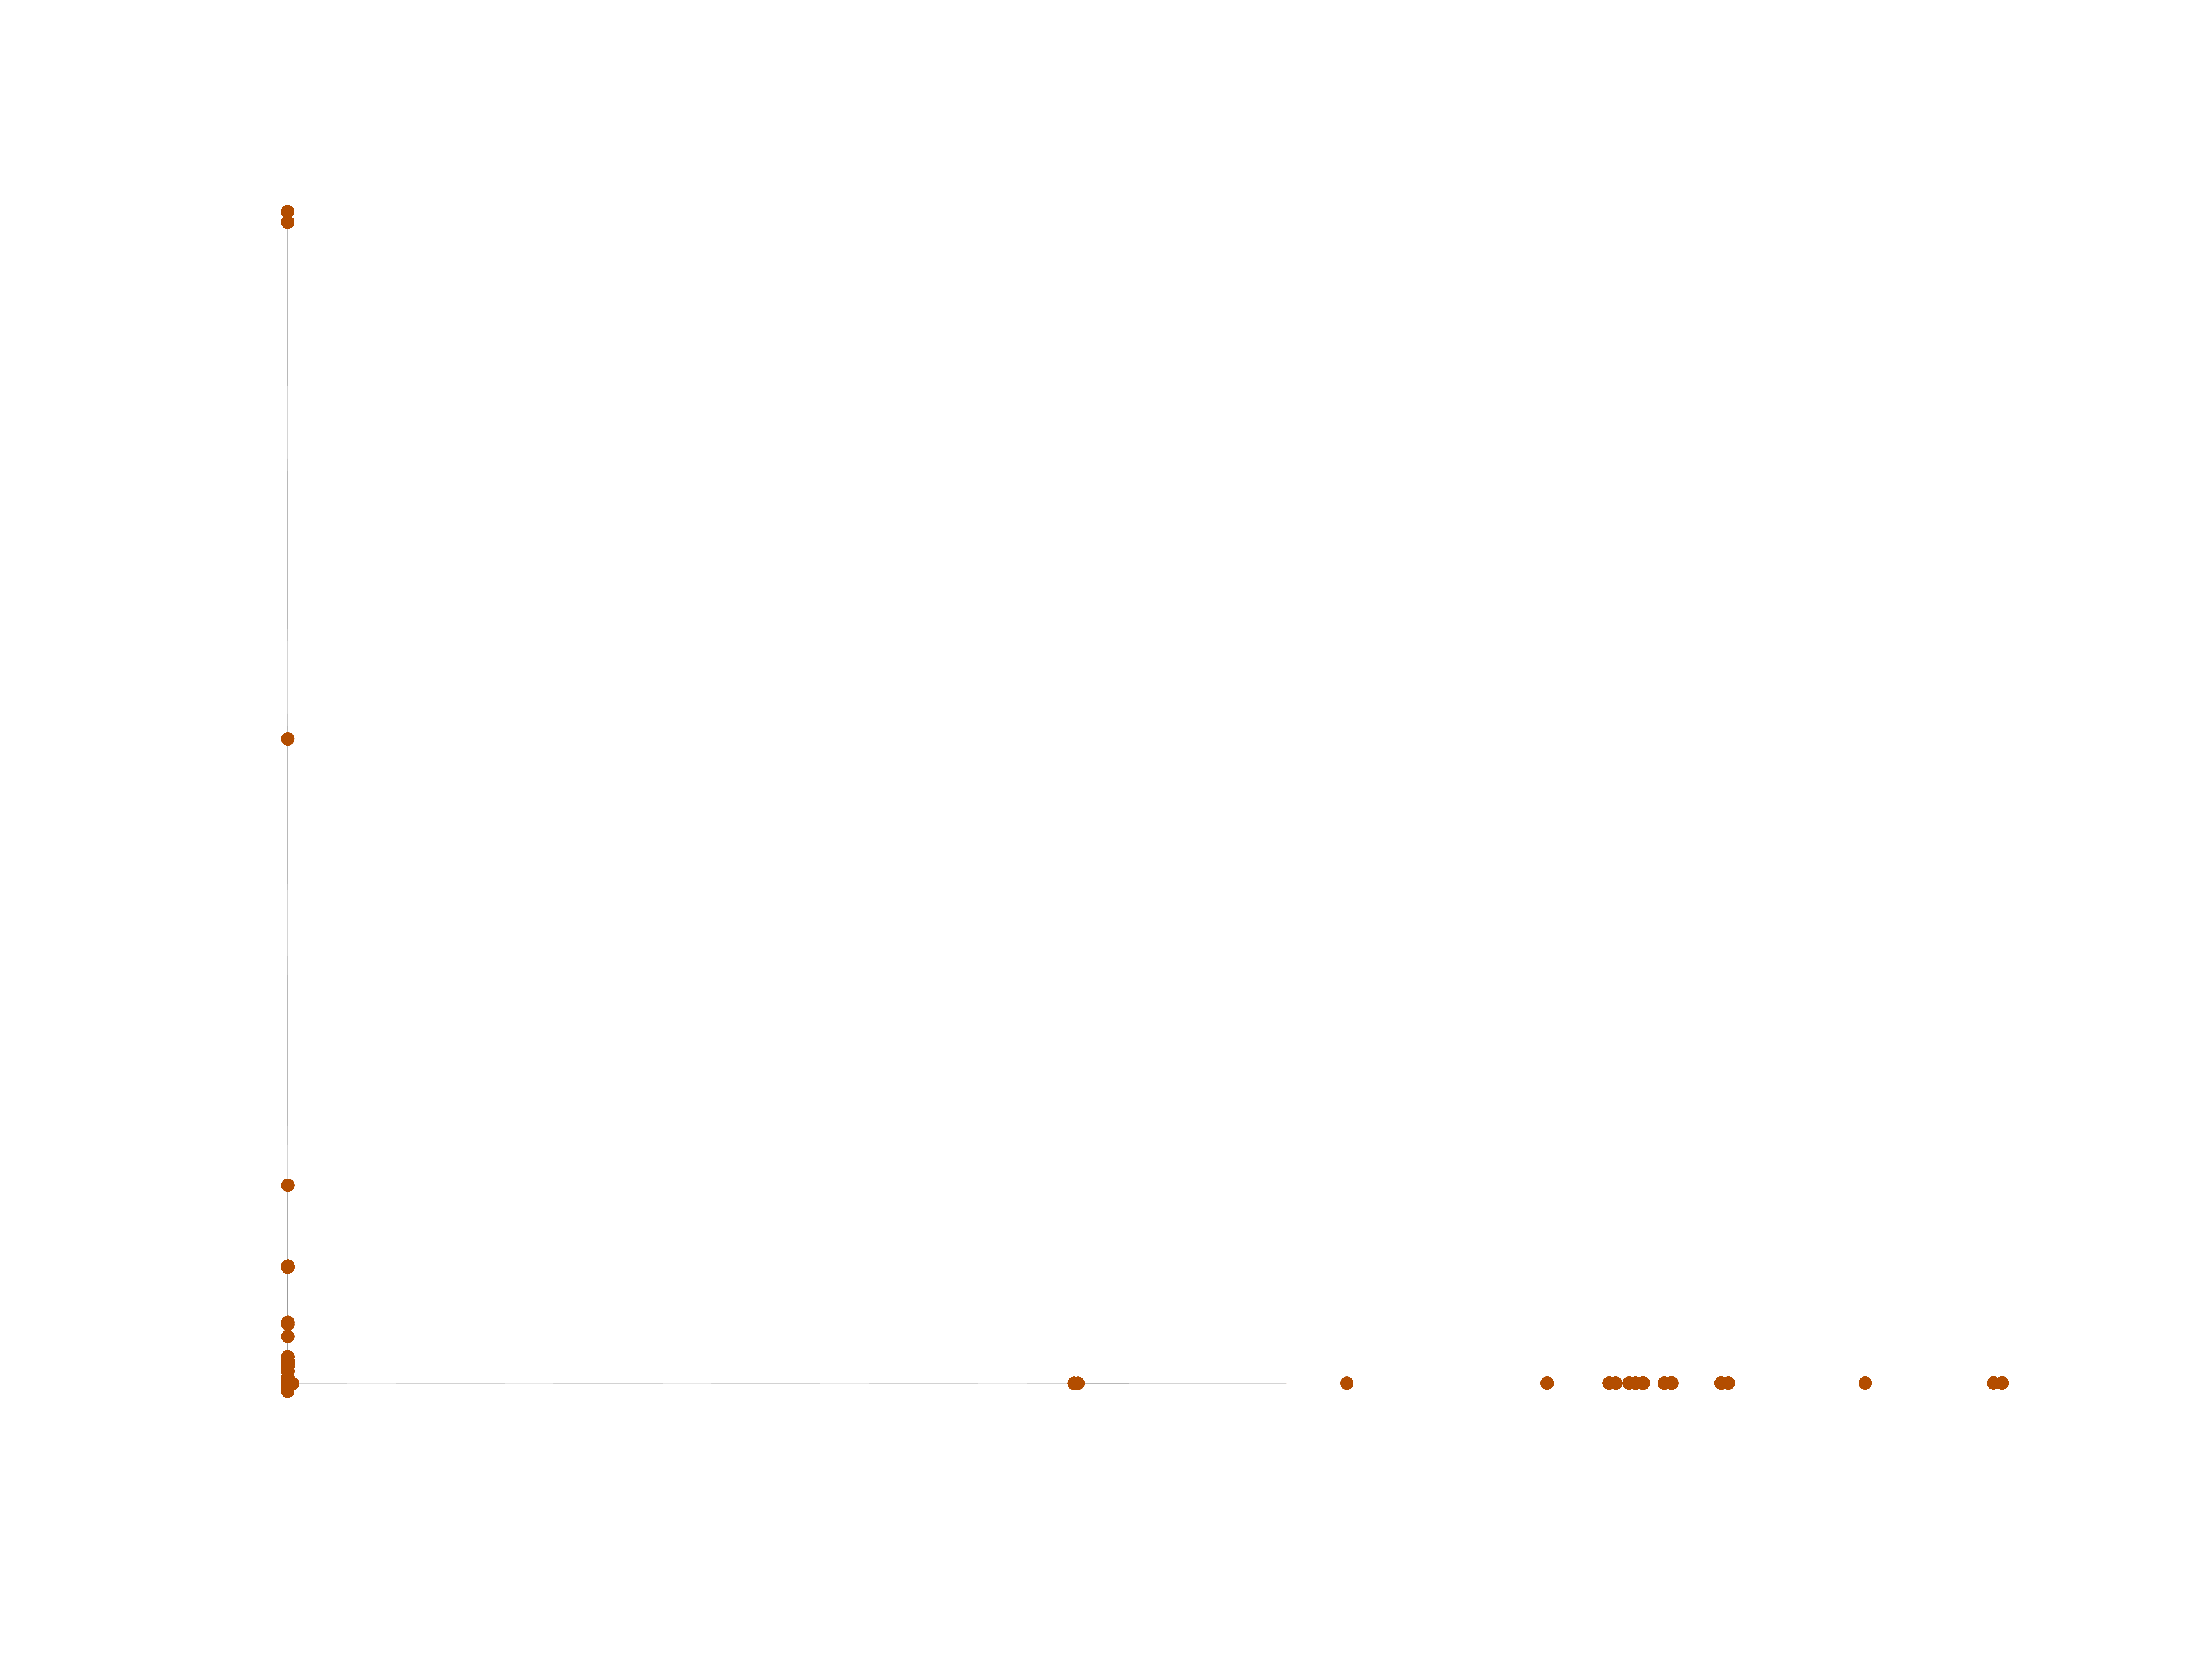
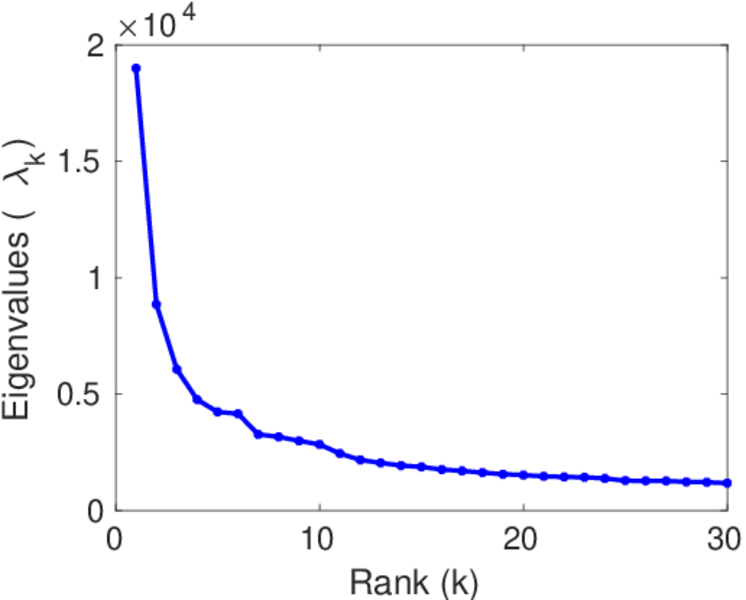
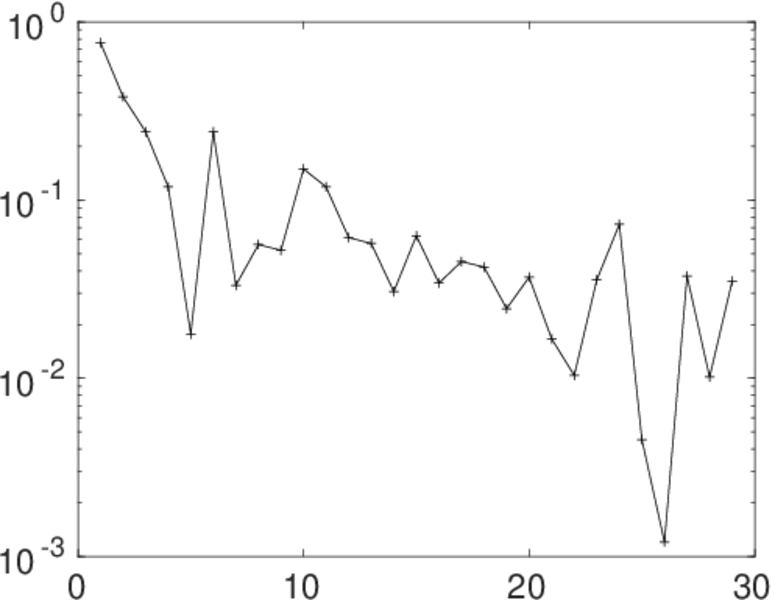
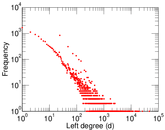
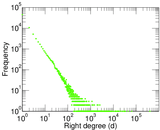
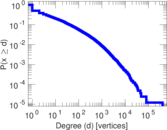
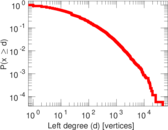
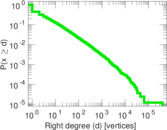
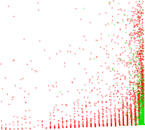
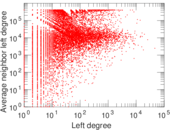
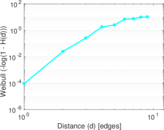
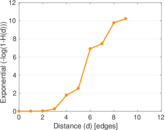
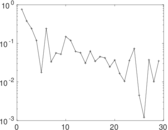
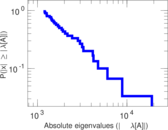
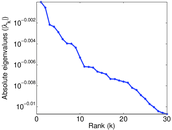
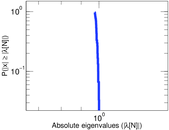
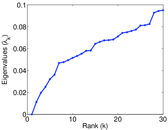
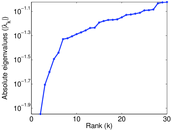
Plots


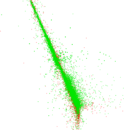
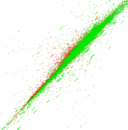


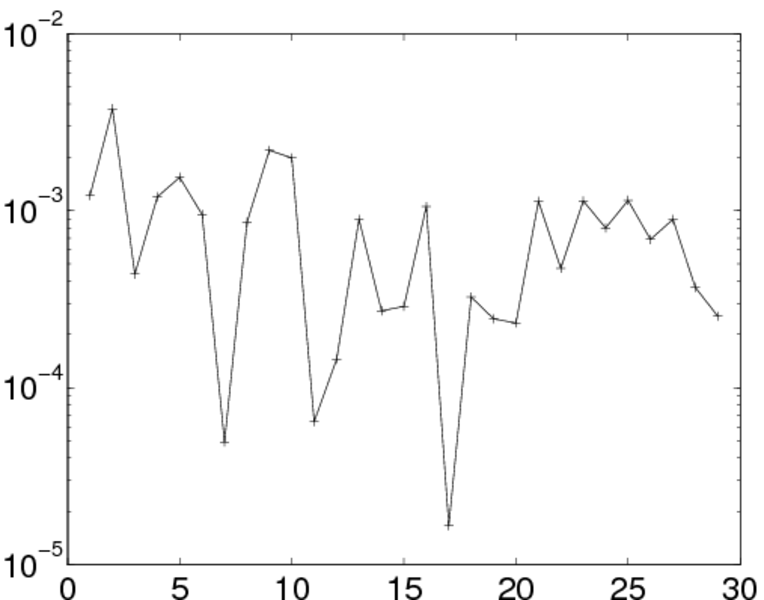
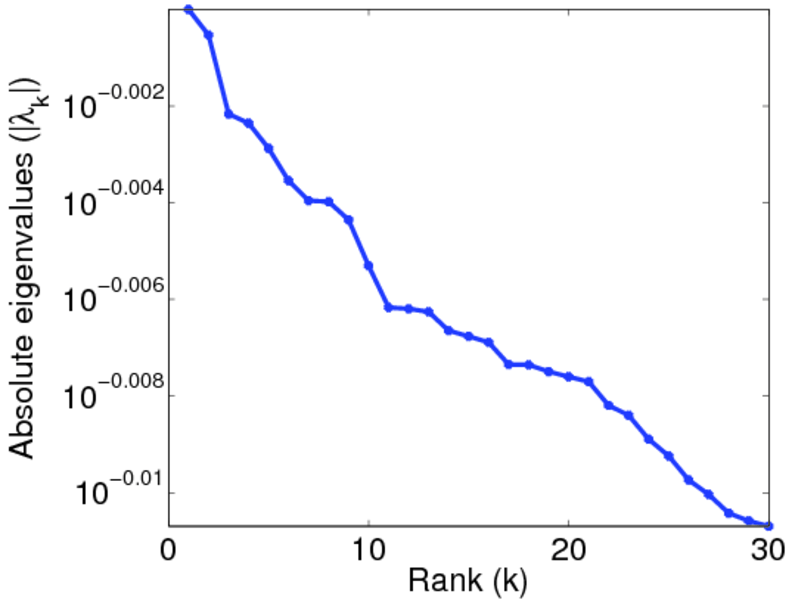
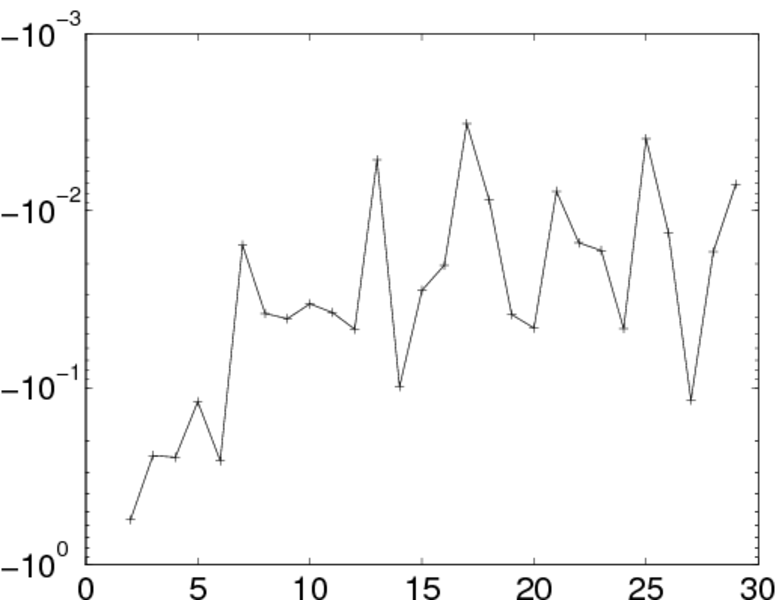
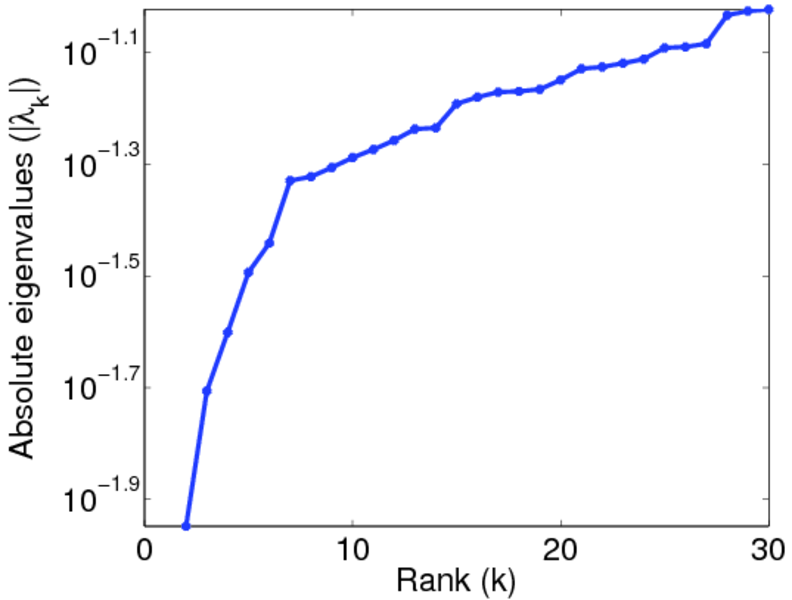
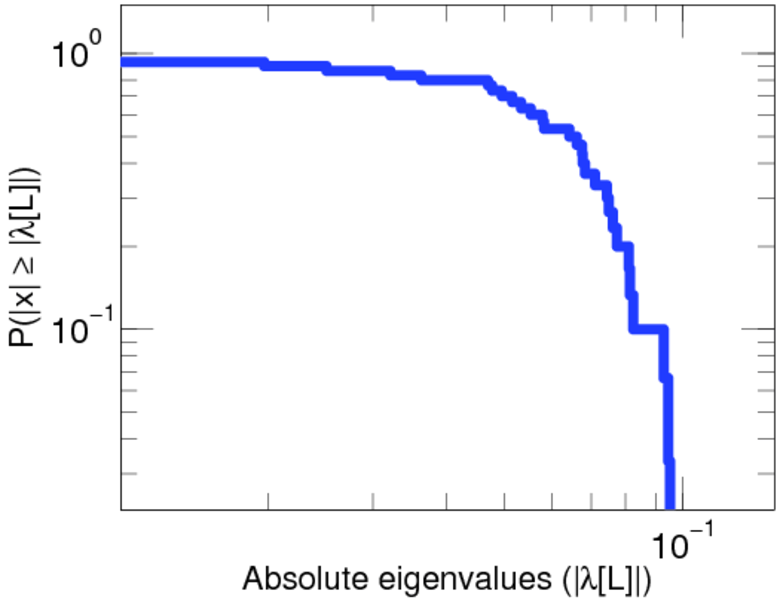
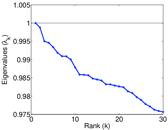
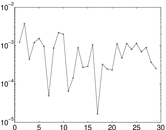
Matrix decompositions plots


Downloads
References
|
[1]
|
Jérôme Kunegis.
KONECT – The Koblenz Network Collection.
In Proc. Int. Conf. on World Wide Web Companion, pages
1343–1350, 2013.
[ http ]
|
|
[2]
|
Nicolas Neubauer and Klaus Obermayer.
Analysis of the Visualize.us folksonomy.
Unpublished, 2010.
|
 KONECT ‣ Networks ‣
Buy Me a Coffee
KONECT ‣ Networks ‣
Buy Me a Coffee