Prosper listings
This is the bipartite network of members of the loan website Prosper.com
watching individual listings.
Metadata
Statistics
| Size | n = | 23,965
|
| Left size | n1 = | 1,732
|
| Right size | n2 = | 22,233
|
| Volume | m = | 35,377
|
| Wedge count | s = | 1,969,047
|
| Claw count | z = | 91,785,227
|
| Cross count | x = | 3,474,210,963
|
| Square count | q = | 35,039
|
| 4-Tour count | T4 = | 8,227,890
|
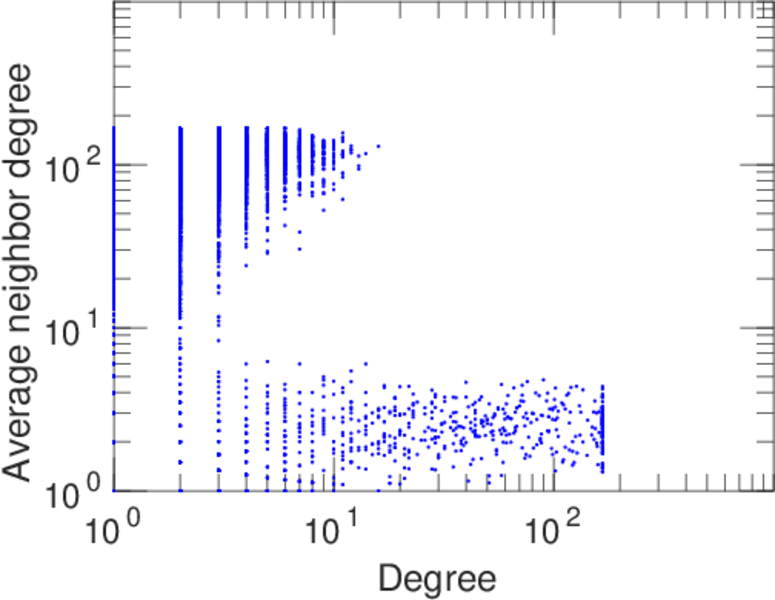
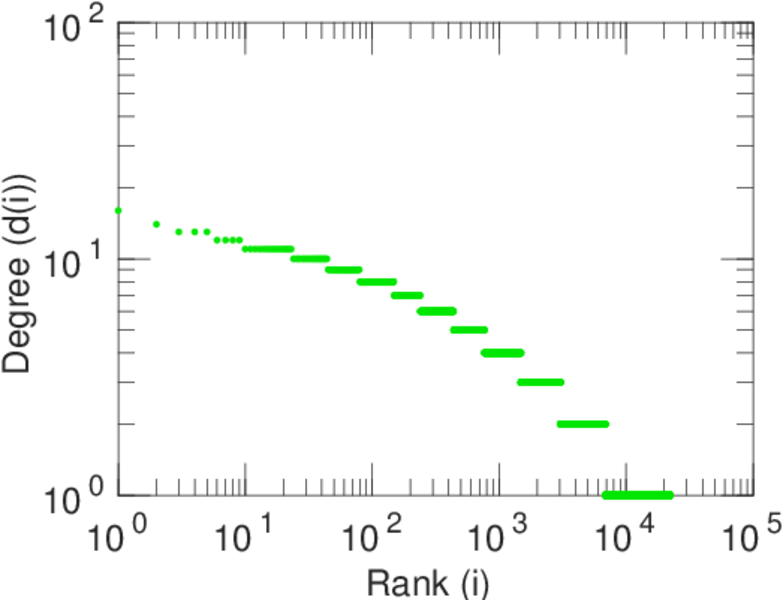
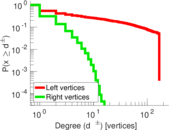
| Maximum degree | dmax = | 167
|
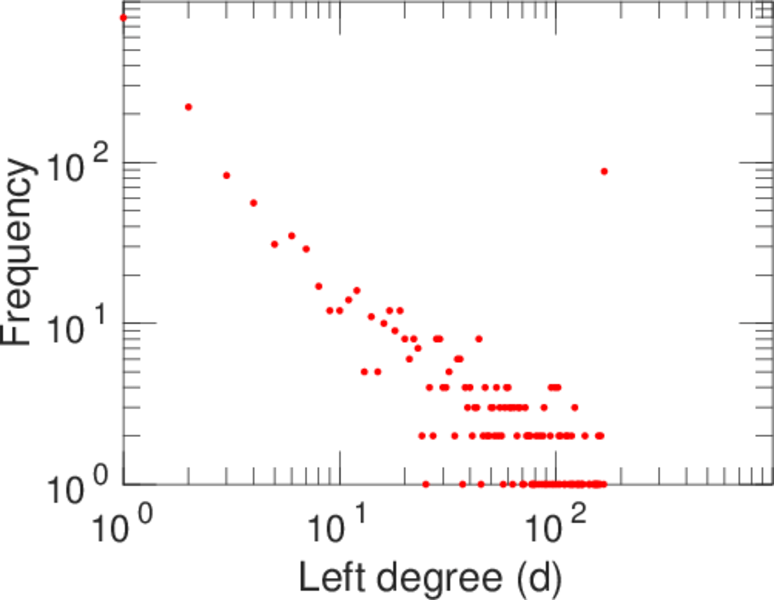
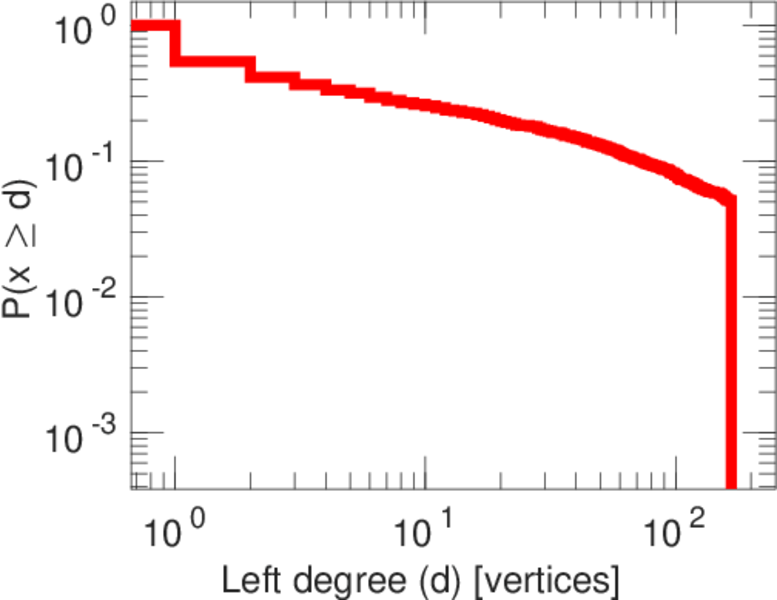
| Maximum left degree | d1max = | 167
|
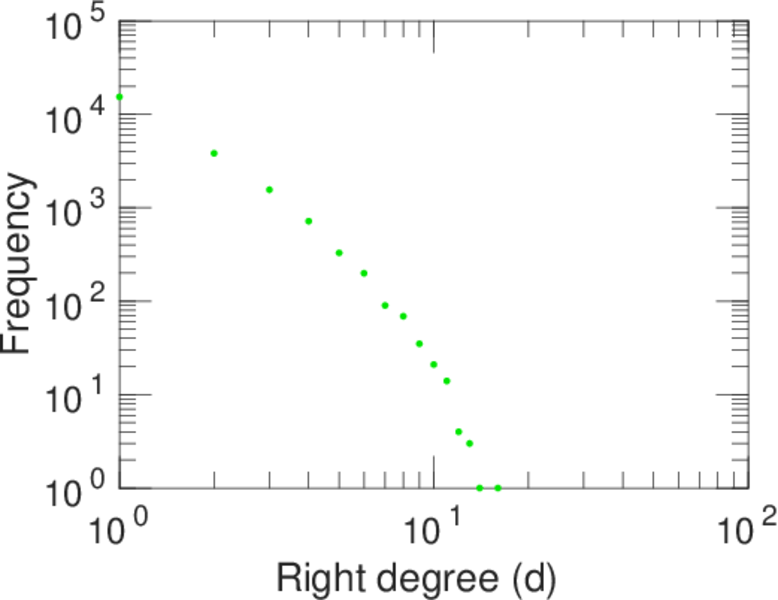
| Maximum right degree | d2max = | 16
|
| Average degree | d = | 2.952 39
|
| Average left degree | d1 = | 20.425 5
|
| Average right degree | d2 = | 1.591 19
|
| Fill | p = | 0.000 918 703
|
| Size of LCC | N = | 21,630
|
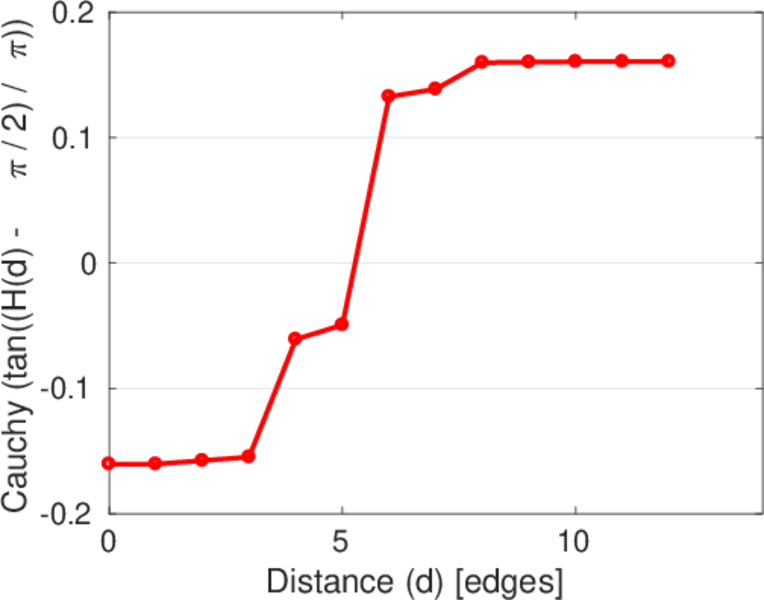
| Diameter | δ = | 14
|
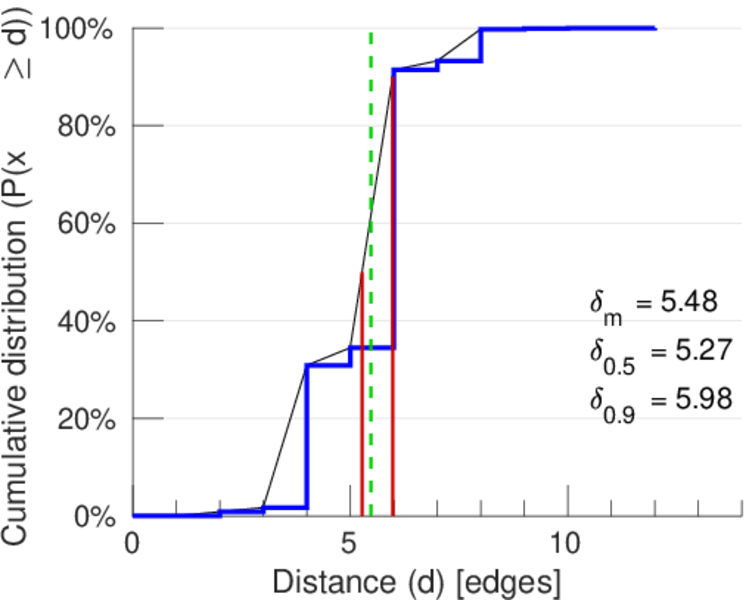
| 50-Percentile effective diameter | δ0.5 = | 5.272 98
|
| 90-Percentile effective diameter | δ0.9 = | 5.975 34
|
| Median distance | δM = | 6
|
| Mean distance | δm = | 5.478 14
|
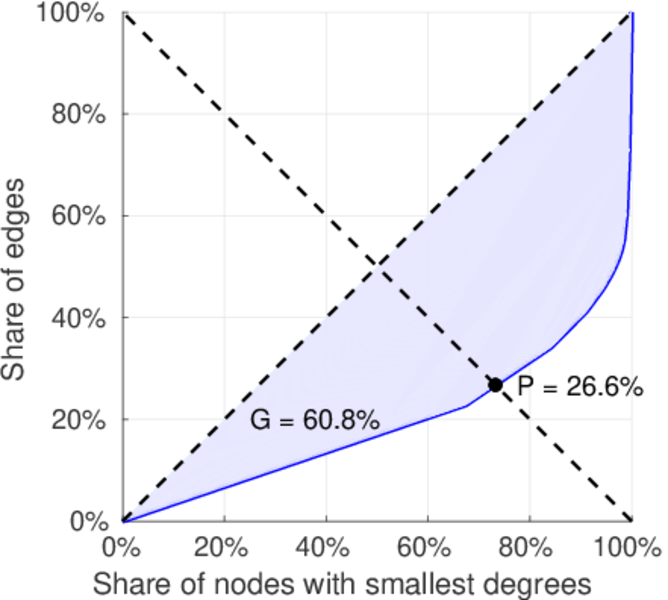
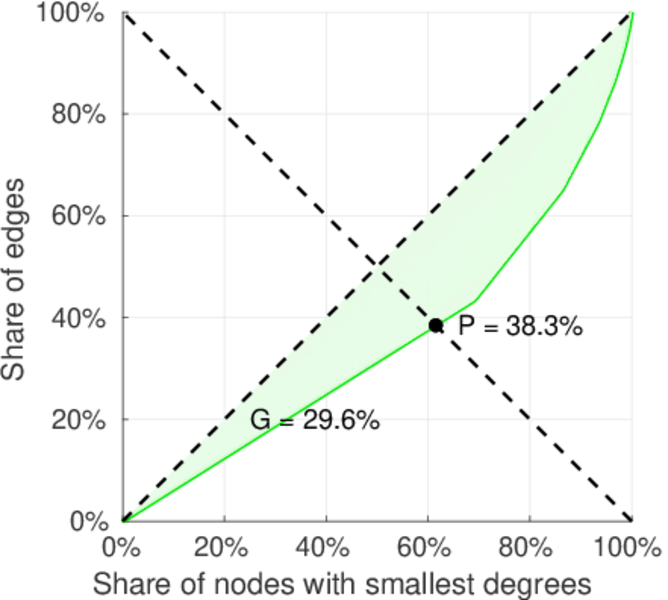
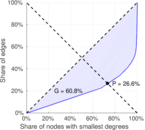
| Gini coefficient | G = | 0.627 028
|
| Balanced inequality ratio | P = | 0.257 371
|
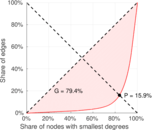
| Left balanced inequality ratio | P1 = | 0.158 860
|
| Right balanced inequality ratio | P2 = | 0.383 356
|
| Relative edge distribution entropy | Her = | 0.859 217
|
| Power law exponent | γ = | 3.643 59
|
| Tail power law exponent | γt = | 2.291 00
|
| Tail power law exponent with p | γ3 = | 2.291 00
|
| p-value | p = | 0.000 00
|
| Left tail power law exponent with p | γ3,1 = | 1.551 00
|
| Left p-value | p1 = | 0.000 00
|
| Right tail power law exponent with p | γ3,2 = | 4.031 00
|
| Right p-value | p2 = | 0.000 00
|
| Degree assortativity | ρ = | +0.044 751 8
|
| Degree assortativity p-value | pρ = | 3.726 77 × 10−17
|
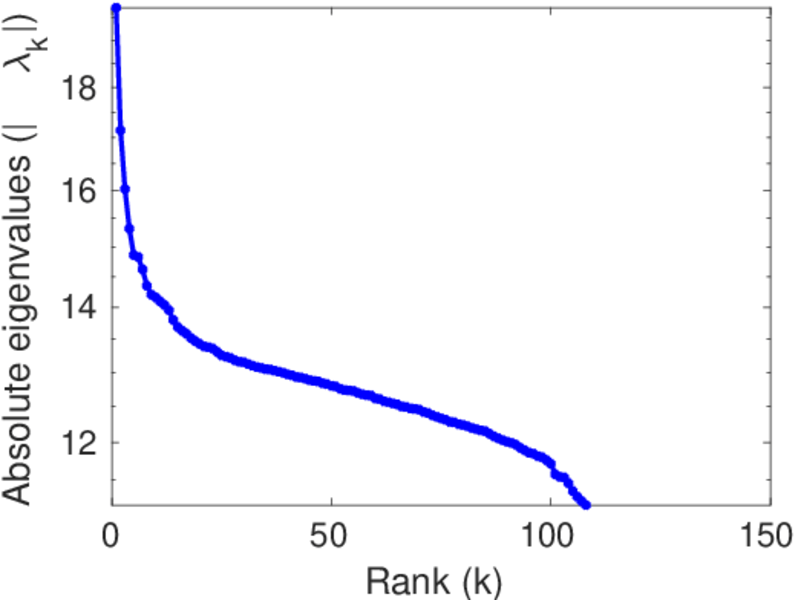
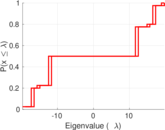
| Spectral norm | α = | 19.721 3
|
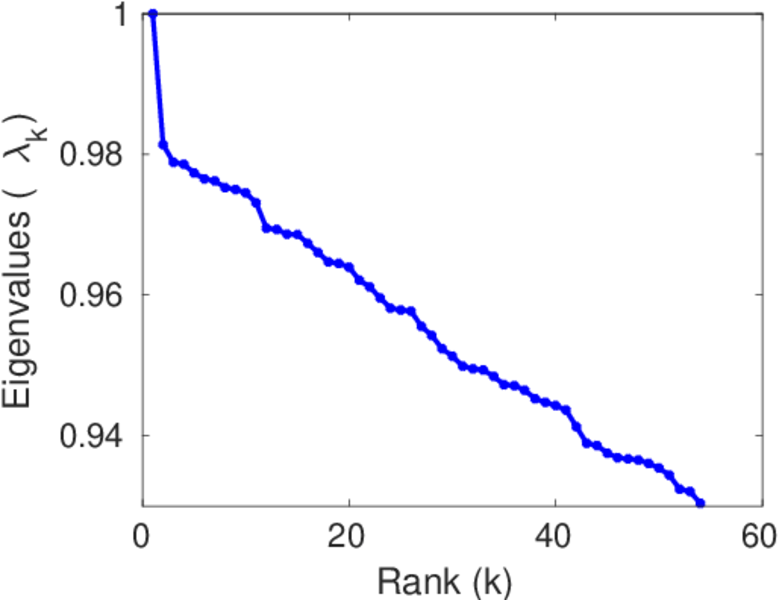
| Algebraic connectivity | a = | 0.035 457 5
|
| Spectral separation | |λ1[A] / λ2[A]| = | 1.150 51
|
| Controllability | C = | 20,503
|
| Relative controllability | Cr = | 0.855 539
|
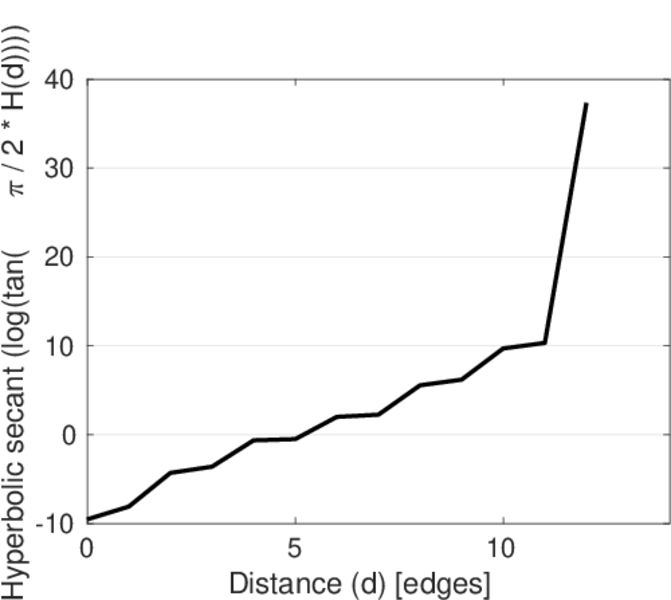
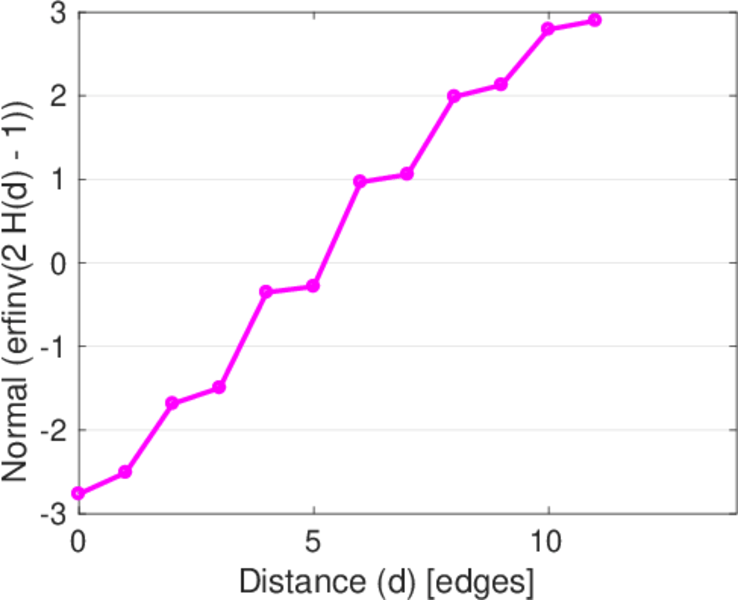
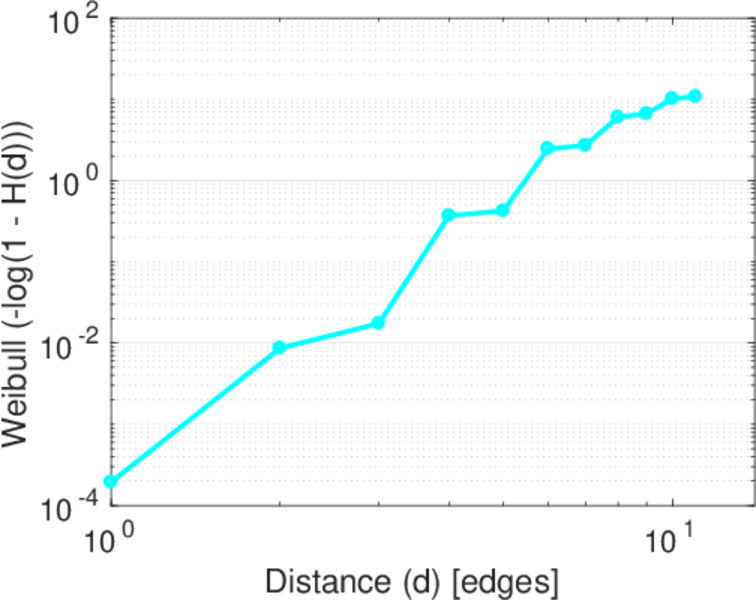
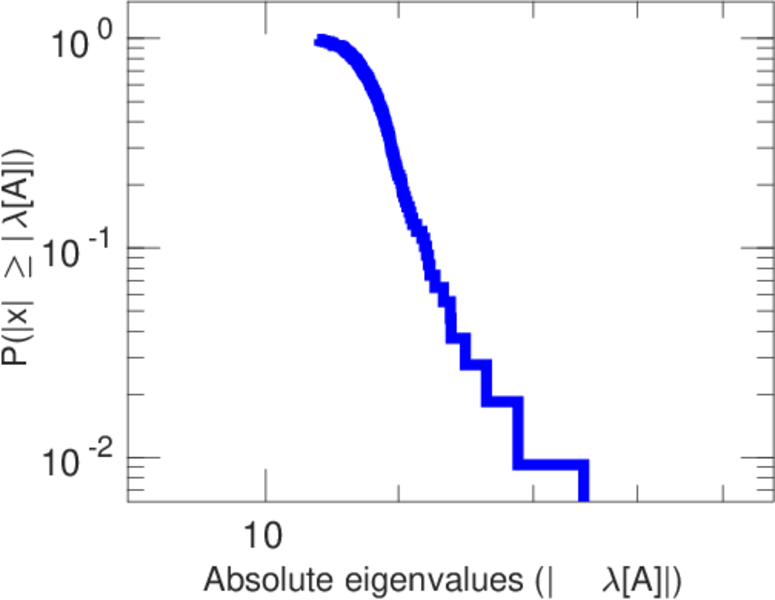
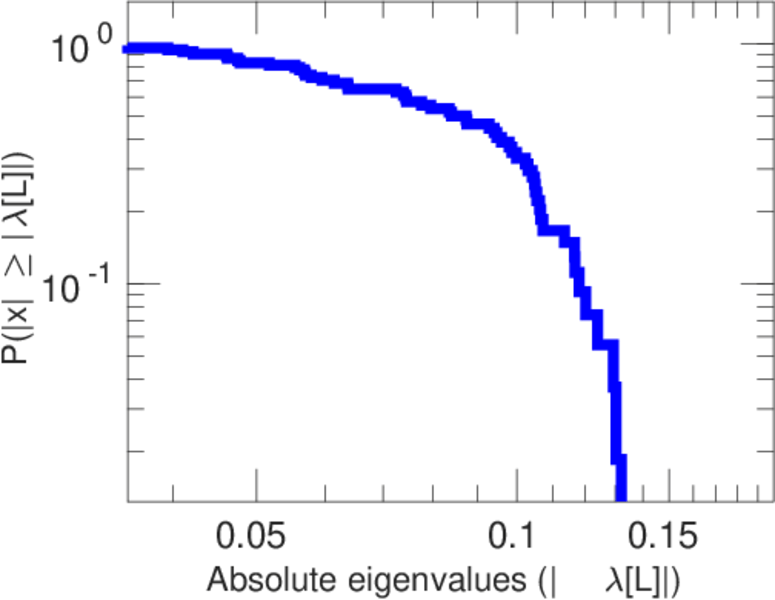
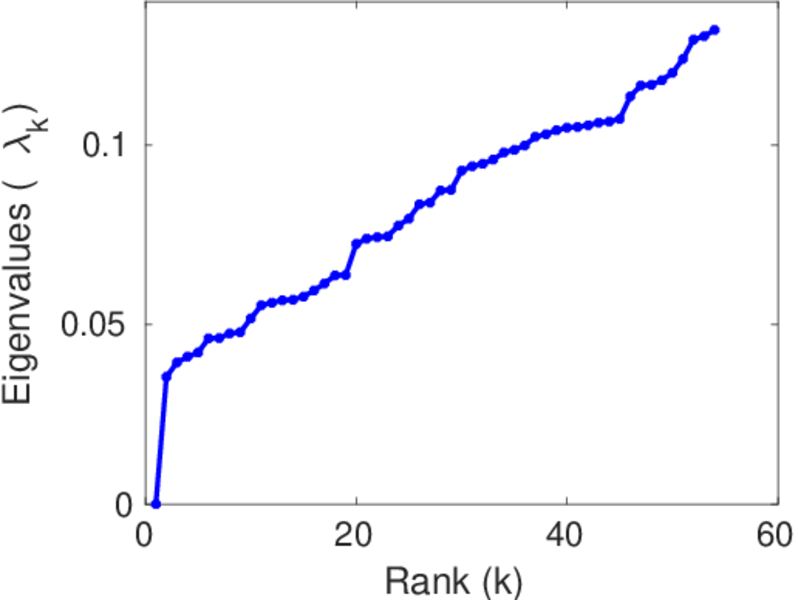
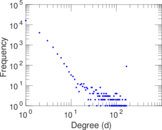
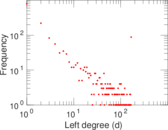
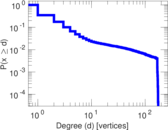
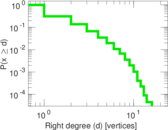
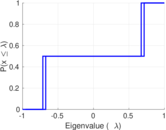
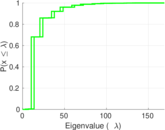
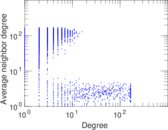
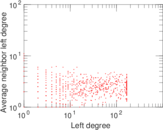
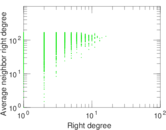
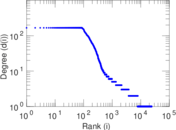
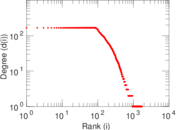
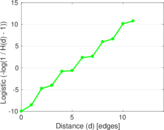
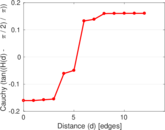
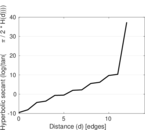
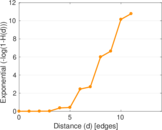
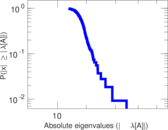
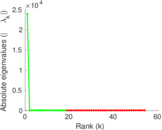
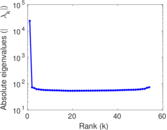
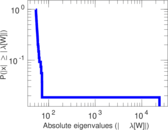
Plots


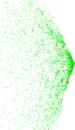
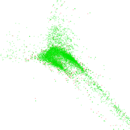


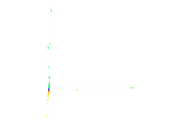


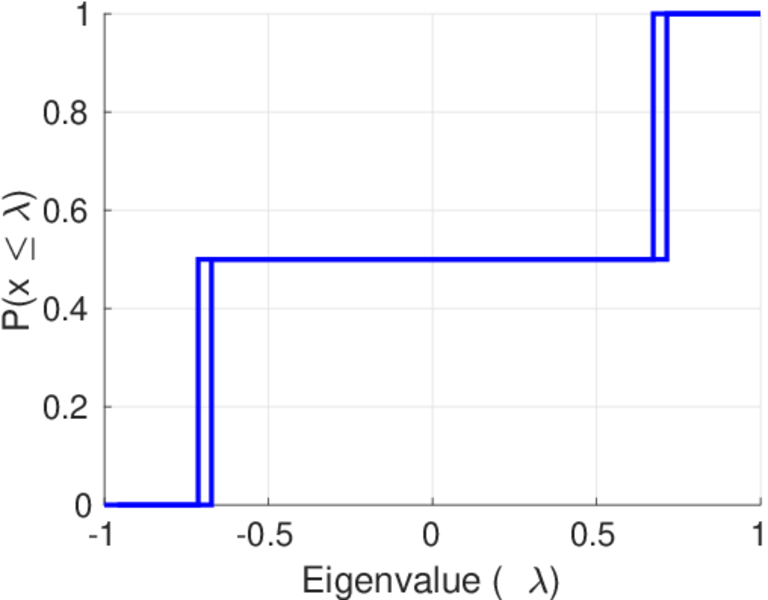
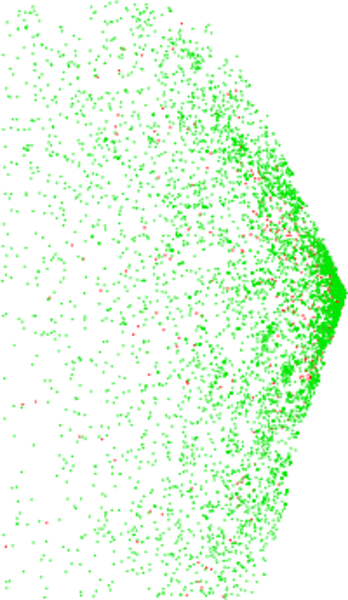
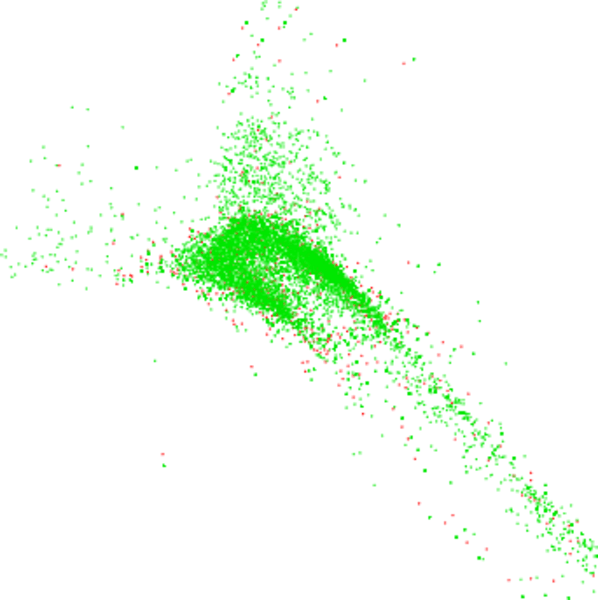
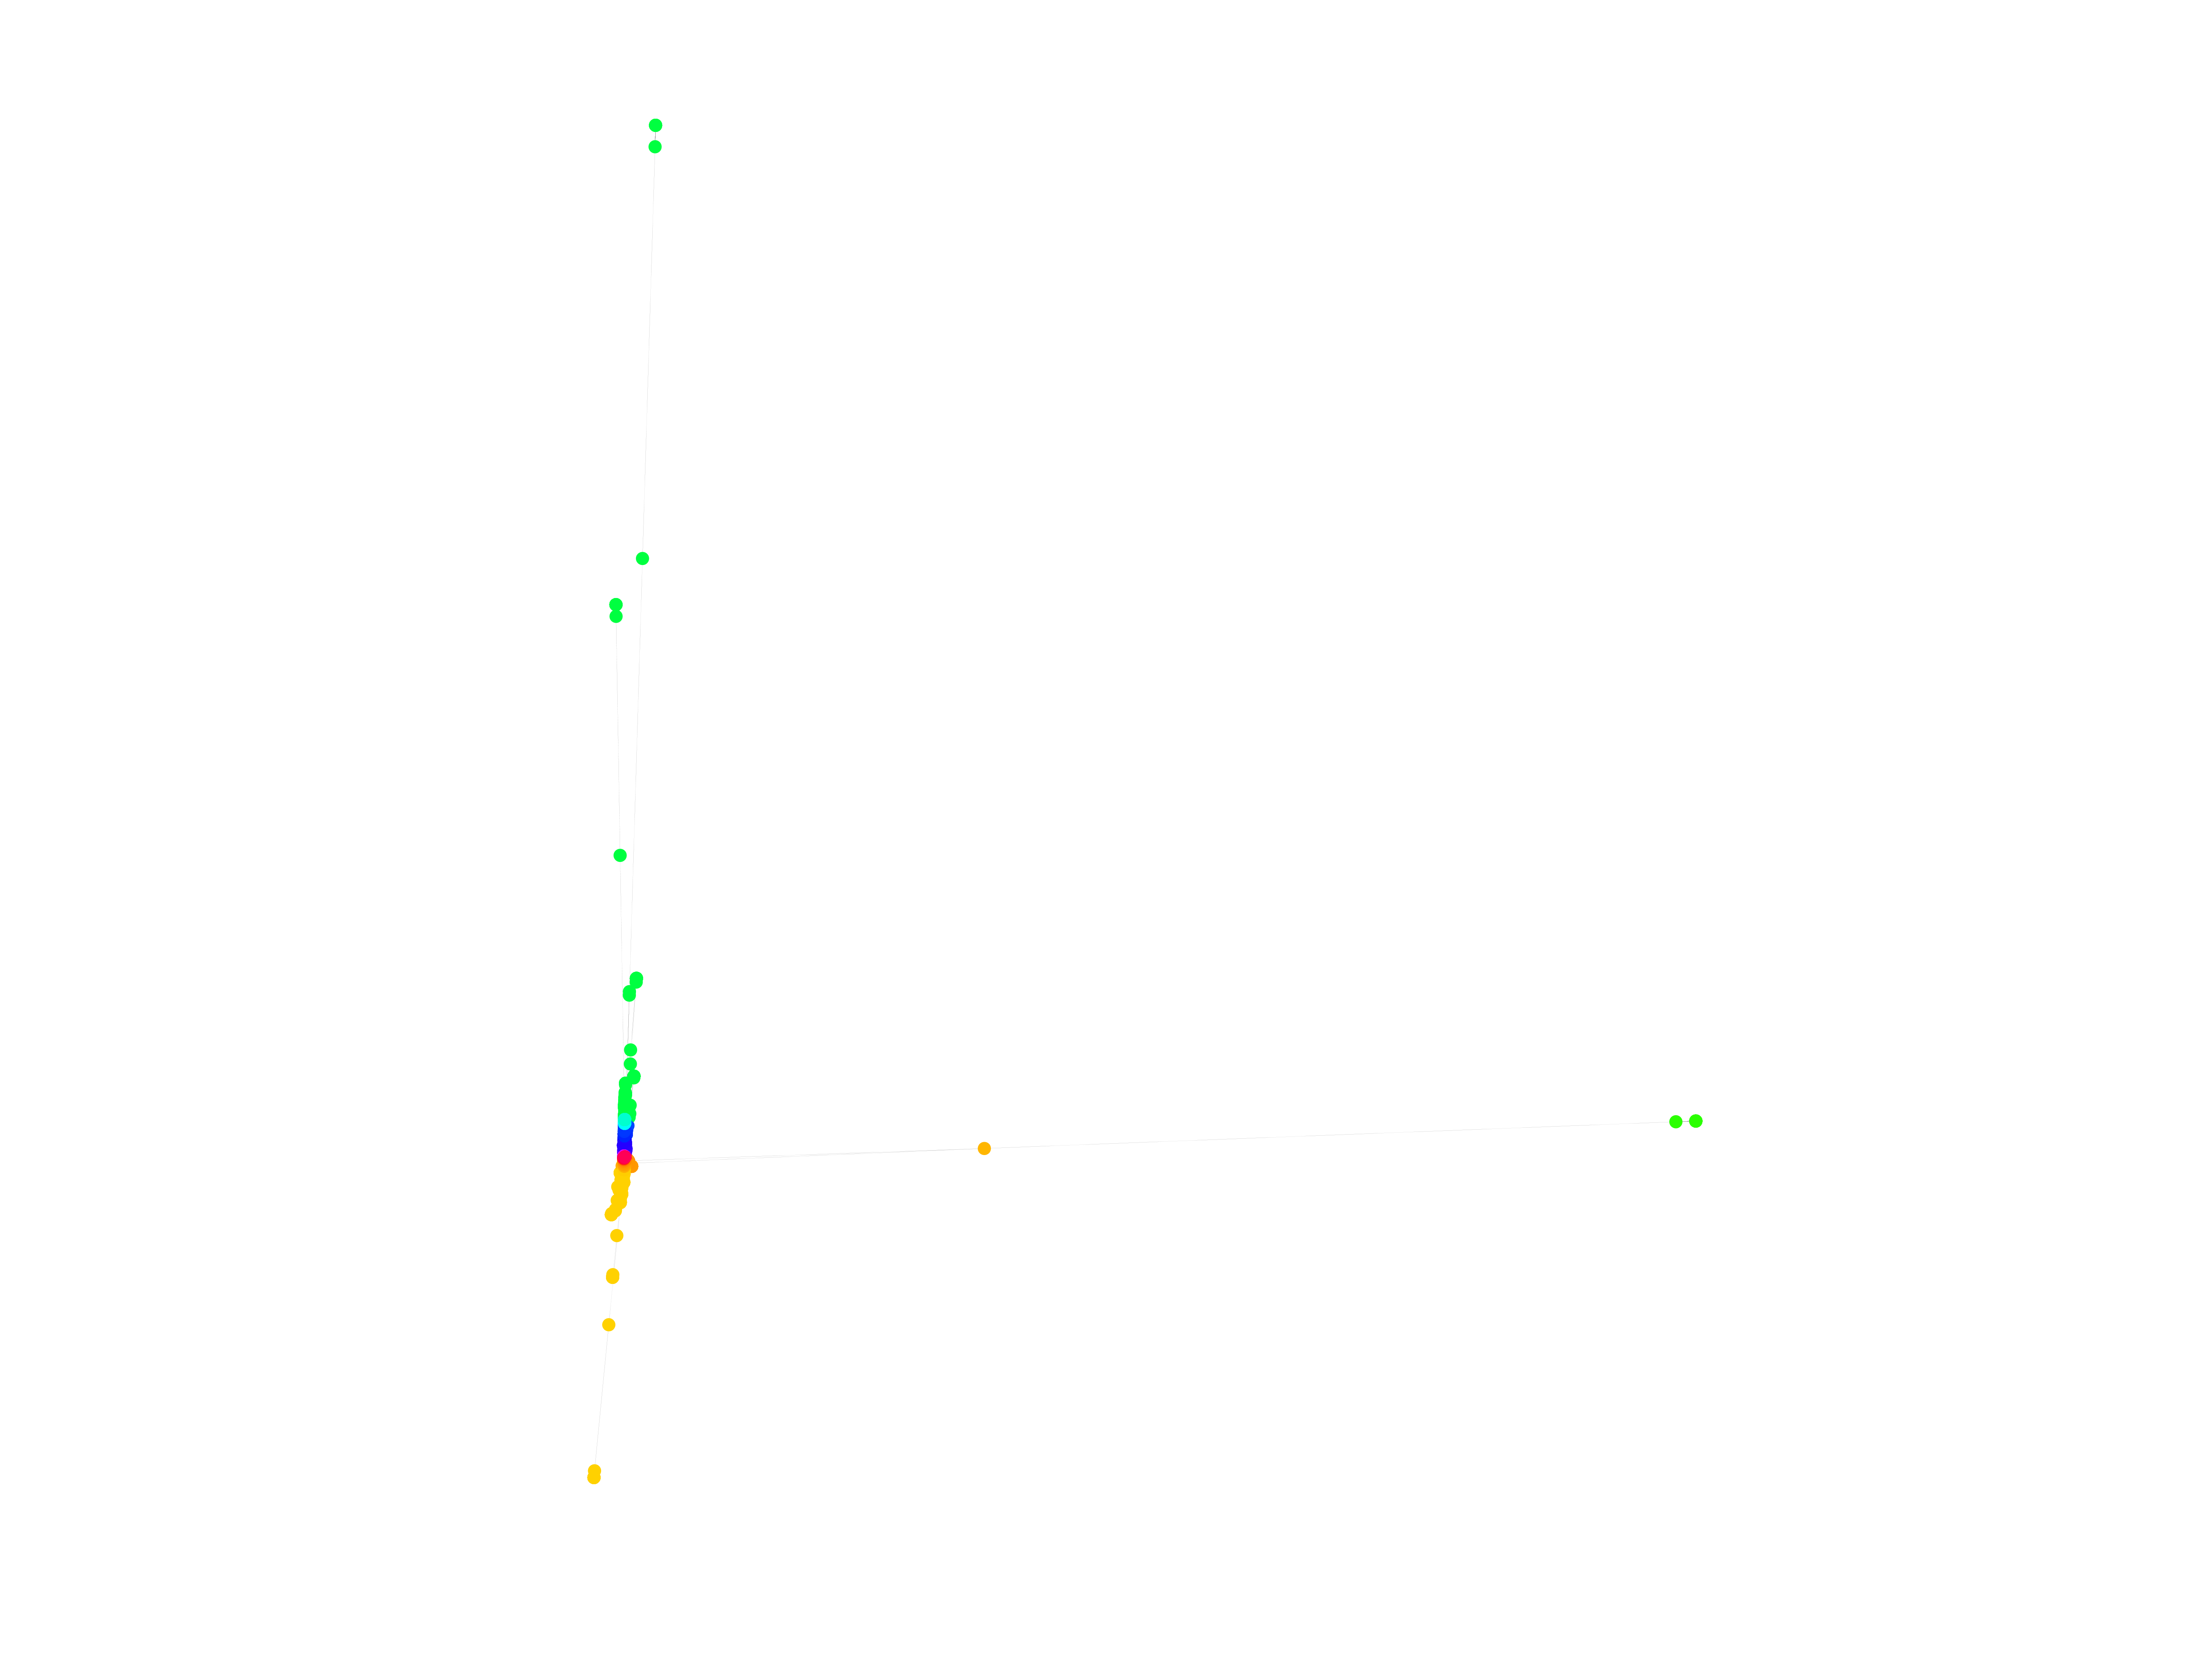
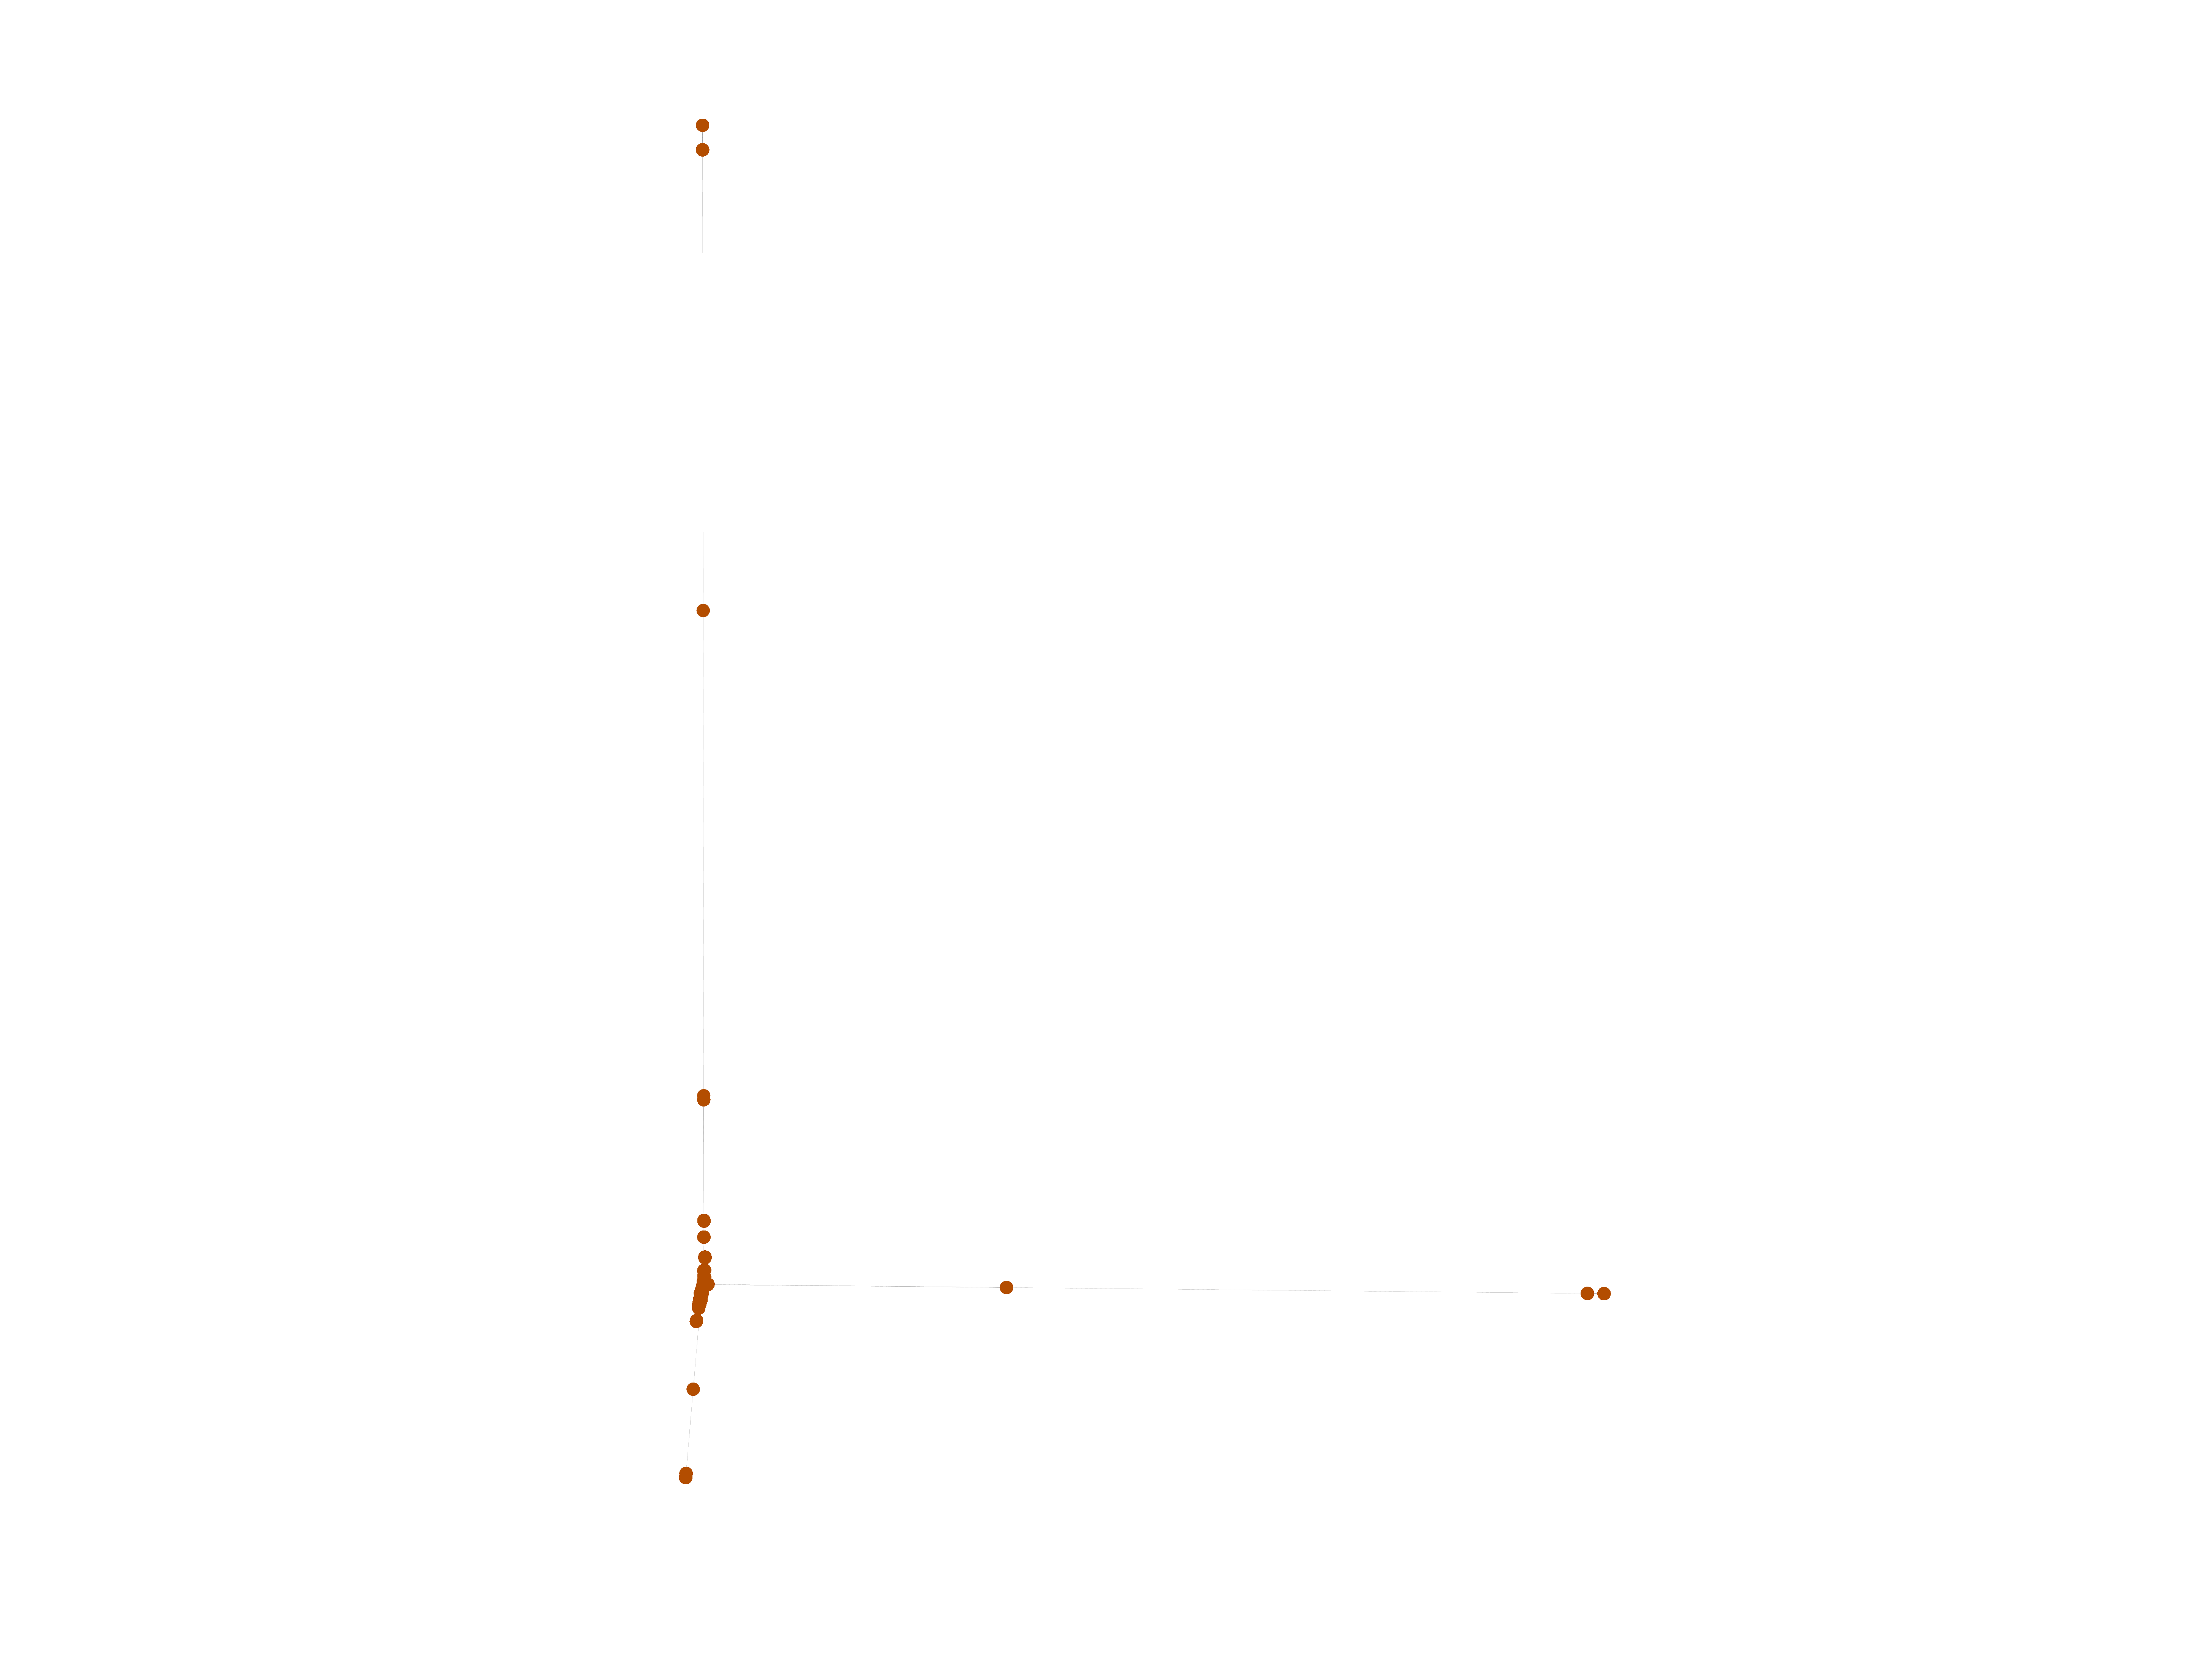
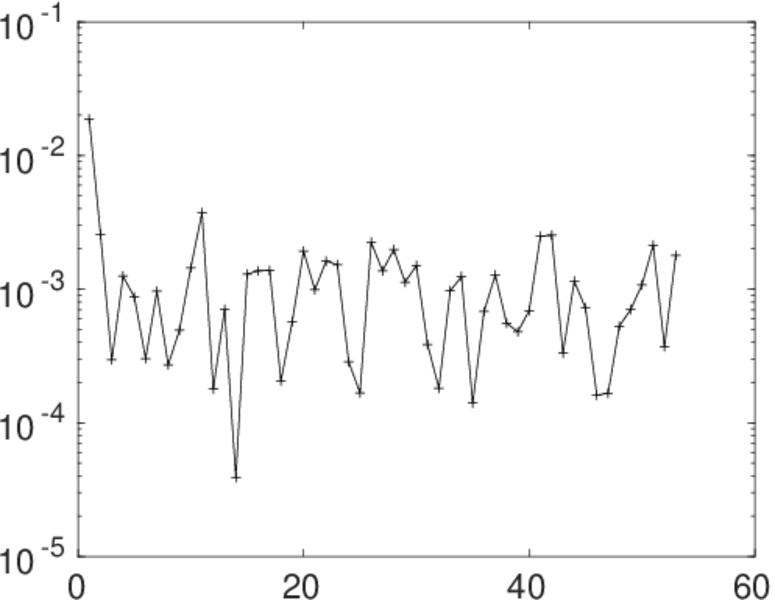
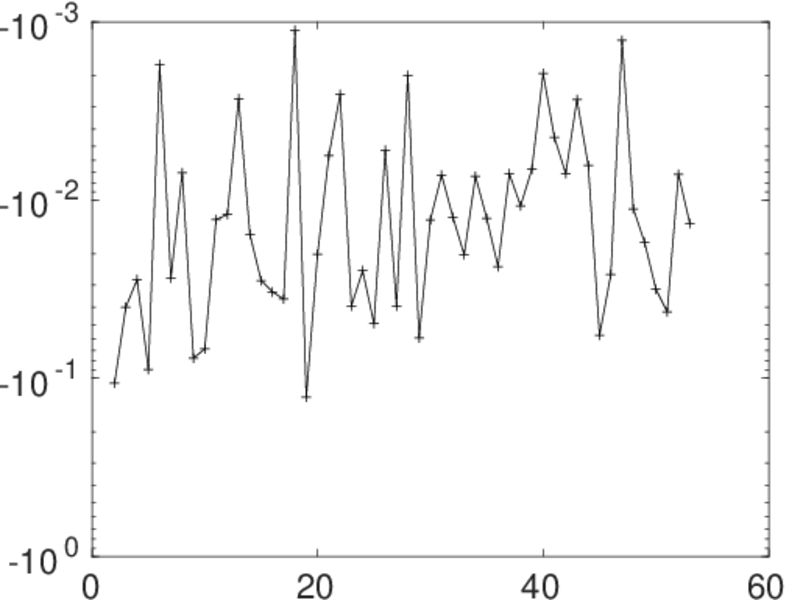
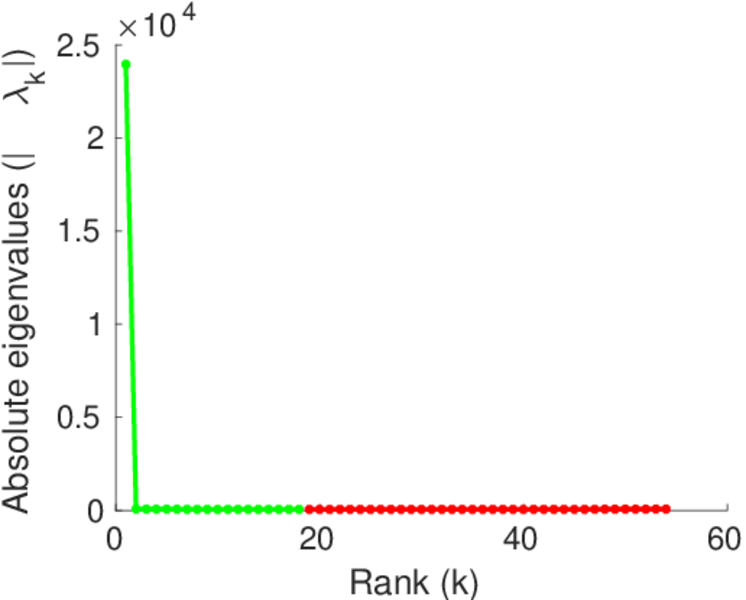
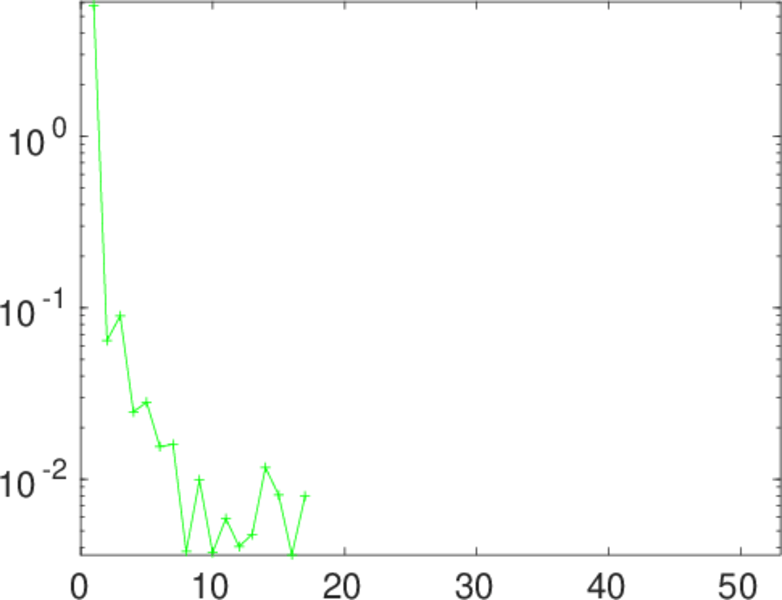
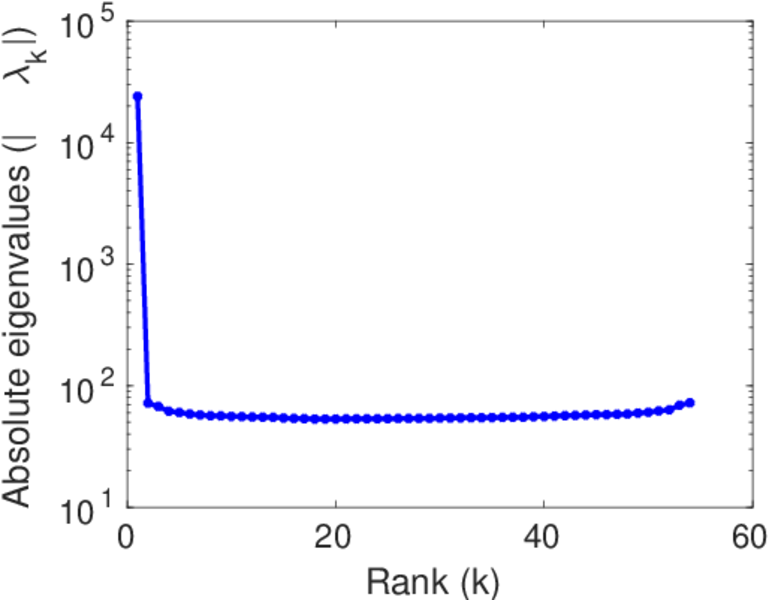
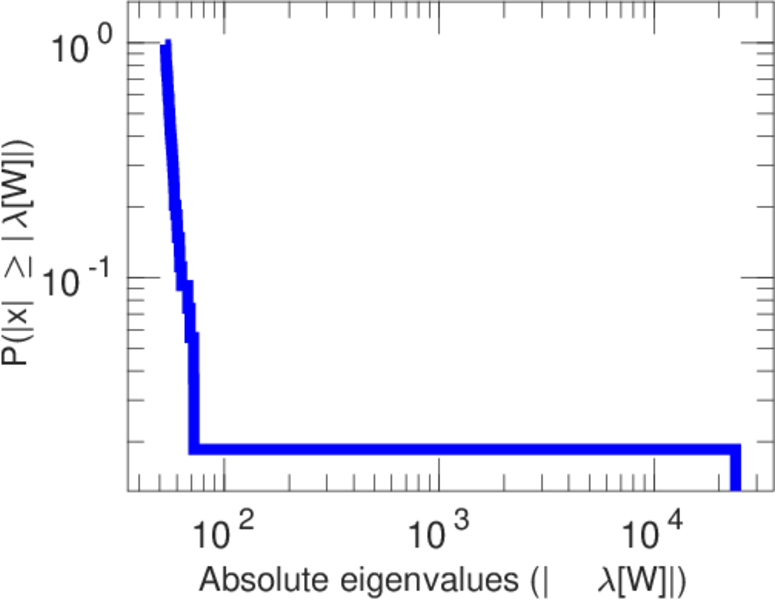
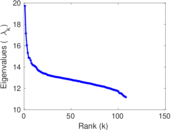
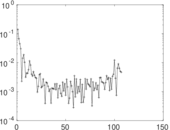
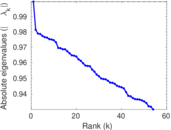
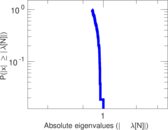
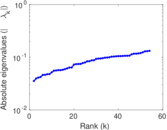
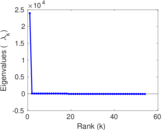
Matrix decompositions plots


Downloads
References
|
[1]
|
Jérôme Kunegis.
KONECT – The Koblenz Network Collection.
In Proc. Int. Conf. on World Wide Web Companion, pages
1343–1350, 2013.
[ http ]
|
|
[2]
|
Prosper Marketplace, Inc.
Prosper data export.
http://www.prosper.com/tools/DataExport.aspx, October 2010.
v1.2.6.
|
 KONECT ‣ Networks ‣
Buy Me a Coffee
KONECT ‣ Networks ‣
Buy Me a Coffee