 KONECT ‣ Networks ‣
Buy Me a Coffee
KONECT ‣ Networks ‣
Buy Me a Coffee
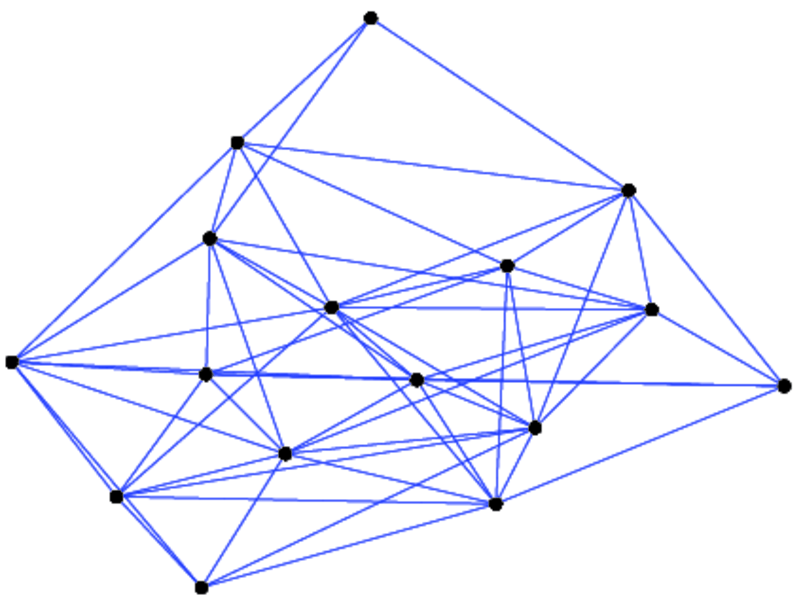
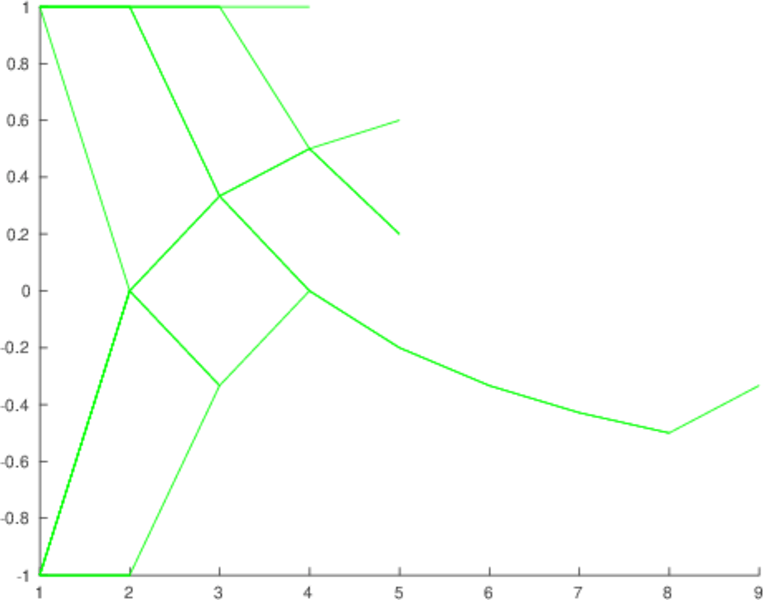
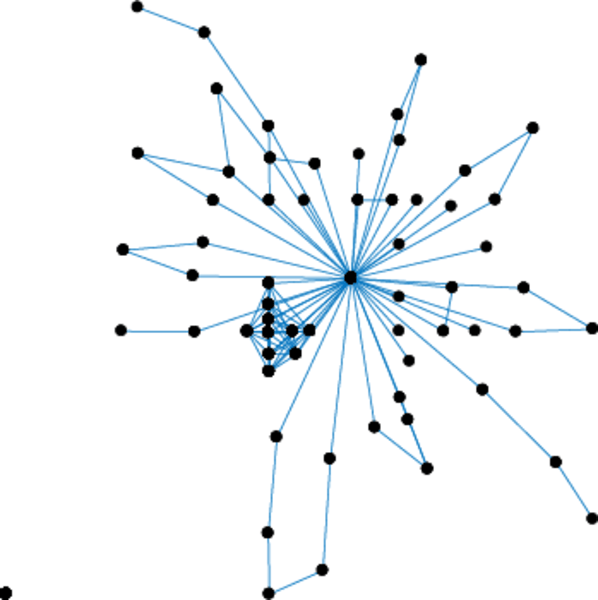
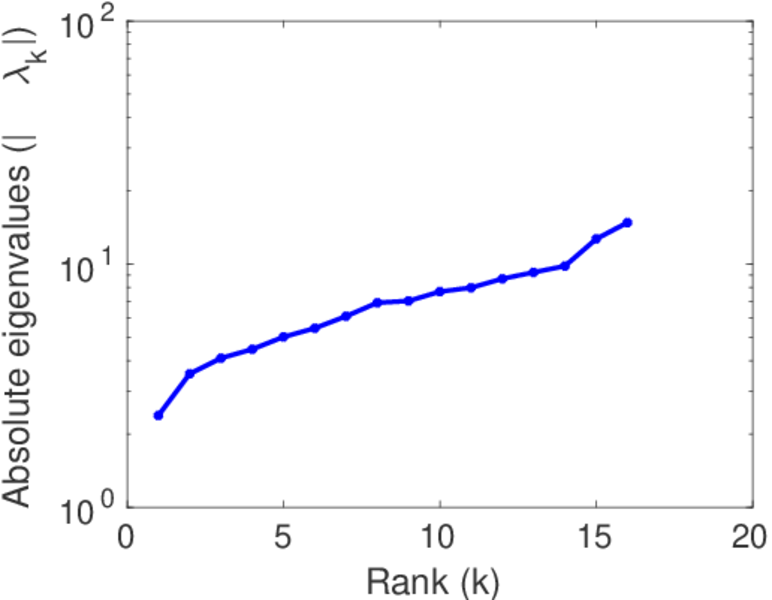
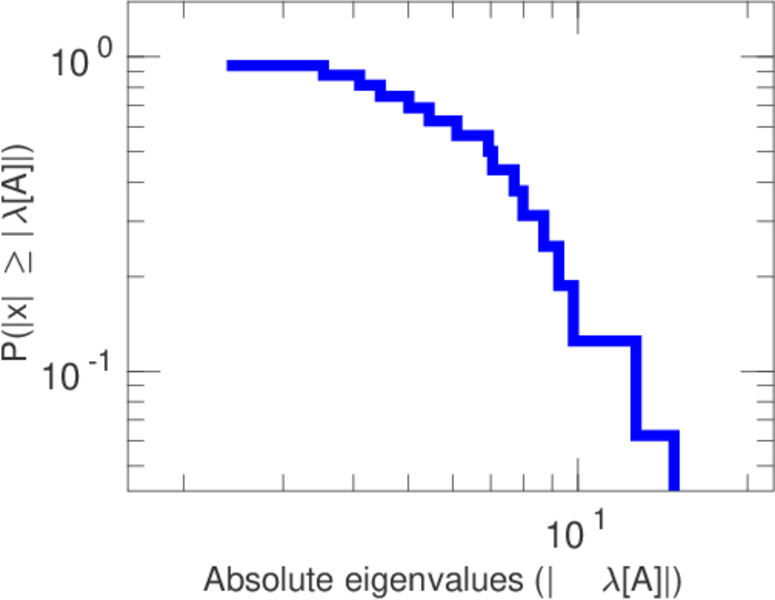
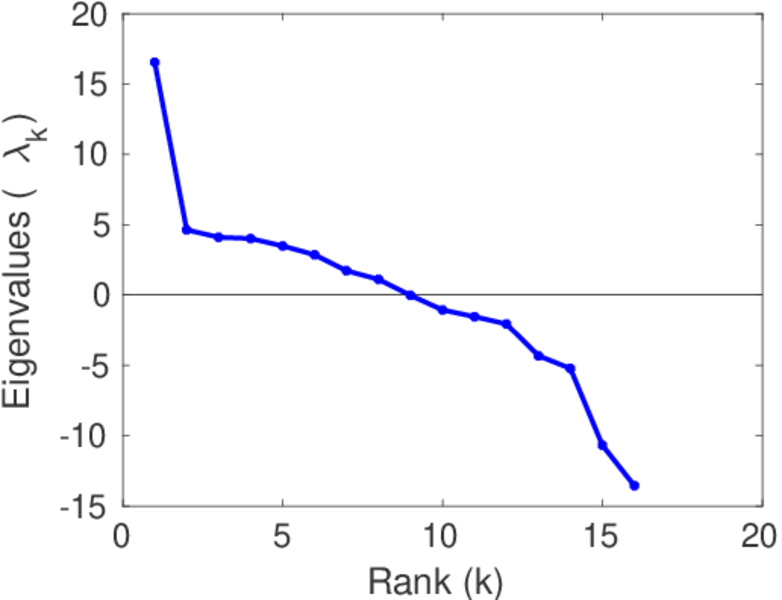
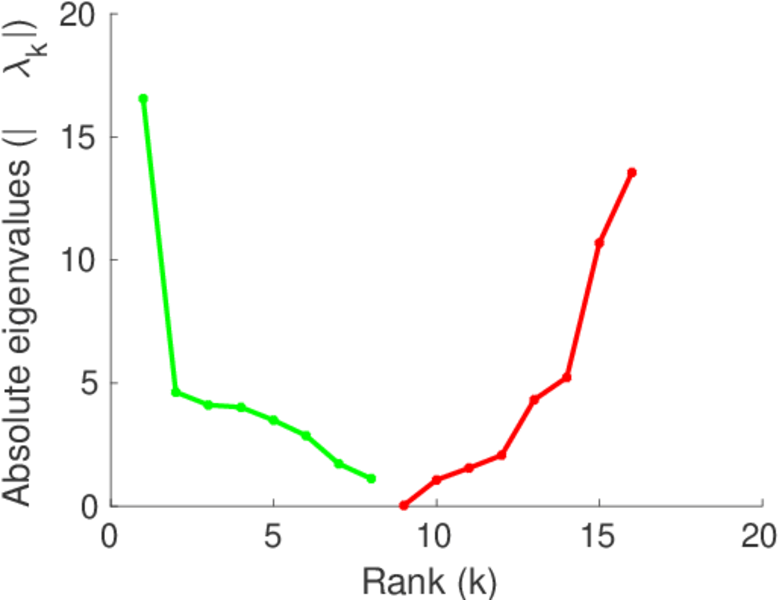
This is the signed social network of tribes of the Gahuku–Gama alliance structure of the Eastern Central Highlands of New Guinea, from Kenneth Read (1954). The network contains sixteen tribes connected by friendship ("rova") and enmity ("hina").
| Code | HT
| |
| Internal name | ucidata-gama
| |
| Name | Highland tribes | |
| Data source | http://vlado.fmf.uni-lj.si/pub/networks/data/ucinet/ucidata.htm#gama | |
| Availability | Dataset is available for download | |
| Consistency check | Dataset passed all tests | |
| Category | Human social network | |
| Node meaning | Tribe | |
| Edge meaning | Friendship | |
| Network format | Unipartite, undirected | |
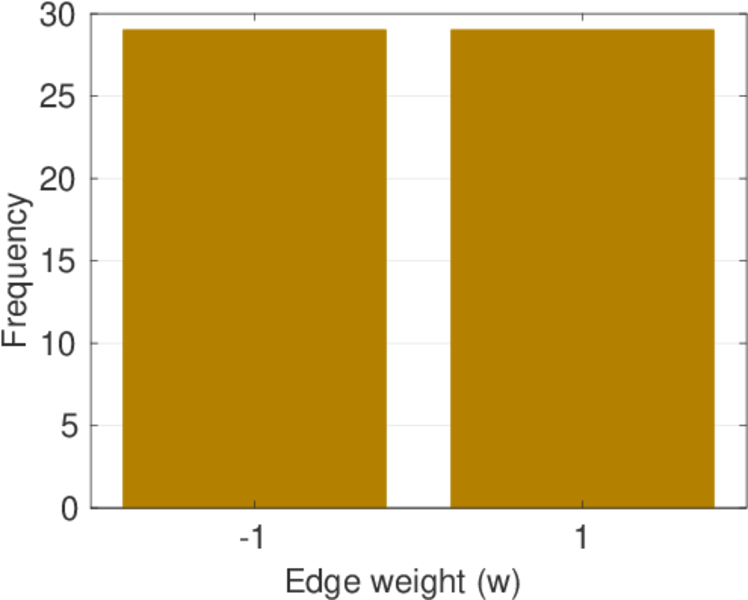
| Edge type | Signed, possibly weighted, no multiple edges | |
| Loops | Does not contain loops |


| [1] | Jérôme Kunegis. KONECT – The Koblenz Network Collection. In Proc. Int. Conf. on World Wide Web Companion, pages 1343–1350, 2013. [ http ] |
| [2] | Kenneth E. Read. Cultures of the Central Highlands, New Guinea. Southwestern J. of Anthropol., 10(1):1–43, 1954. |