Unicode languages

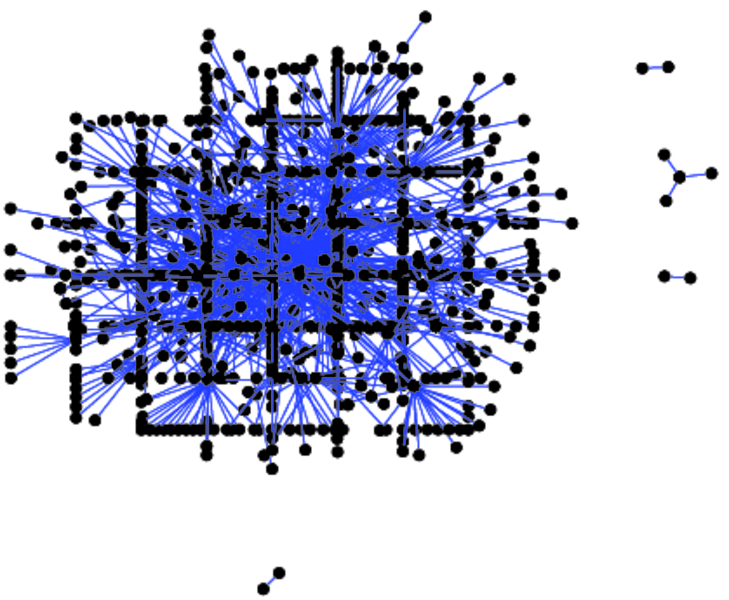
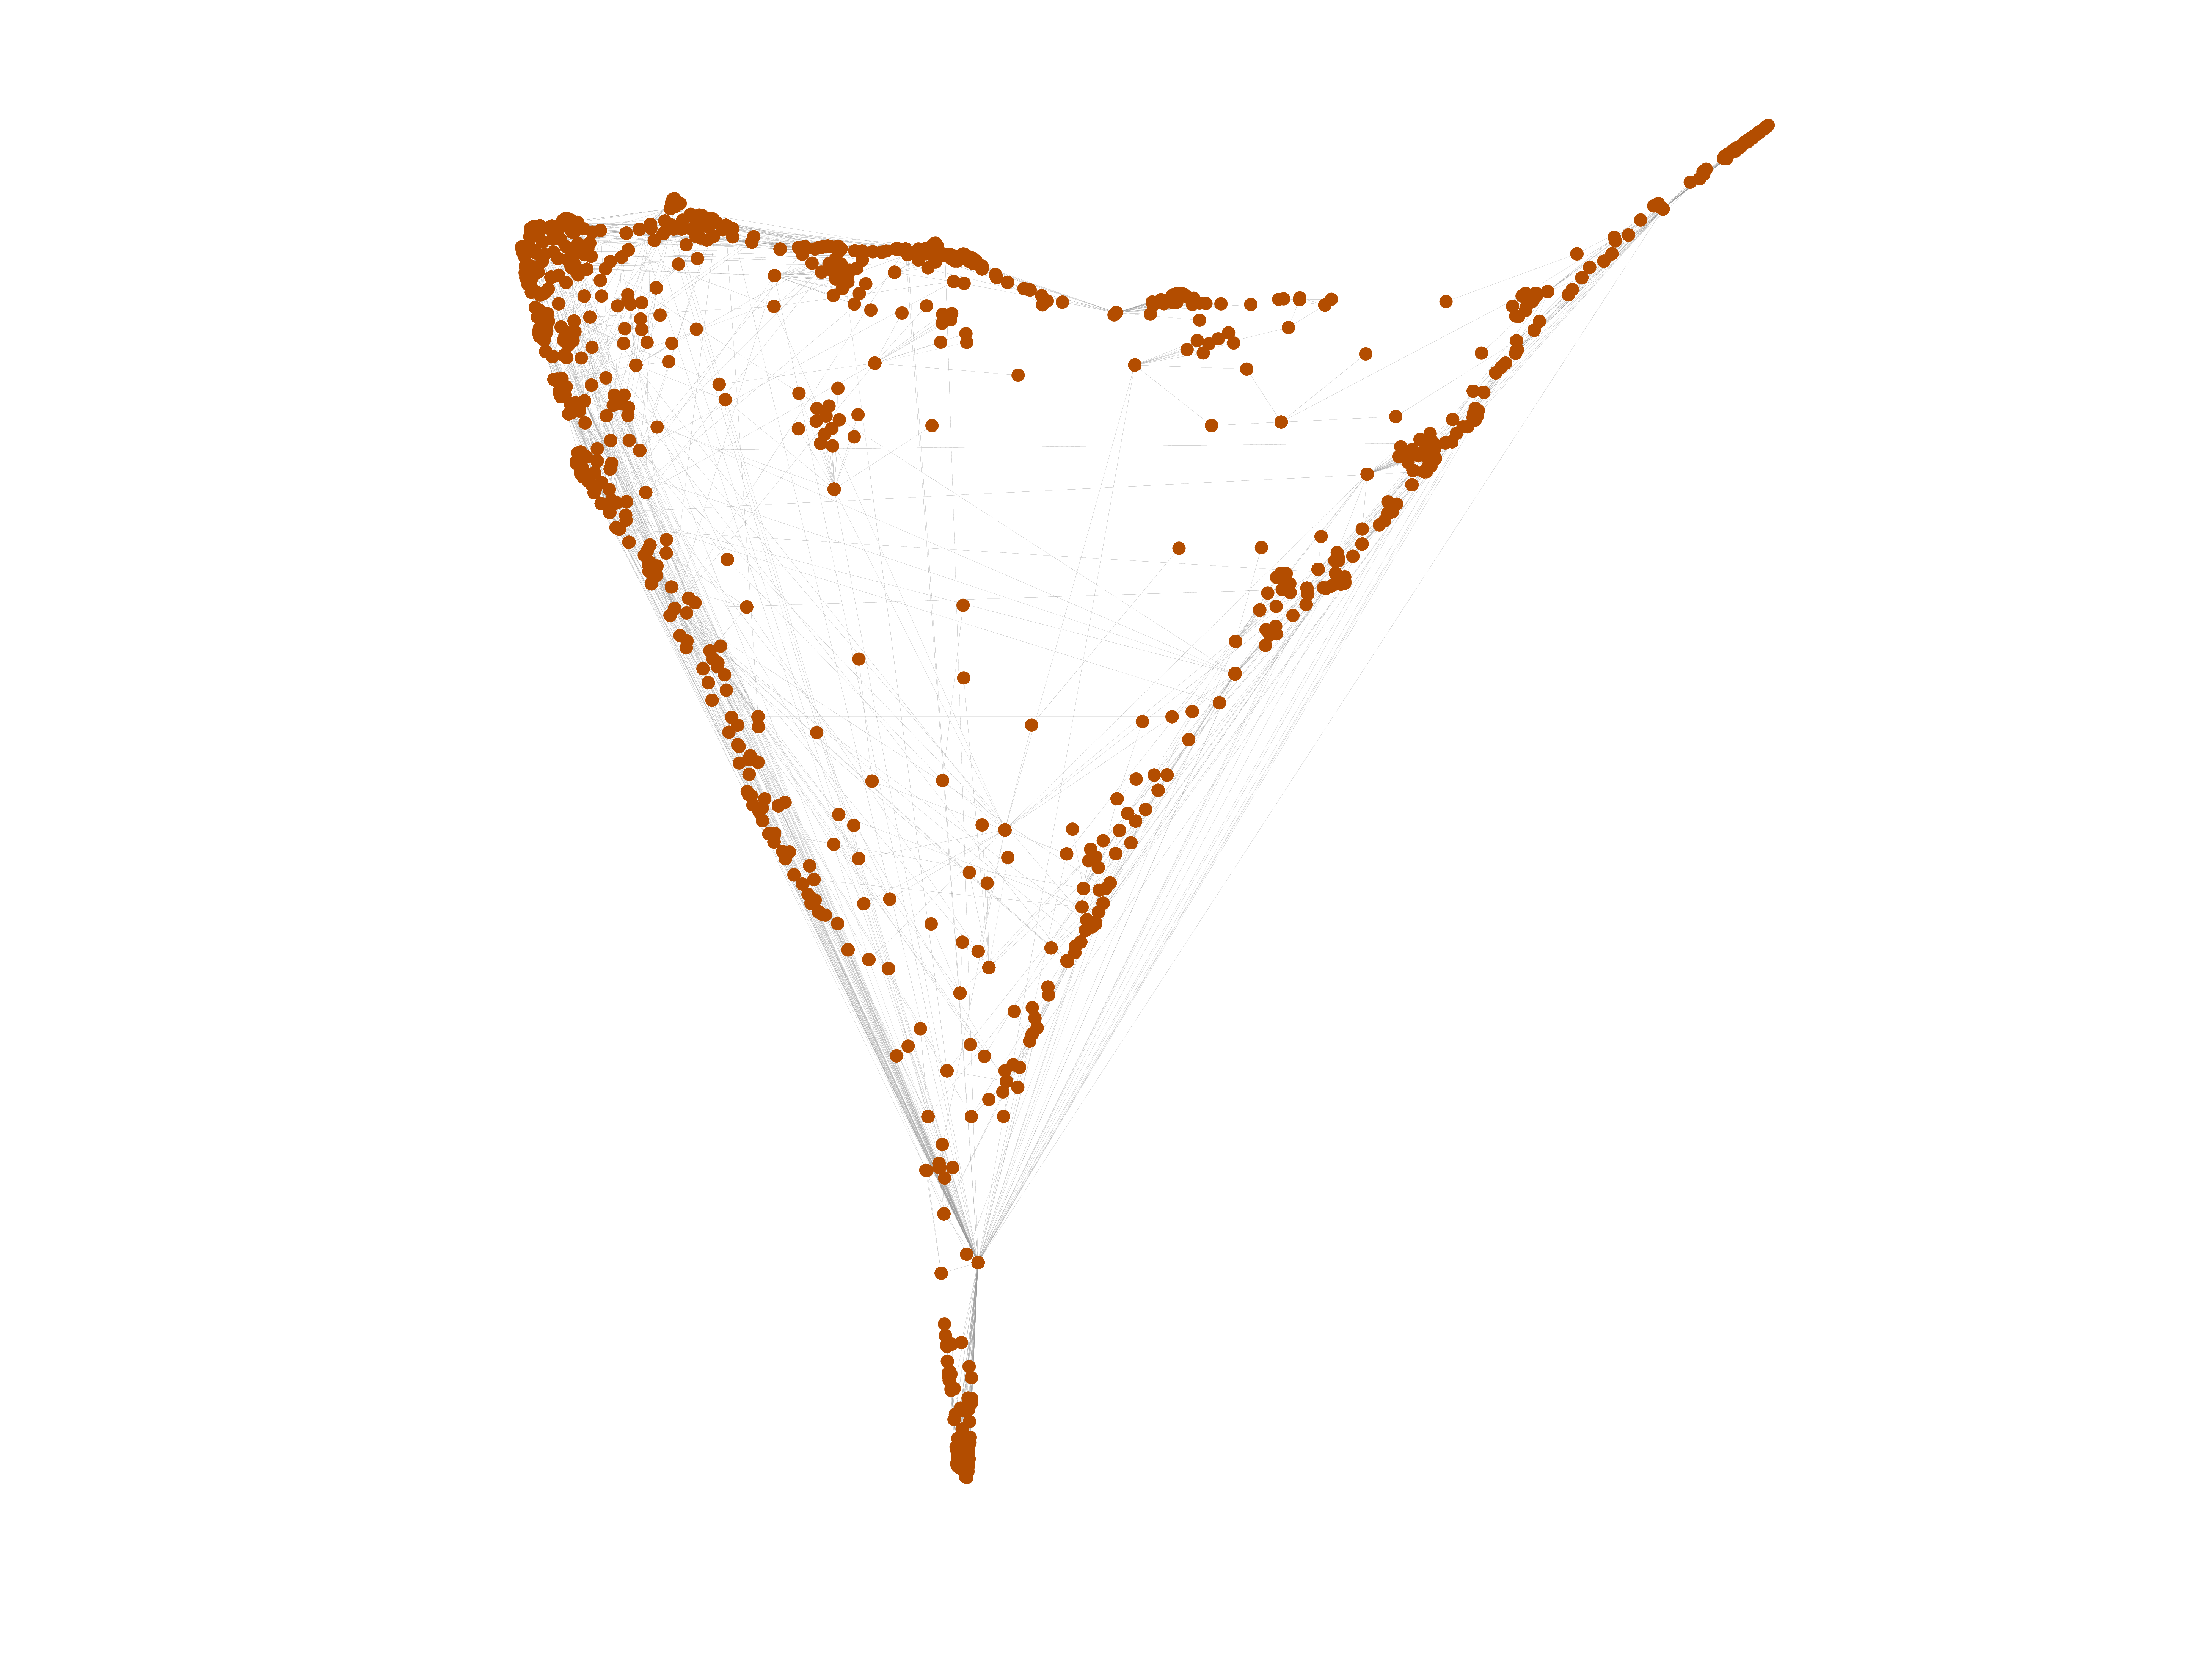
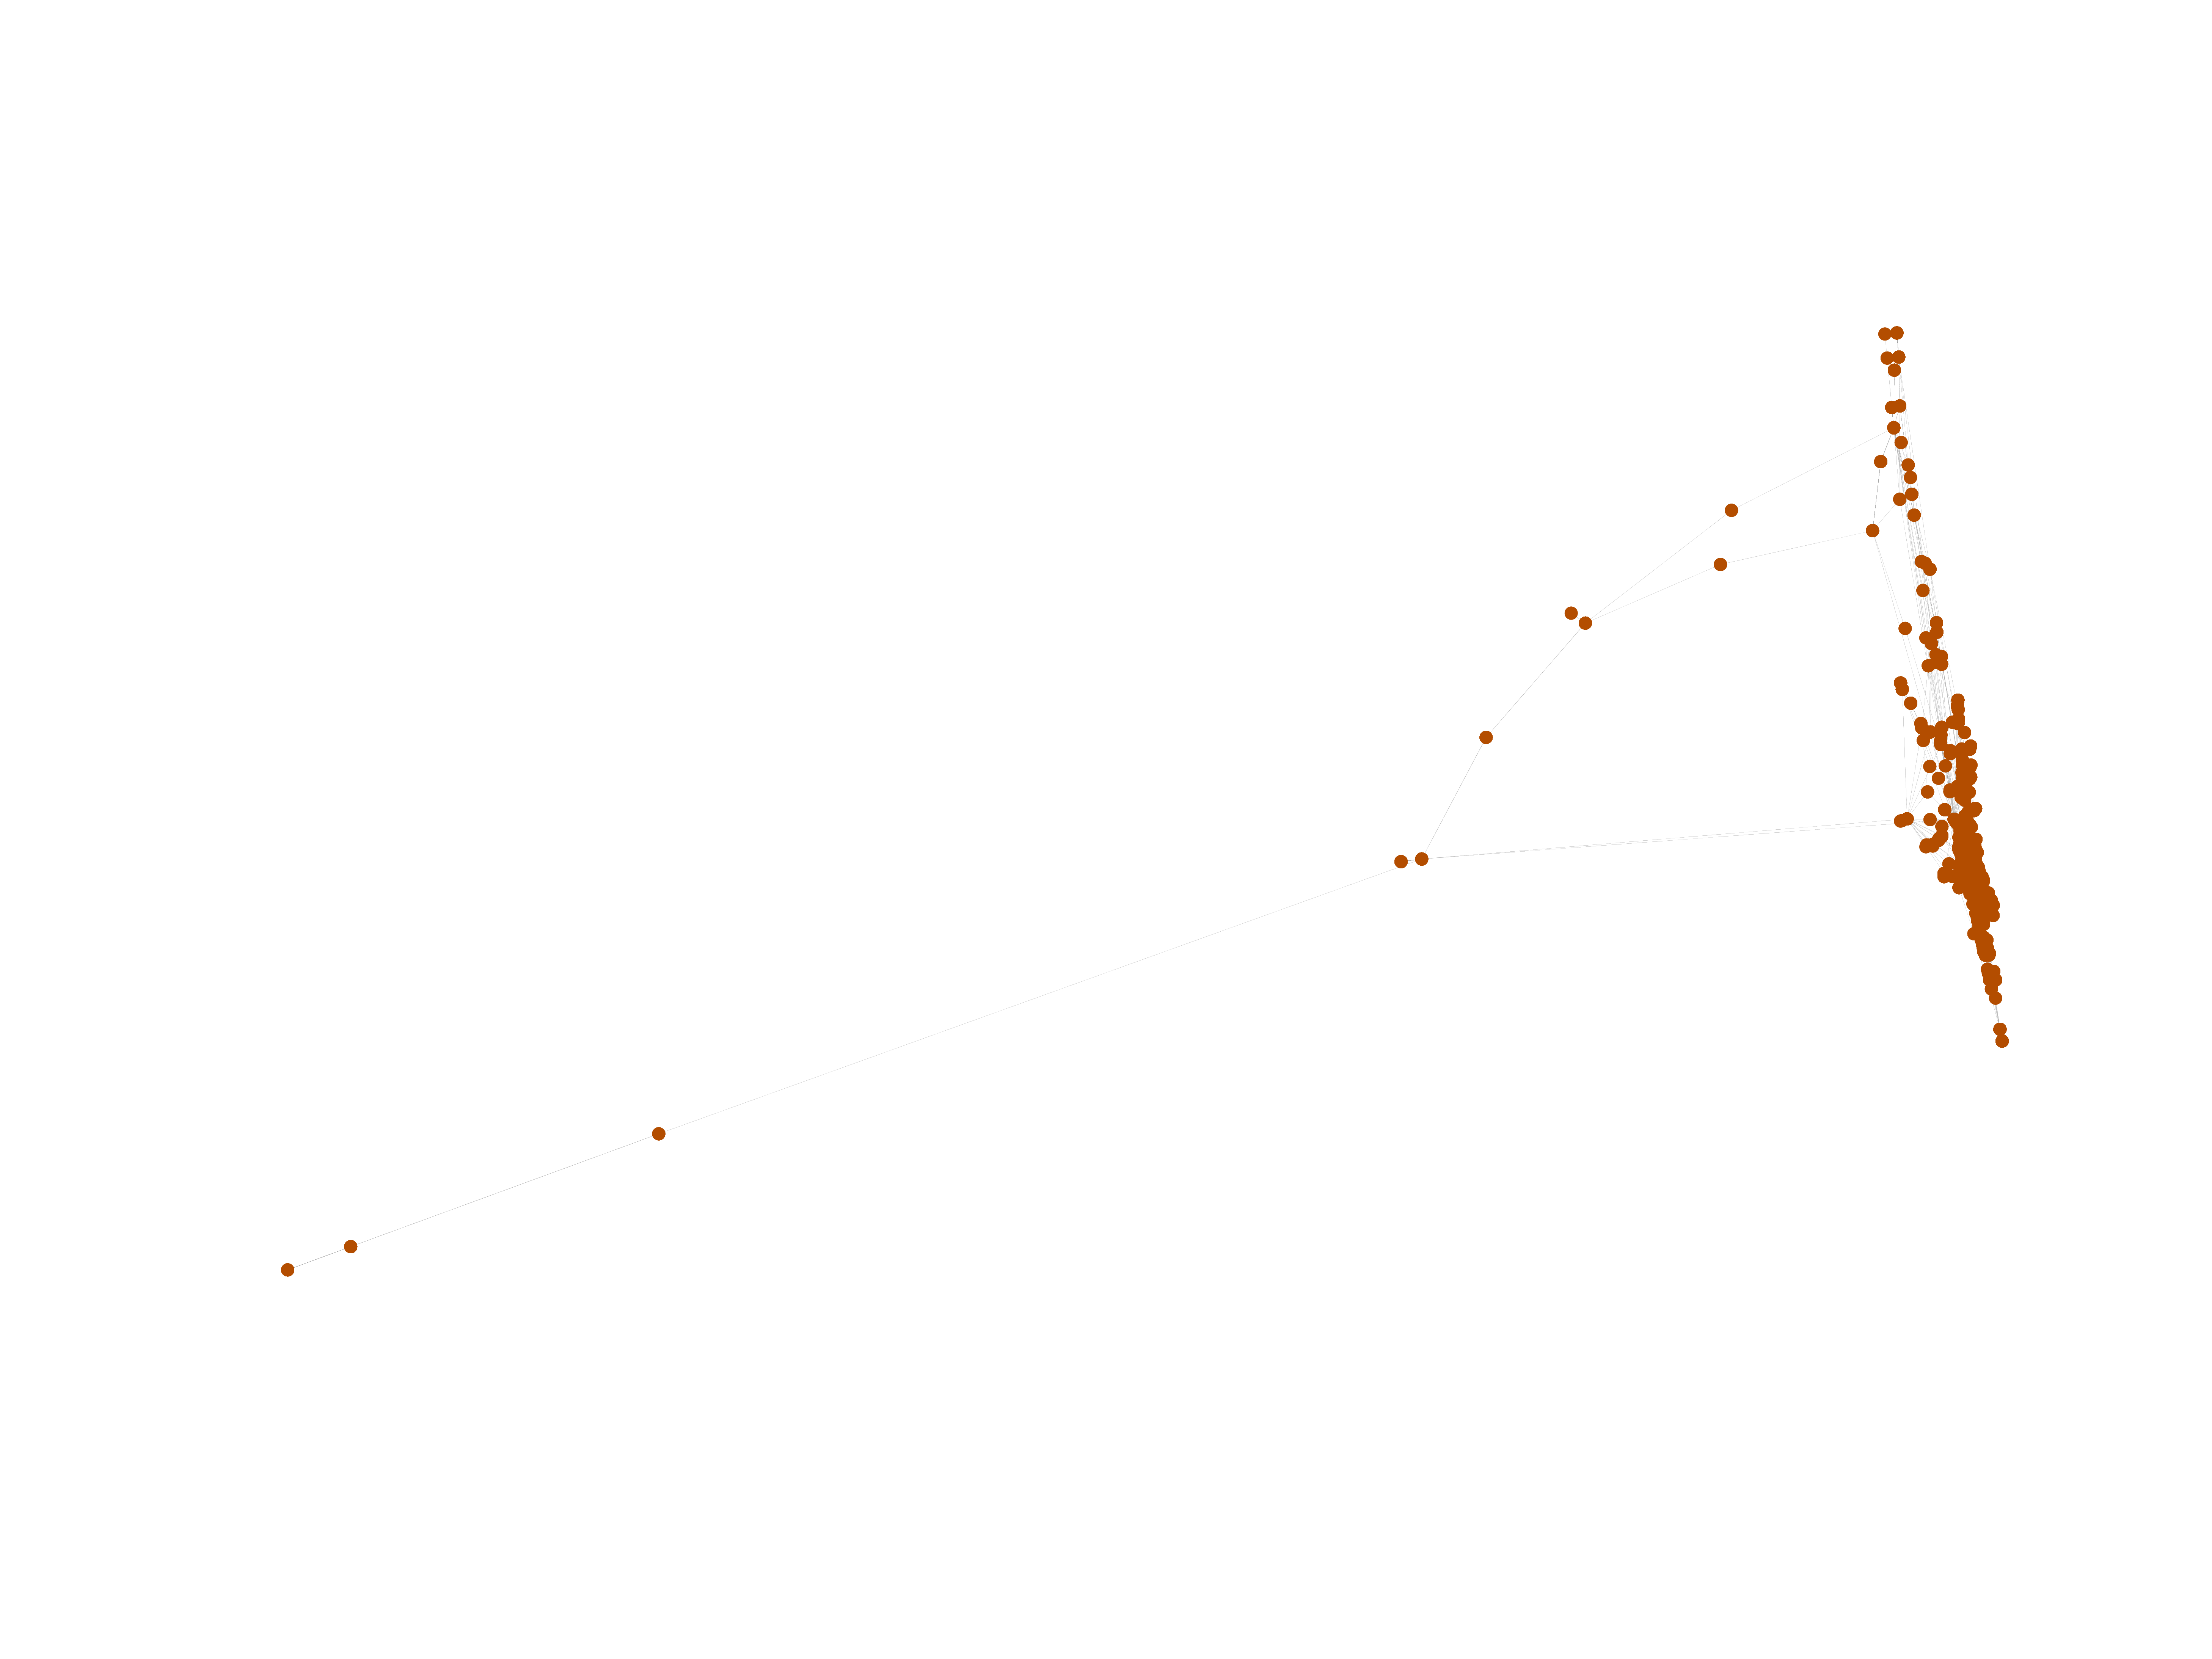
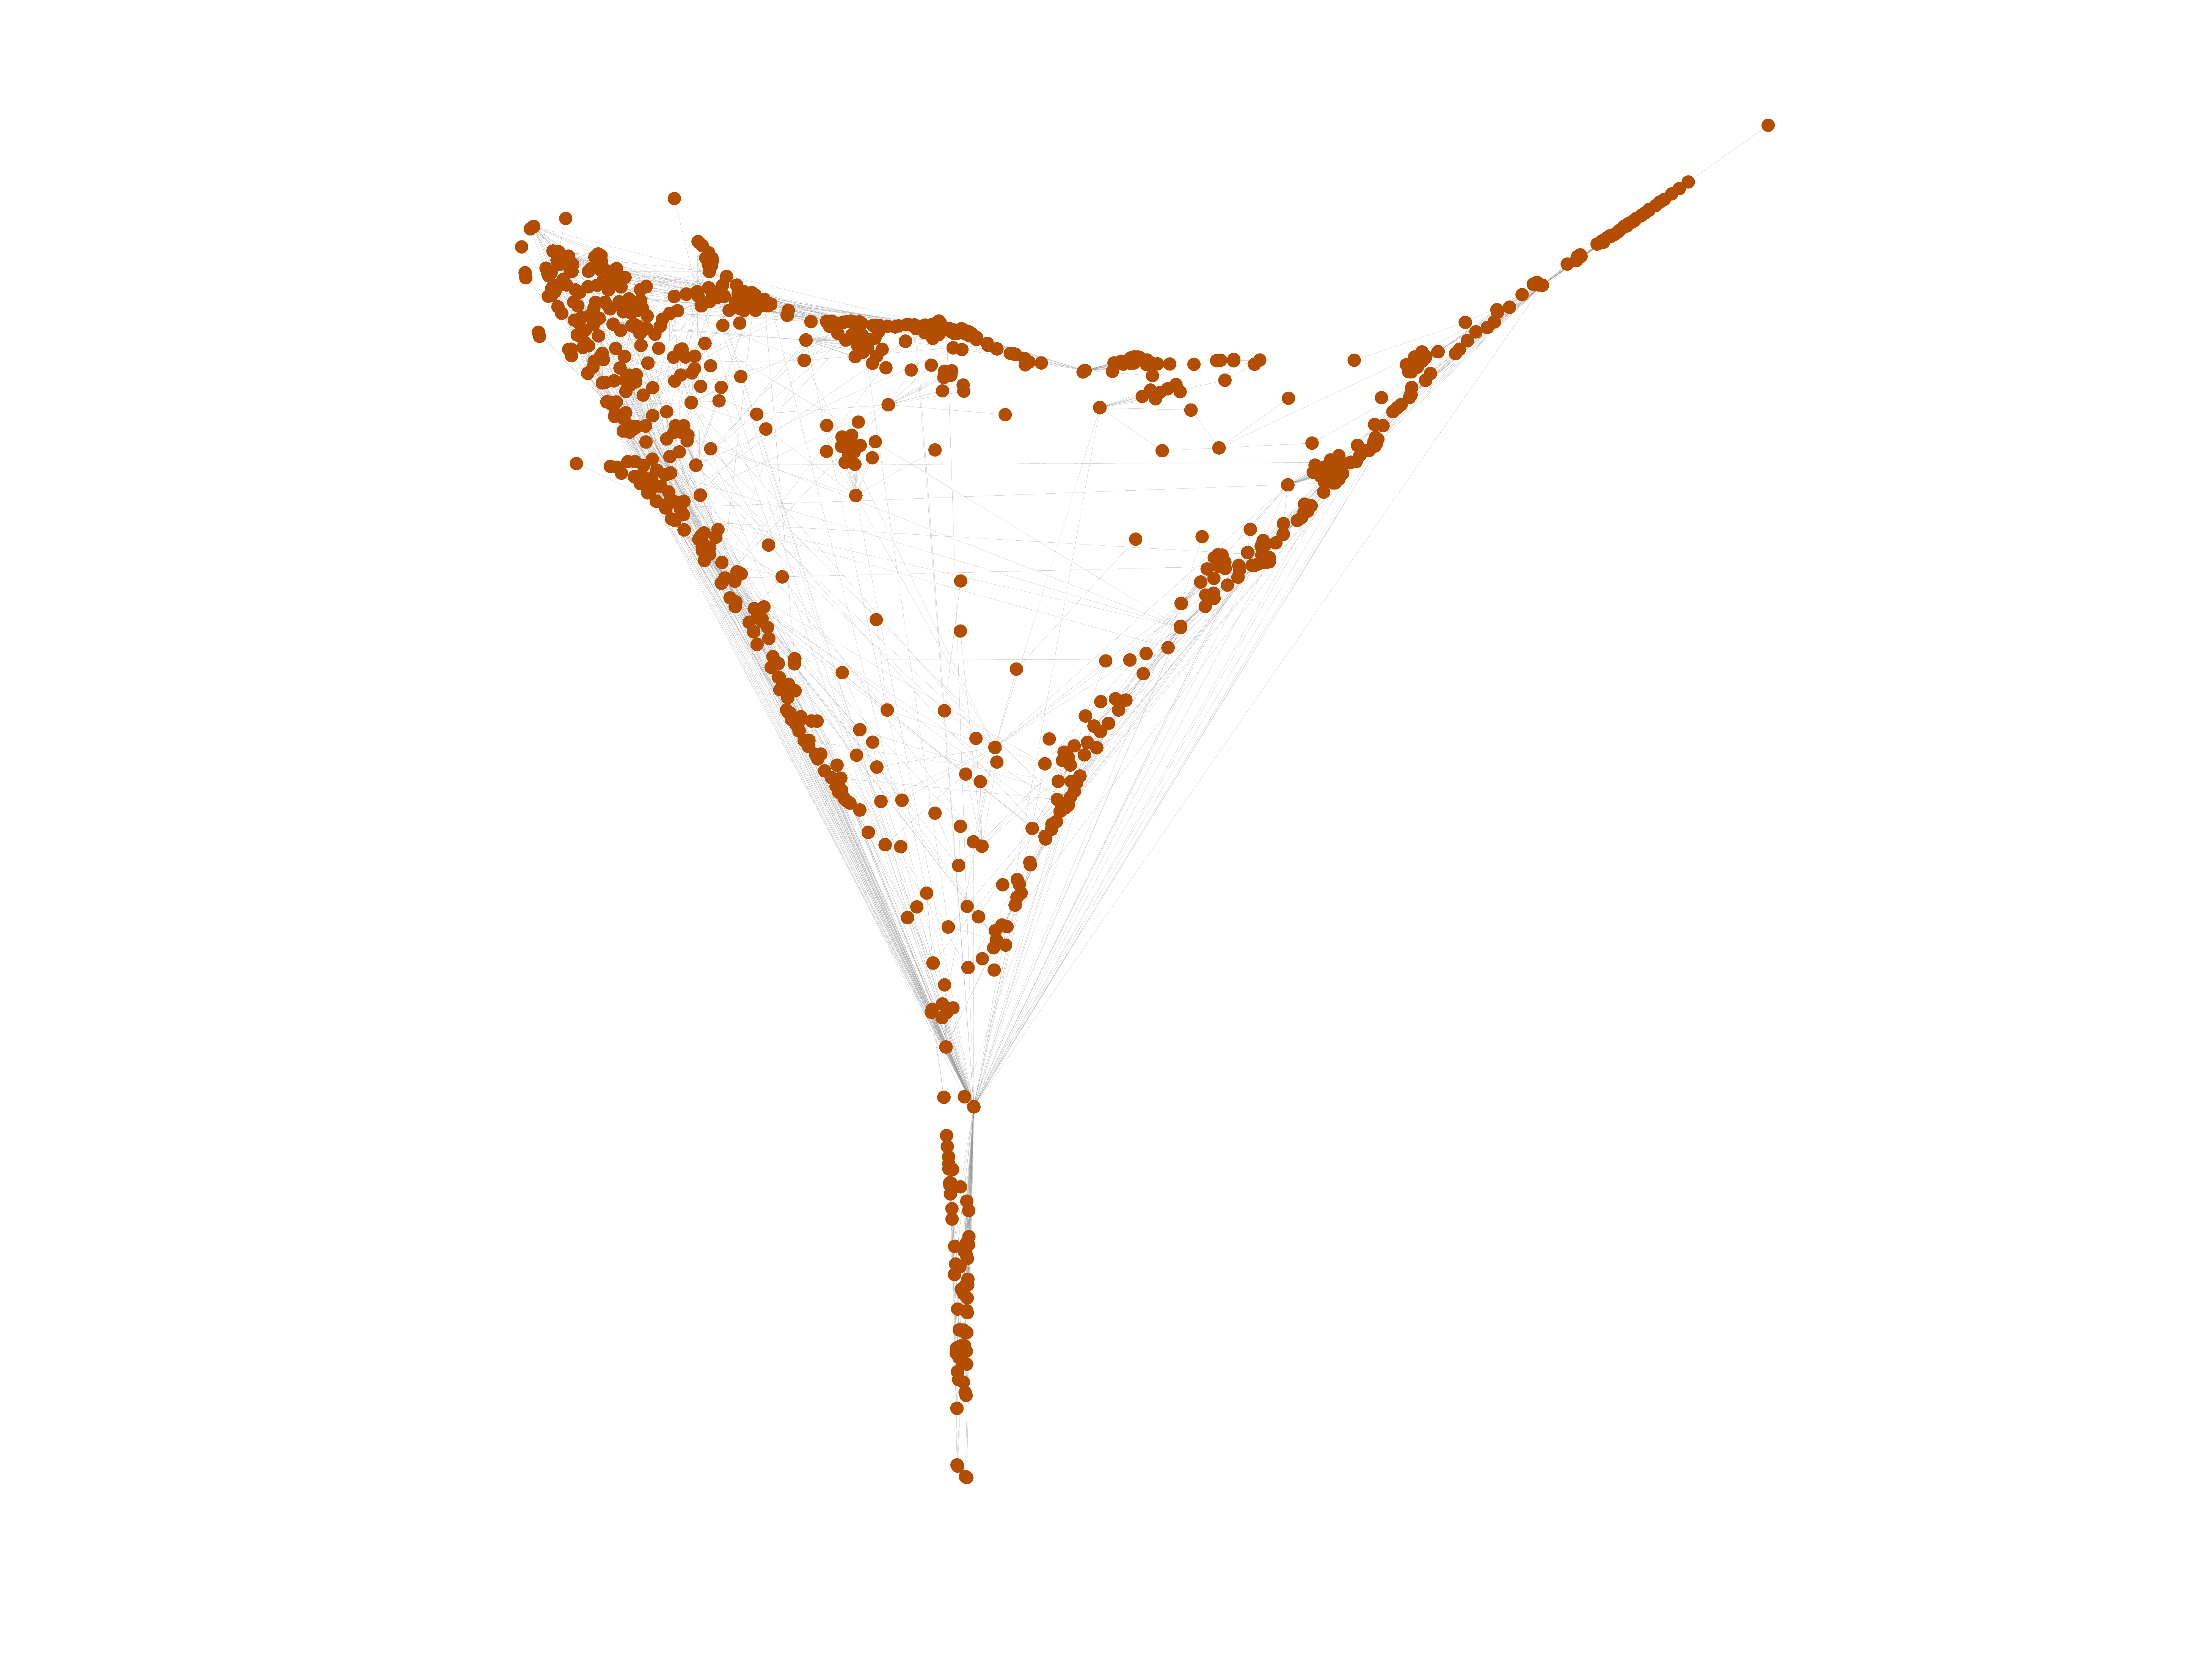
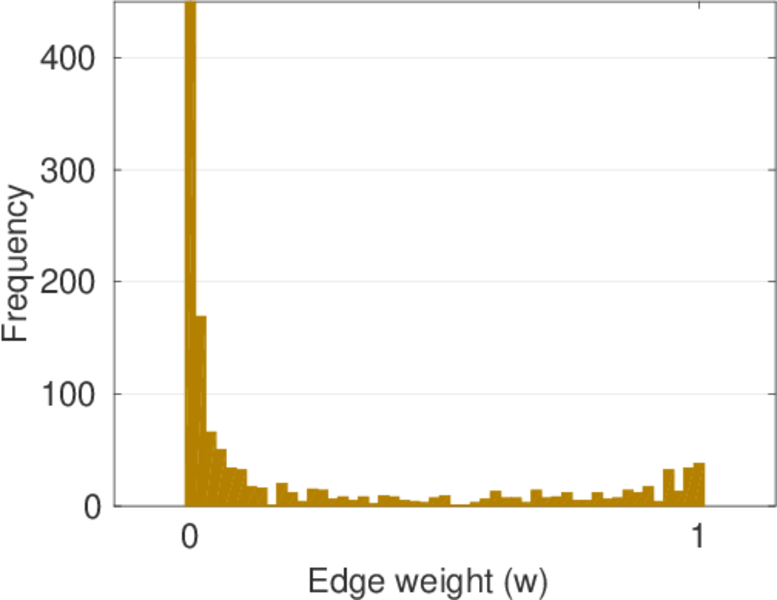
This bipartite network denotes which languages are spoken in which countries. Nodes are countries and languages; edge weights denote the proportion (between zero and one) of the population of a given country speaking a given language. To quote the Unicode data description: "The main goal is to provide approximate figures for the literate, functional population for each language in each territory: that is, the population that is able to read and write each language, and is comfortable enough to use it with computers."

Metadata

CodeUL
Internal nameunicodelang
NameUnicode languages
Data sourcehttp://www.unicode.org/cldr/charts/25/supplemental/territory_language_information.html
AvailabilityDataset is available for download
Consistency checkDataset passed all tests
Category
Feature network
Dataset timestamp 2015
Node meaningCountry, language
Edge meaningHosts
Network formatBipartite, undirected
Edge typePositive weights, no multiple edges
Zero weights Edges may have weight zero

Statistics

Size n =868
Left size n1 =254
Right size n2 =614
Volume m =1,255
Wedge count s =21,977
Claw count z =521,909
Cross count x =15,999,004
Square count q =1,266
4-Tour count T4 =86,712
Maximum degree dmax =141
Maximum left degree d1max =69
Maximum right degree d2max =141
Average degree d =2.891 71
Average left degree d1 =4.940 94
Average right degree d2 =2.043 97
Fill p =0.007 091 74
Size of LCC N =858
Diameter δ =8
50-Percentile effective diameter δ0.5 =3.510 60
90-Percentile effective diameter δ0.9 =5.243 55
Median distance δM =4
Mean distance δm =4.075 74
Gini coefficient G =0.583 143
Balanced inequality ratio P =0.269 439
Left balanced inequality ratio P1 =0.315 552
Right balanced inequality ratio P2 =0.321 881
Relative edge distribution entropy Her =0.889 358
Power law exponent γ =2.865 13
Tail power law exponent γt =2.371 00
Tail power law exponent with p γ3 =2.371 00
p-value p =0.122 000
Left tail power law exponent with p γ3,1 =2.371 00
Left p-value p1 =0.075 000 0
Right tail power law exponent with p γ3,2 =2.521 00
Right p-value p2 =0.007 000 00
Degree assortativity ρ =−0.251 443
Degree assortativity p-value pρ =2.076 20 × 10−17
Spectral norm α =7.934 29
Algebraic connectivity a =0.000 263 914
Spectral separation 1[A] / λ2[A]| =1.862 52
Controllability C =408
Relative controllability Cr =0.521 739

Plots

Fruchterman–Reingold graph drawing

Degree distribution

Cumulative degree distribution

Lorenz curve

Spectral distribution of the adjacency matrix

Spectral distribution of the normalized adjacency matrix

Spectral distribution of the Laplacian

Spectral graph drawing based on the adjacency matrix

Spectral graph drawing based on the Laplacian

Spectral graph drawing based on the normalized adjacency matrix

Degree assortativity

Zipf plot

Hop distribution

Double Laplacian graph drawing

Delaunay graph drawing

Edge weight/multiplicity distribution

Matrix decompositions plots

Downloads

References

[1] Jérôme Kunegis. KONECT – The Koblenz Network Collection. In Proc. Int. Conf. on World Wide Web Companion, pages 1343–1350, 2013. [ http ]