Wikipedia categories (en)
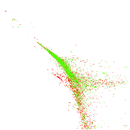
This is the bipartite network of English Wikipedia articles and the categories
they are contained in. Left nodes are articles and right nodes are categories.
Metadata
Statistics
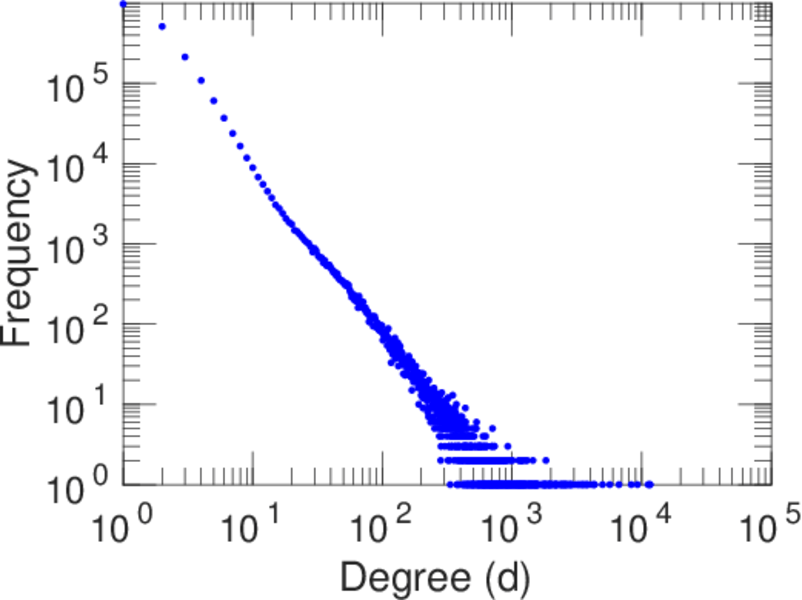
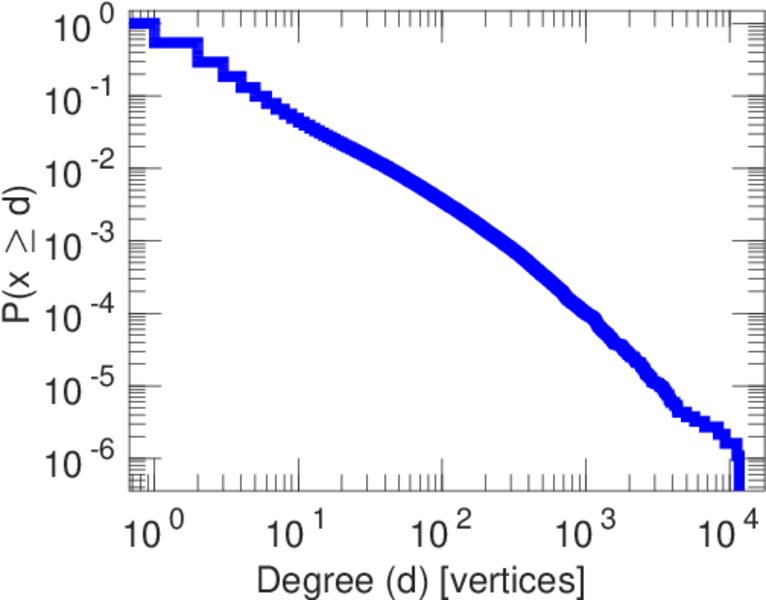
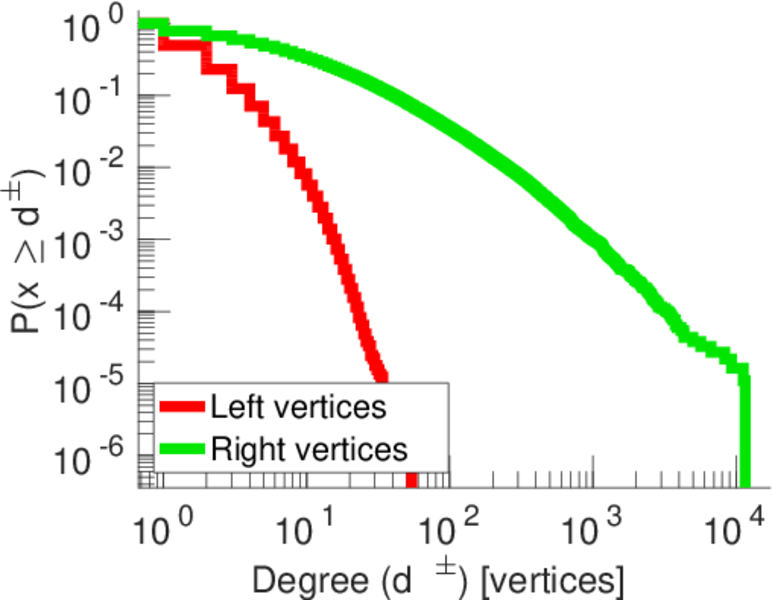
| Size | n = | 2,036,440
|
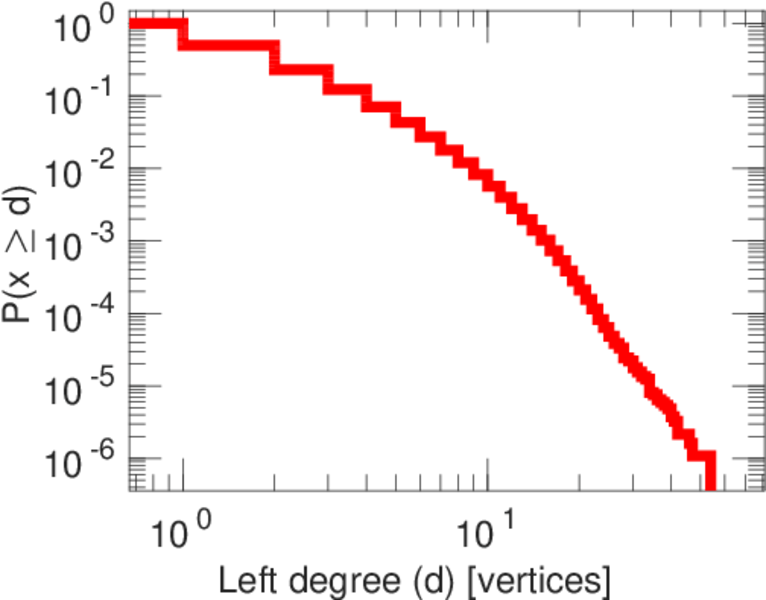
| Left size | n1 = | 1,853,493
|
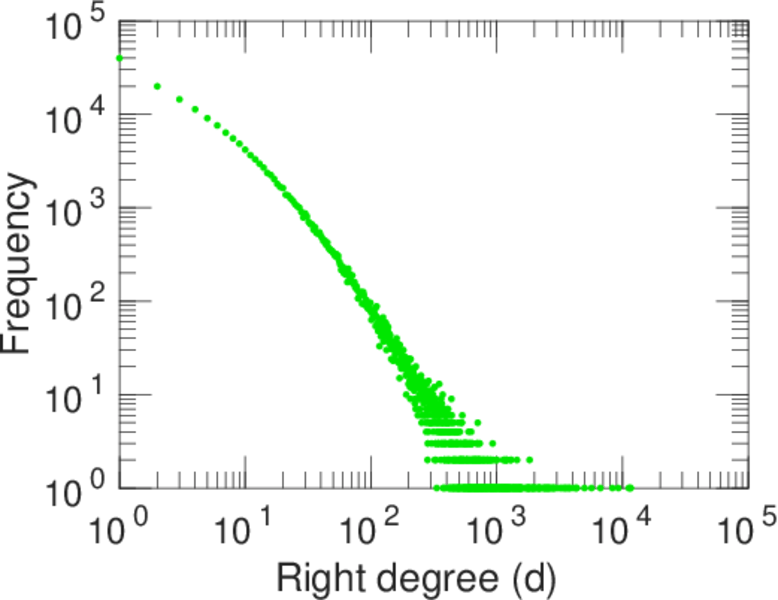
| Right size | n2 = | 182,947
|
| Volume | m = | 3,795,796
|
| Wedge count | s = | 898,164,591
|
| Claw count | z = | 1,363,824,377,144
|
| Cross count | x = | 3,001,843,059,062,188
|
| Square count | q = | 160,976,541
|
| 4-Tour count | T4 = | 4,888,065,352
|
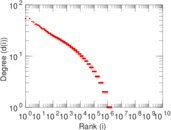
| Maximum degree | dmax = | 11,593
|
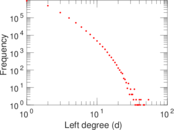
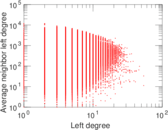
| Maximum left degree | d1max = | 54
|
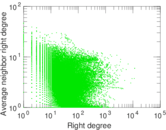
| Maximum right degree | d2max = | 11,593
|
| Average degree | d = | 3.727 87
|
| Average left degree | d1 = | 2.047 91
|
| Average right degree | d2 = | 20.748 1
|
| Fill | p = | 1.119 40 × 10−5
|
| Size of LCC | N = | 1,893,657
|
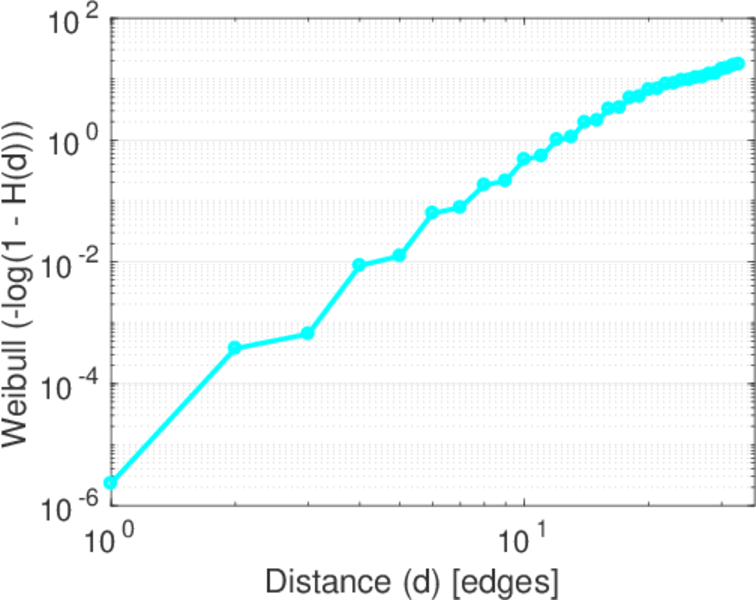
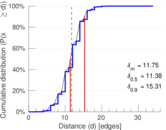
| Diameter | δ = | 46
|
| 50-Percentile effective diameter | δ0.5 = | 11.377 1
|
| 90-Percentile effective diameter | δ0.9 = | 15.307 2
|
| Median distance | δM = | 12
|
| Mean distance | δm = | 11.750 1
|
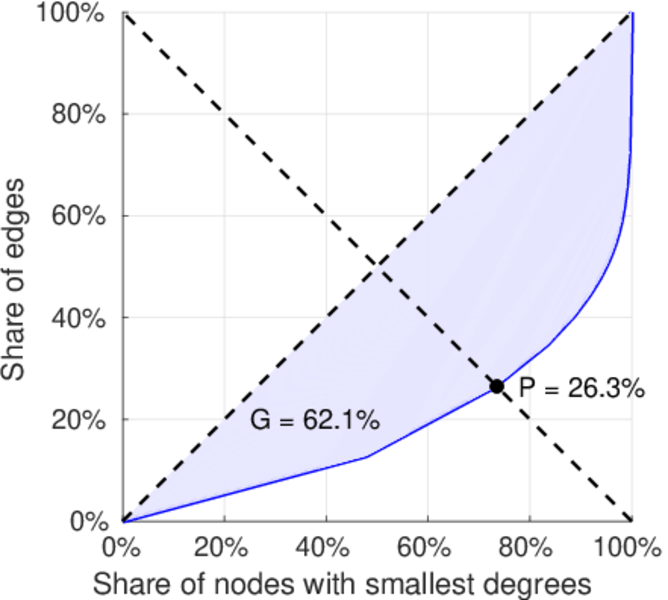
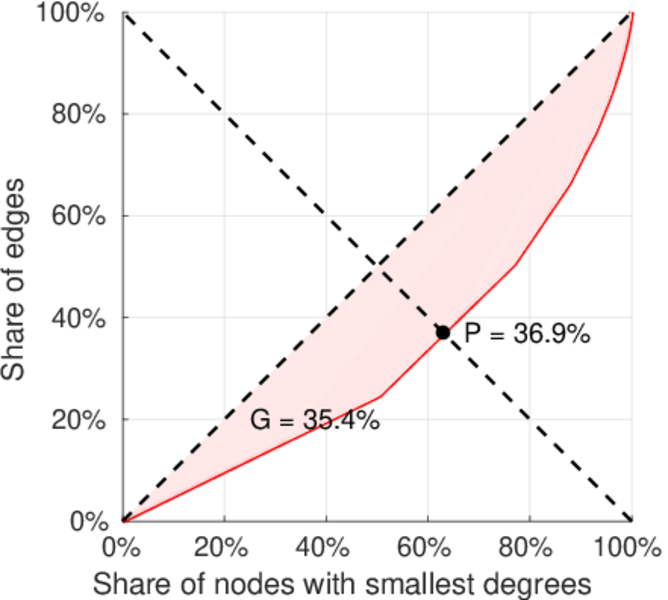
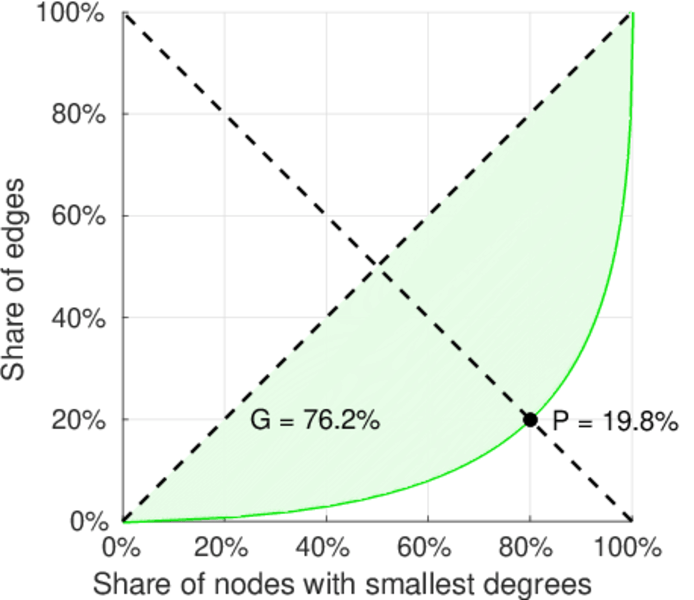
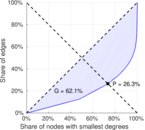
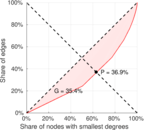
| Gini coefficient | G = | 0.640 075
|
| Balanced inequality ratio | P = | 0.257 484
|
| Left balanced inequality ratio | P1 = | 0.368 946
|
| Right balanced inequality ratio | P2 = | 0.197 671
|
| Relative edge distribution entropy | Her = | 0.902 290
|
| Power law exponent | γ = | 2.614 68
|
| Tail power law exponent | γt = | 2.381 00
|
| Tail power law exponent with p | γ3 = | 2.381 00
|
| p-value | p = | 0.000 00
|
| Left tail power law exponent with p | γ3,1 = | 7.071 00
|
| Left p-value | p1 = | 0.435 000
|
| Right tail power law exponent with p | γ3,2 = | 2.261 00
|
| Right p-value | p2 = | 0.000 00
|
| Degree assortativity | ρ = | +0.093 530 5
|
| Degree assortativity p-value | pρ = | 0.000 00
|
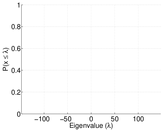
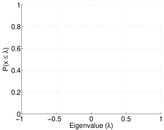
| Spectral norm | α = | 147.912
|
| Algebraic connectivity | a = | 0.000 224 266
|
| Spectral separation | |λ1[A] / λ2[A]| = | 1.095 29
|
| Controllability | C = | 1,677,460
|
| Relative controllability | Cr = | 0.823 722
|
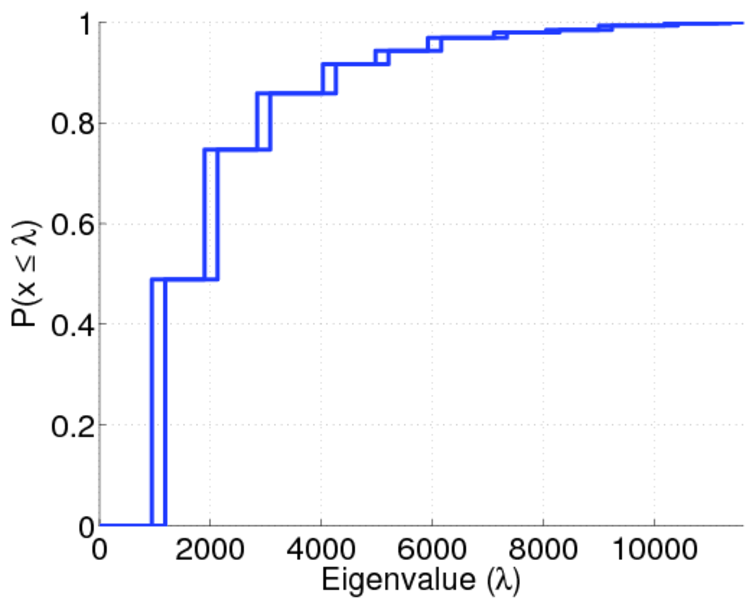
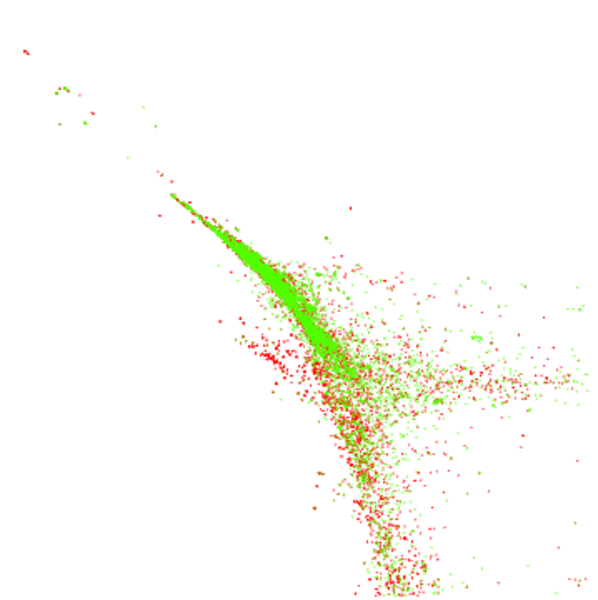
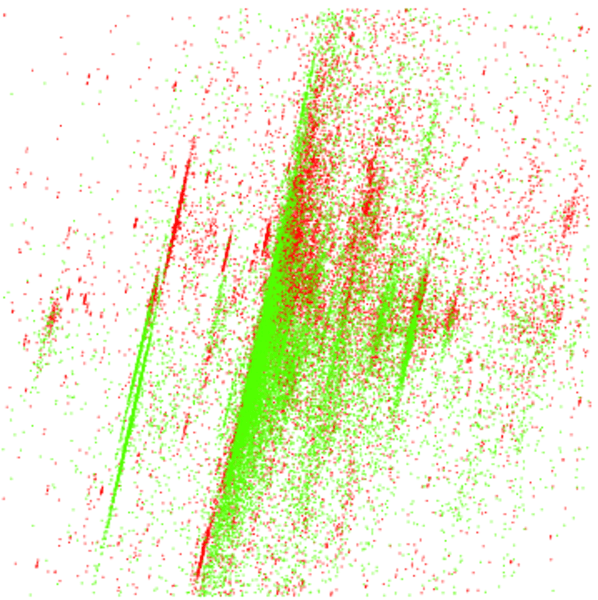
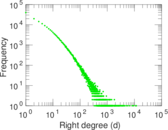
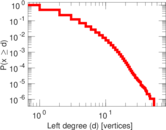
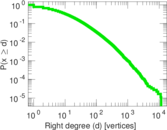
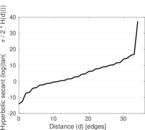
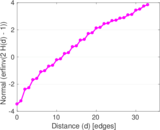
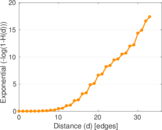
Plots


Downloads
References
|
[1]
|
Jérôme Kunegis.
KONECT – The Koblenz Network Collection.
In Proc. Int. Conf. on World Wide Web Companion, pages
1343–1350, 2013.
[ http ]
|
|
[2]
|
Wikimedia Foundation.
Wikimedia downloads.
http://dumps.wikimedia.org/, January 2010.
|
 KONECT ‣ Networks ‣
Buy Me a Coffee
KONECT ‣ Networks ‣
Buy Me a Coffee