YouTube
This is the social network of YouTube users and their friendship connections.
Metadata
Statistics
| Size | n = | 3,223,589
|
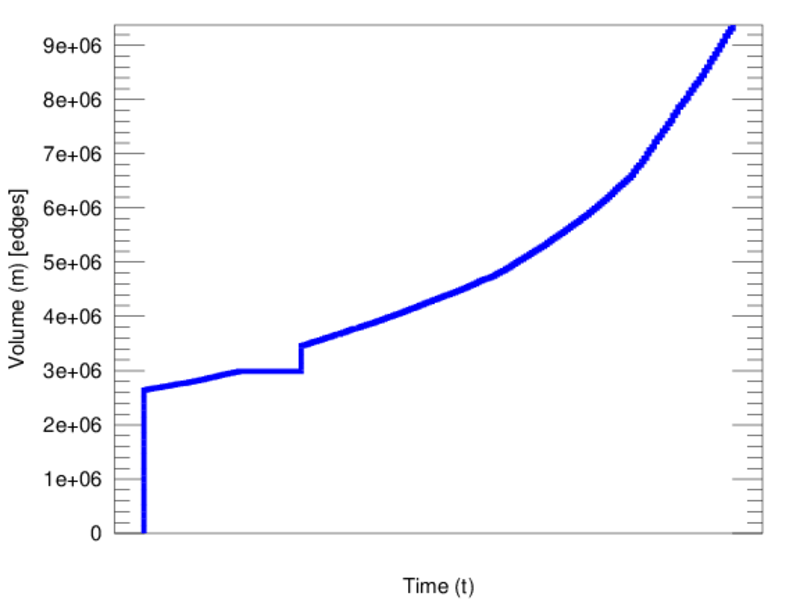
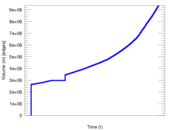
| Volume | m = | 9,375,374
|
| Loop count | l = | 0
|
| Wedge count | s = | 26,535,309,102
|
| Claw count | z = | 409,390,882,186,801
|
| Cross count | x = | 6,774,196,341,151,129,600
|
| Triangle count | t = | 12,226,580
|
| Square count | q = | 9,890,851,109
|
| 4-Tour count | T4 = | 185,286,796,028
|
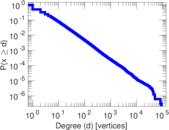
| Maximum degree | dmax = | 91,751
|
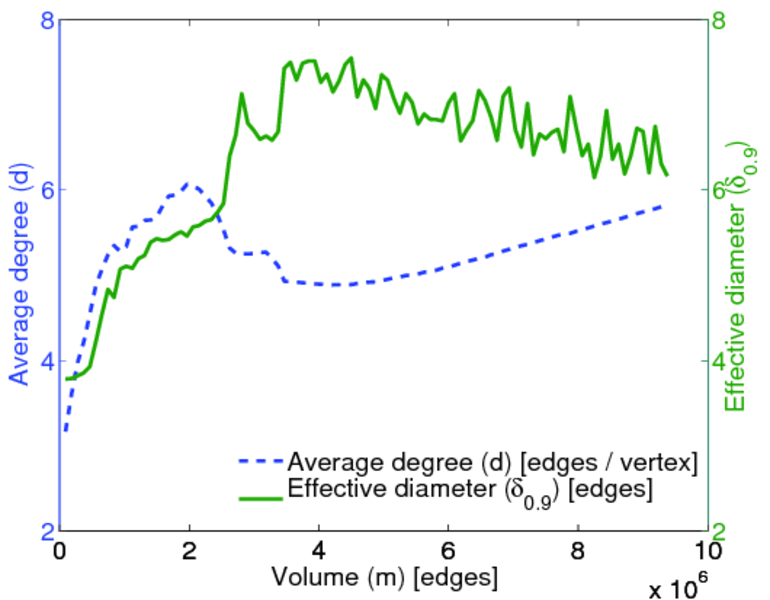
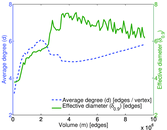
| Average degree | d = | 5.816 73
|
| Fill | p = | 1.804 43 × 10−6
|
| Size of LCC | N = | 3,216,075
|
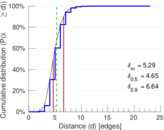
| Diameter | δ = | 31
|
| 50-Percentile effective diameter | δ0.5 = | 4.652 66
|
| 90-Percentile effective diameter | δ0.9 = | 6.643 30
|
| Median distance | δM = | 5
|
| Mean distance | δm = | 5.291 29
|
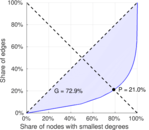
| Gini coefficient | G = | 0.728 959
|
| Balanced inequality ratio | P = | 0.210 291
|
| Relative edge distribution entropy | Her = | 0.859 534
|
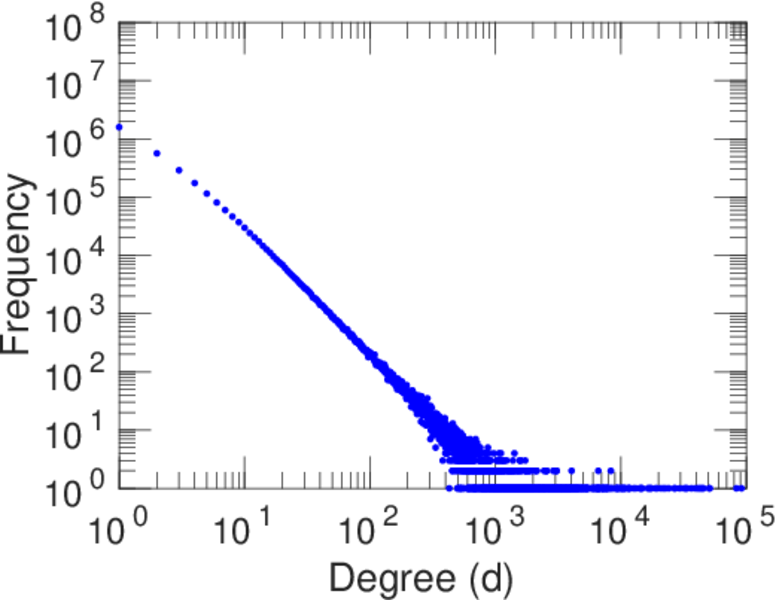
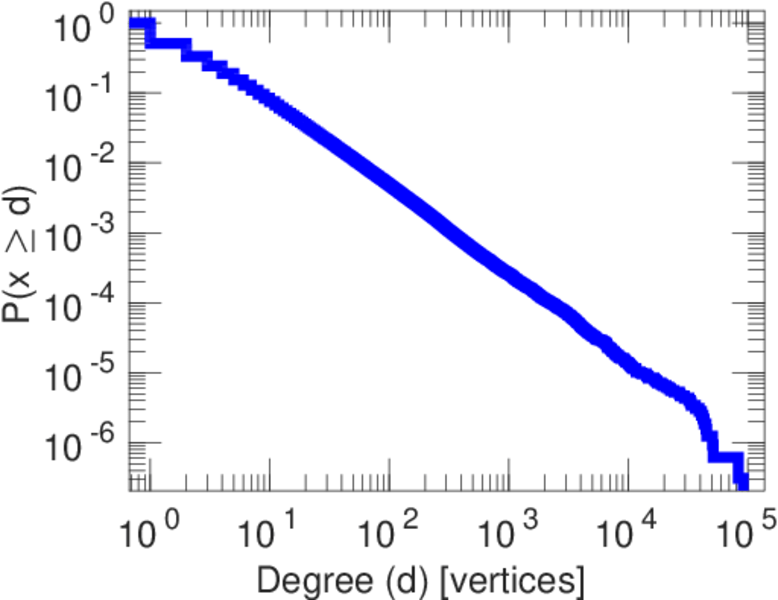
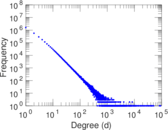
| Power law exponent | γ = | 2.337 95
|
| Tail power law exponent | γt = | 2.211 00
|
| Degree assortativity | ρ = | −0.063 163 4
|
| Degree assortativity p-value | pρ = | 0.000 00
|
| Clustering coefficient | c = | 0.001 382 30
|
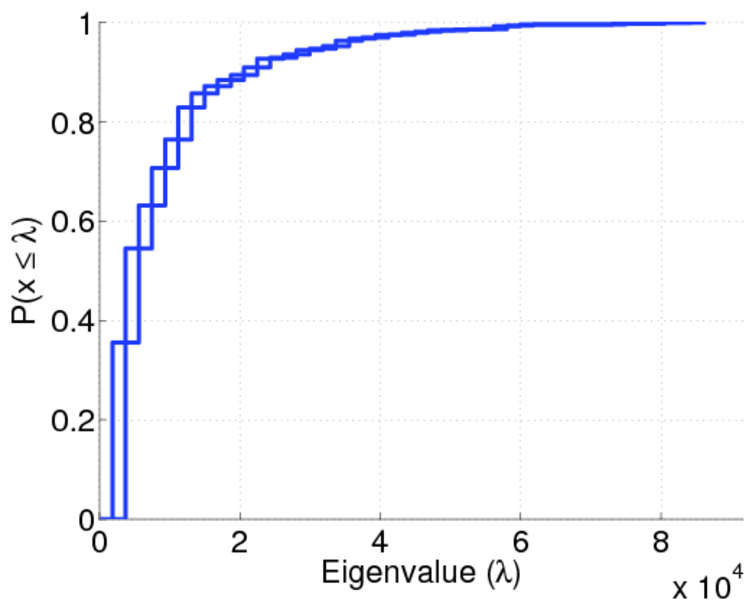
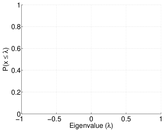
| Spectral norm | α = | 464.866
|
| Spectral separation | |λ1[A] / λ2[A]| = | 1.089 43
|
| Non-bipartivity | bA = | 0.082 089 1
|
| Normalized non-bipartivity | bN = | 0.001 666 96
|
| Controllability | C = | 1,570,131
|
| Relative controllability | Cr = | 0.487 076
|
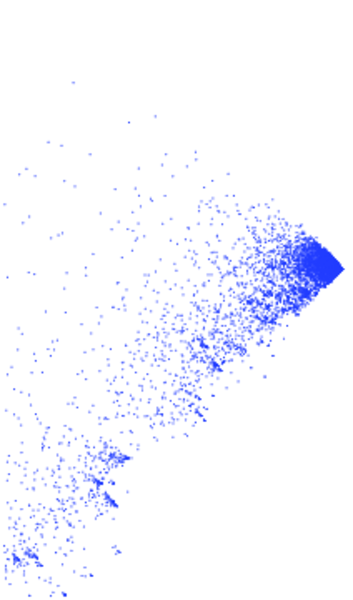
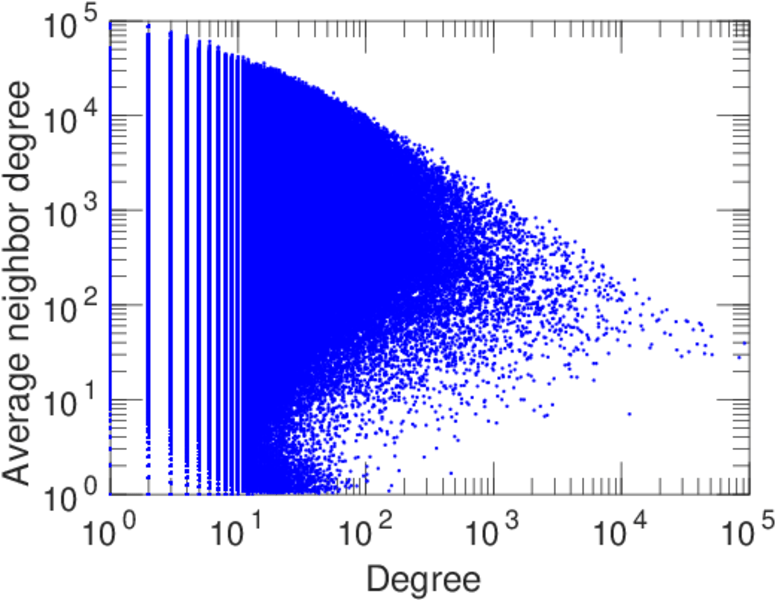
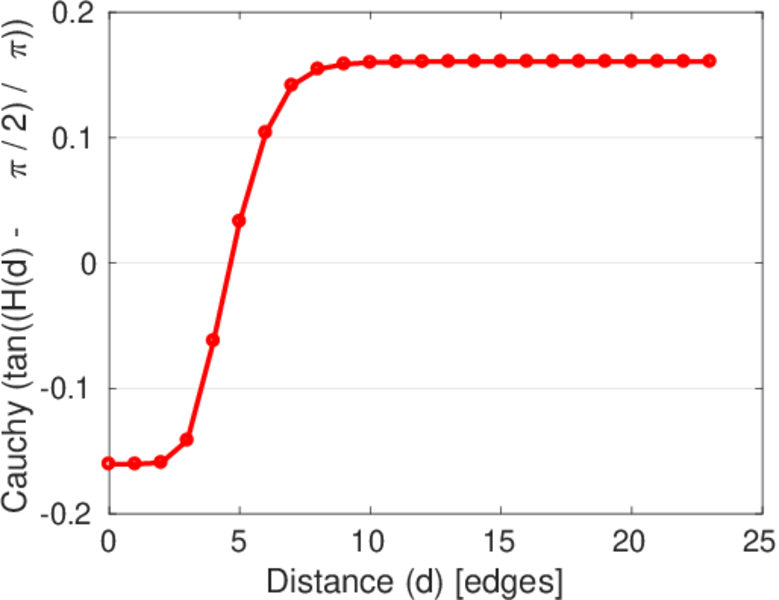
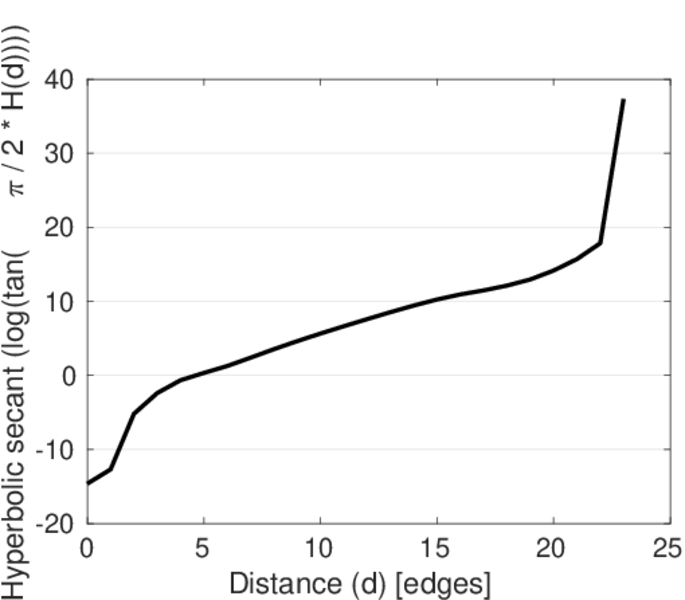
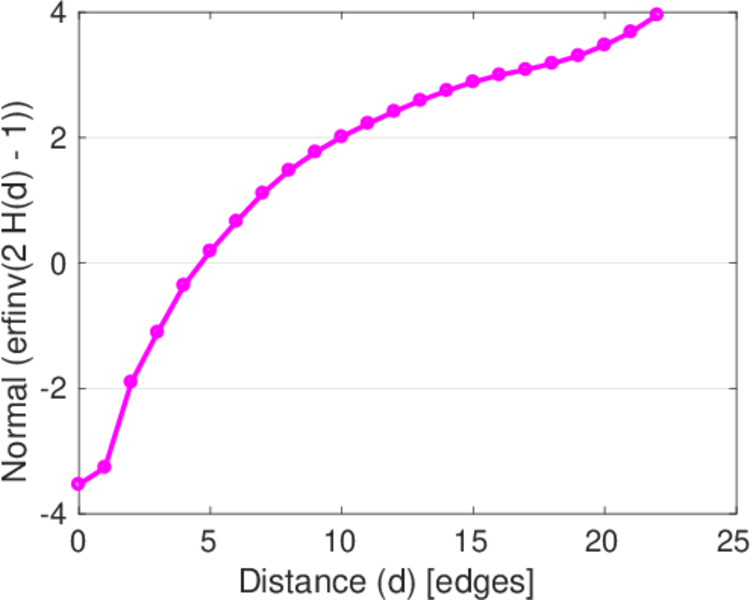
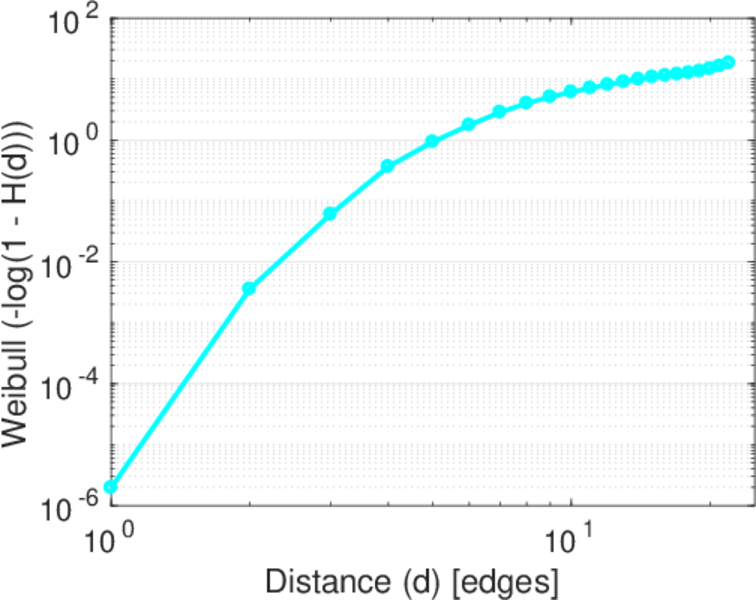
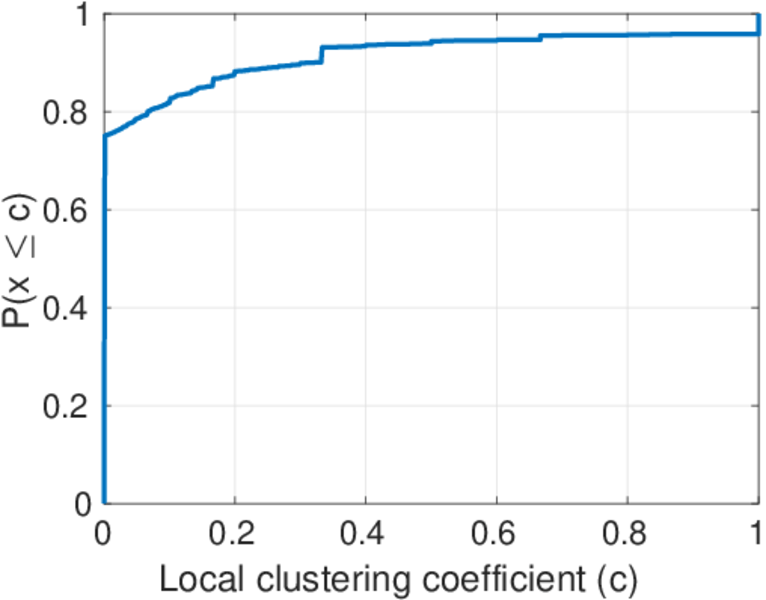
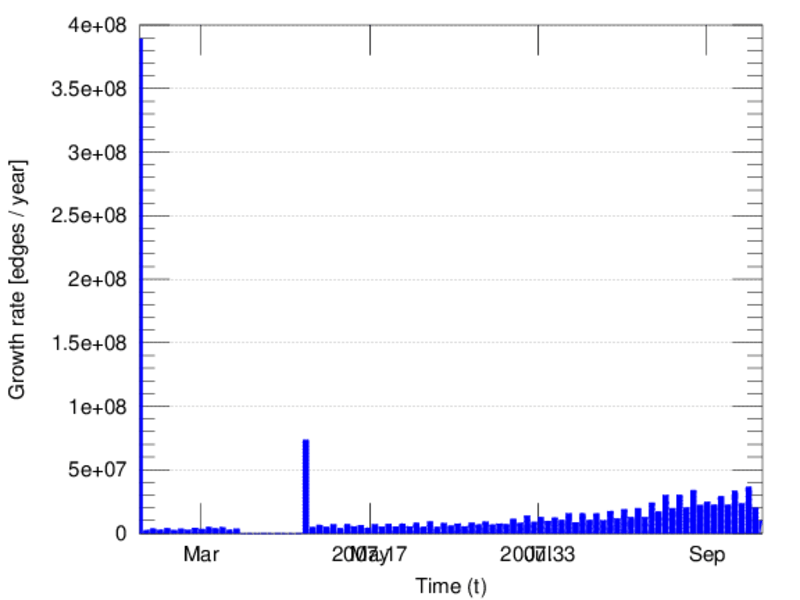
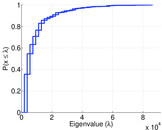
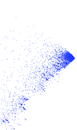
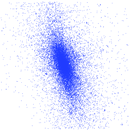
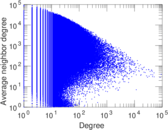
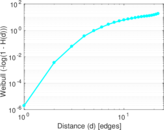
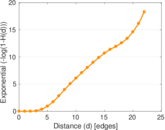
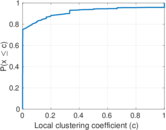
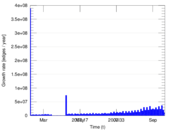
Plots


Downloads
References
|
[1]
|
Jérôme Kunegis.
KONECT – The Koblenz Network Collection.
In Proc. Int. Conf. on World Wide Web Companion, pages
1343–1350, 2013.
[ http ]
|
|
[2]
|
Alan Mislove.
Online Social Networks: Measurement, Analysis, and Applications
to Distributed Information Systems.
PhD thesis, Rice Univ., 2009.
|
 KONECT ‣ Networks ‣
Buy Me a Coffee
KONECT ‣ Networks ‣
Buy Me a Coffee