Amazon ratings
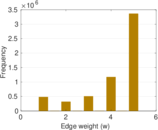
This bipartite network contains product ratings from the Amazon online shopping
website. The rating scale ranges from 1 to 5, where 5 denotes the most positive
rating. Nodes represent users and products, and edges represent individual
ratings.
Metadata
Statistics
| Size | n = | 3,376,972
|
| Left size | n1 = | 2,146,057
|
| Right size | n2 = | 1,230,915
|
| Volume | m = | 5,838,041
|
| Unique edge count | m̿ = | 5,743,258
|
| Wedge count | s = | 627,186,651
|
| Claw count | z = | 704,564,362,291
|
| Cross count | x = | 1,684,620,121,457,183
|
| Square count | q = | 35,849,304
|
| 4-Tour count | T4 = | 2,807,043,116
|
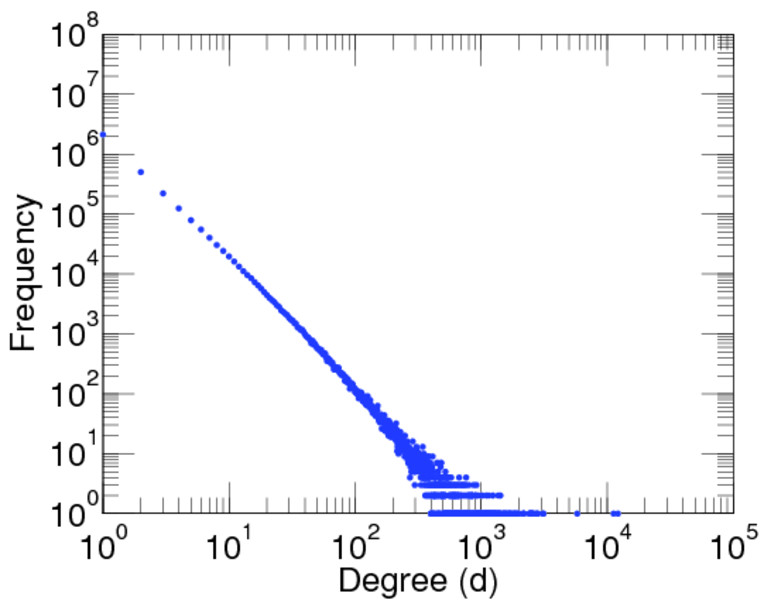
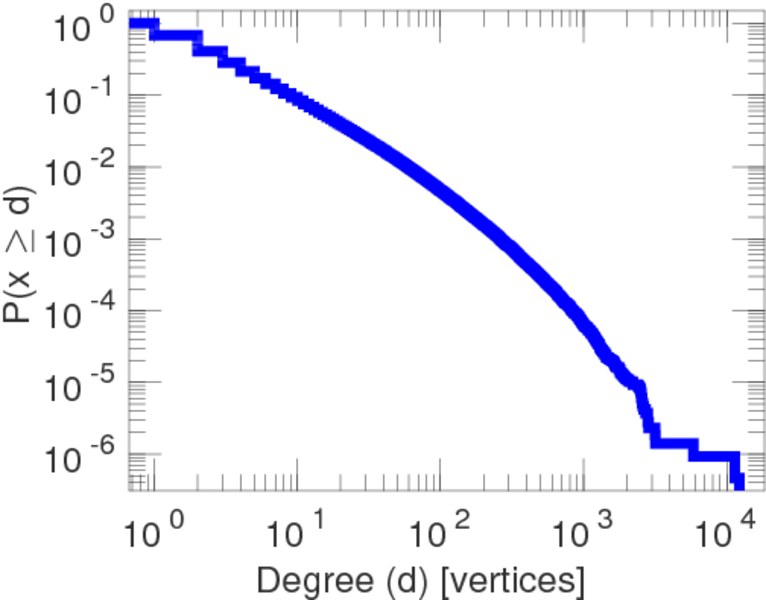
| Maximum degree | dmax = | 12,217
|
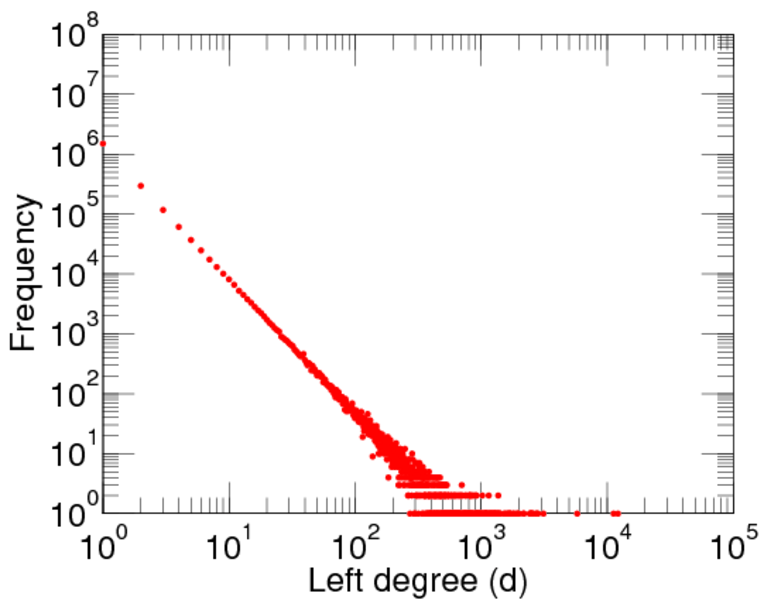
| Maximum left degree | d1max = | 12,217
|
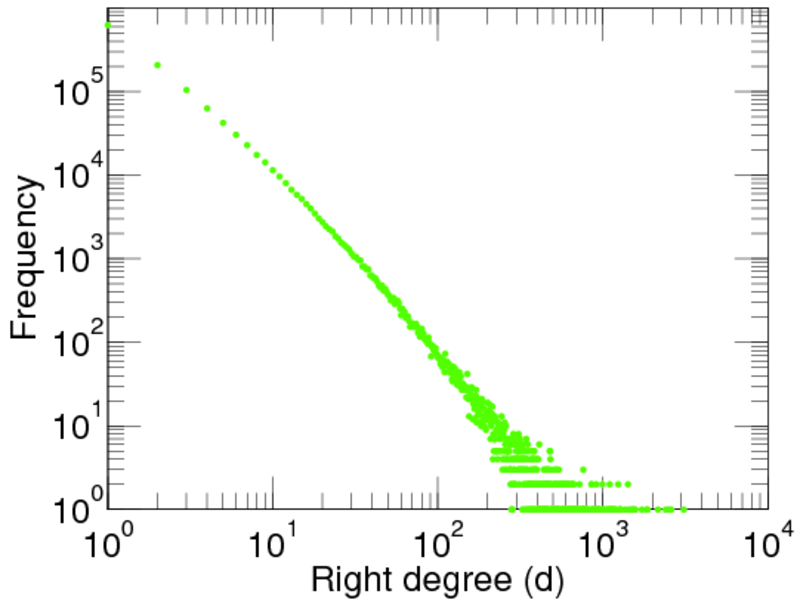
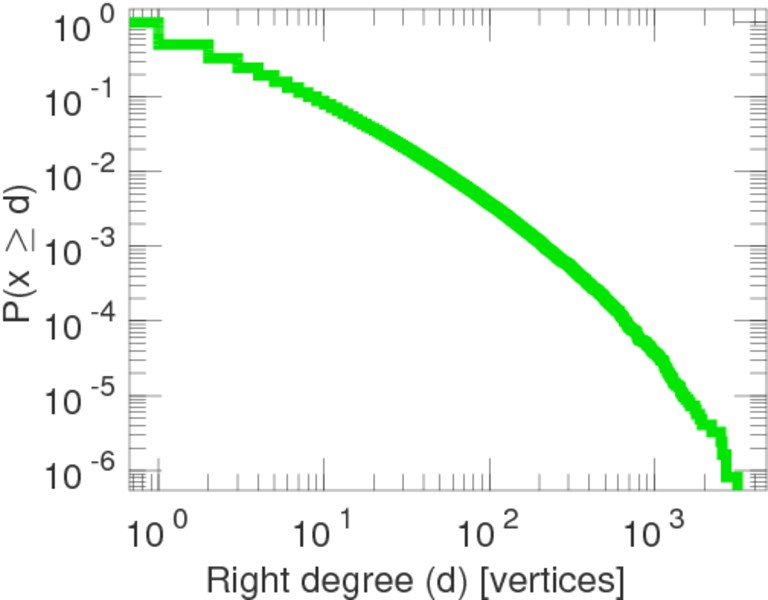
| Maximum right degree | d2max = | 3,146
|
| Average degree | d = | 3.457 56
|
| Average left degree | d1 = | 2.720 36
|
| Average right degree | d2 = | 4.742 85
|
| Fill | p = | 2.174 15 × 10−6
|
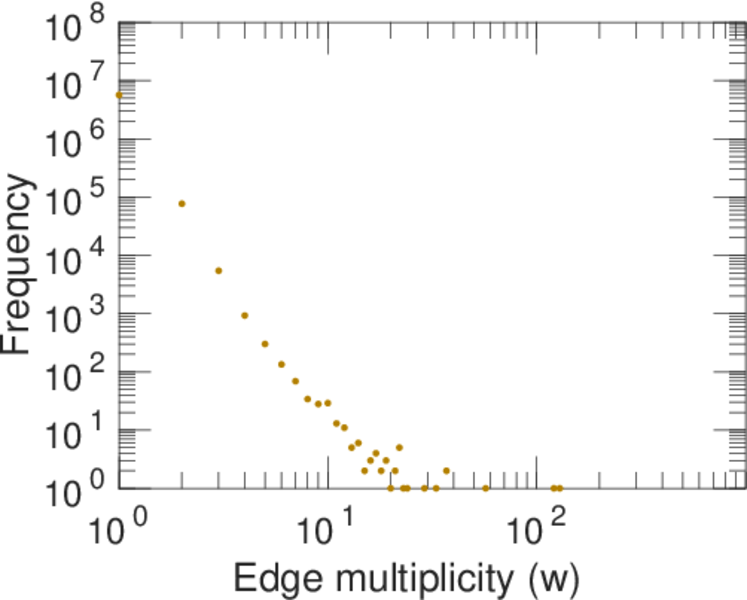
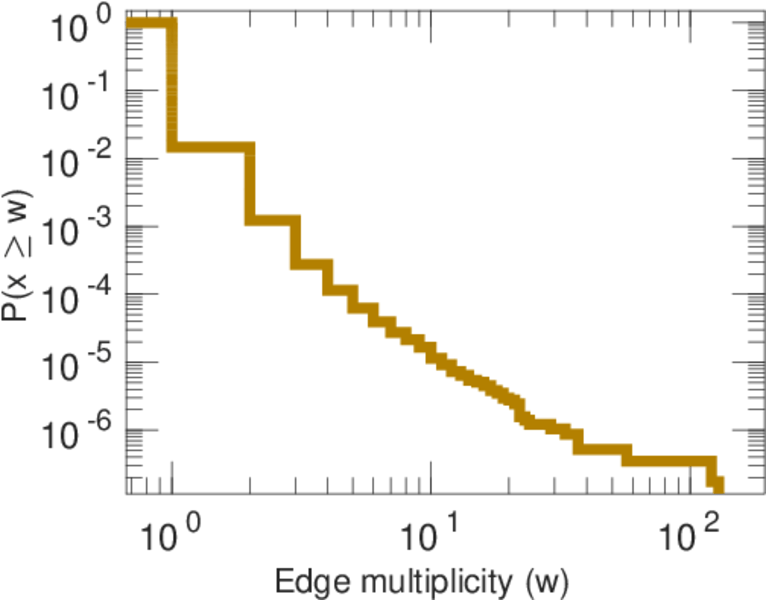
| Average edge multiplicity | m̃ = | 1.016 50
|
| Size of LCC | N = | 2,892,456
|
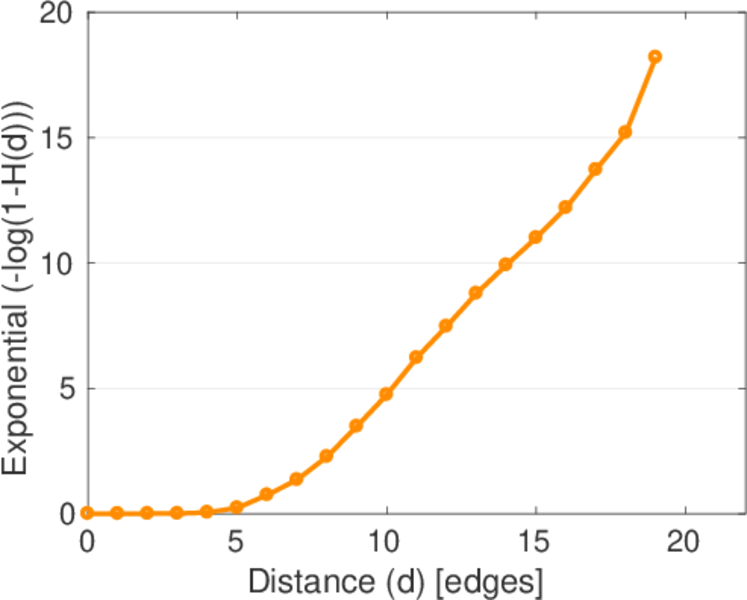
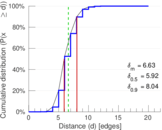
| Diameter | δ = | 28
|
| 50-Percentile effective diameter | δ0.5 = | 5.924 44
|
| 90-Percentile effective diameter | δ0.9 = | 8.044 95
|
| Median distance | δM = | 6
|
| Mean distance | δm = | 6.629 27
|
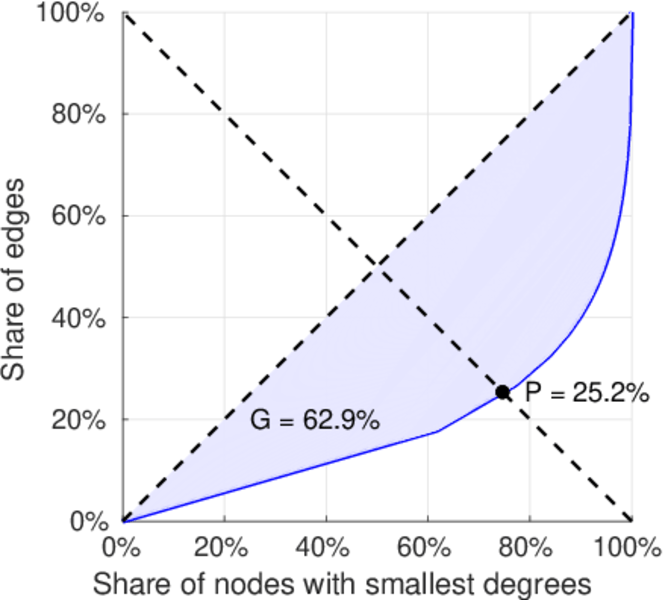
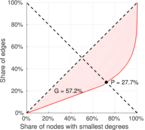
| Gini coefficient | G = | 0.650 684
|
| Balanced inequality ratio | P = | 0.248 637
|
| Left balanced inequality ratio | P1 = | 0.276 822
|
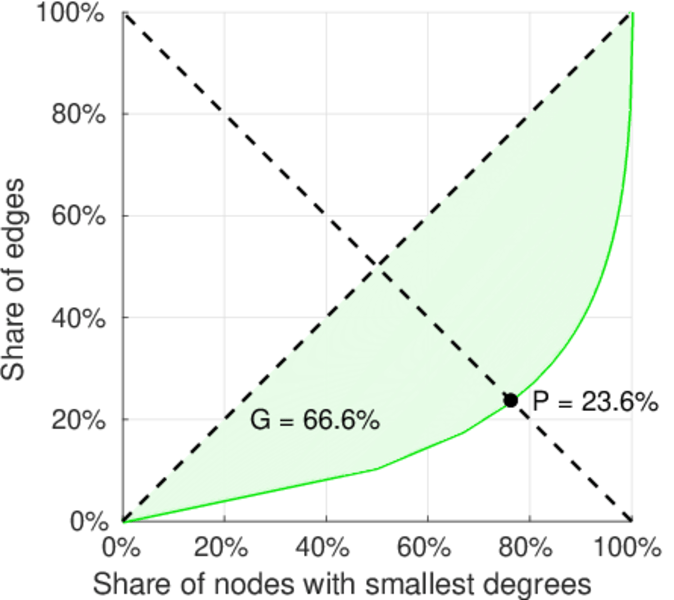
| Right balanced inequality ratio | P2 = | 0.236 379
|
| Relative edge distribution entropy | Her = | 0.916 513
|
| Power law exponent | γ = | 2.957 80
|
| Tail power law exponent | γt = | 2.071 00
|
| Degree assortativity | ρ = | −0.035 657 9
|
| Degree assortativity p-value | pρ = | 0.000 00
|
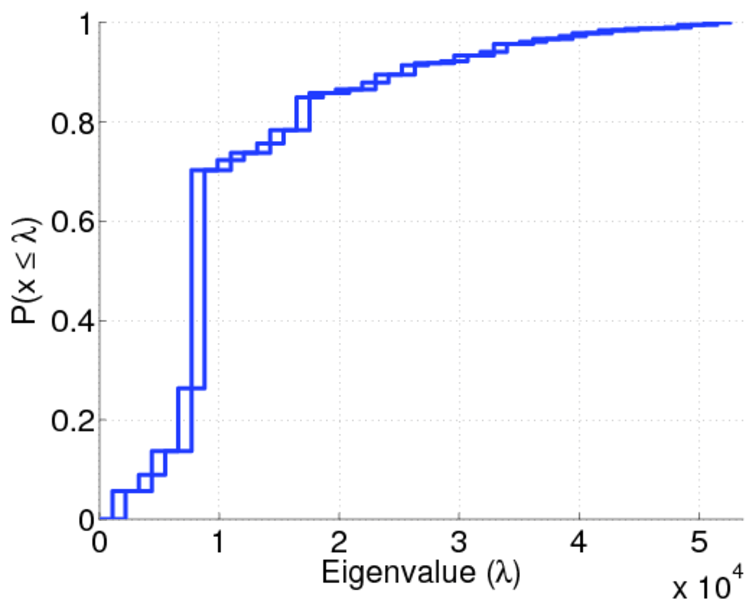
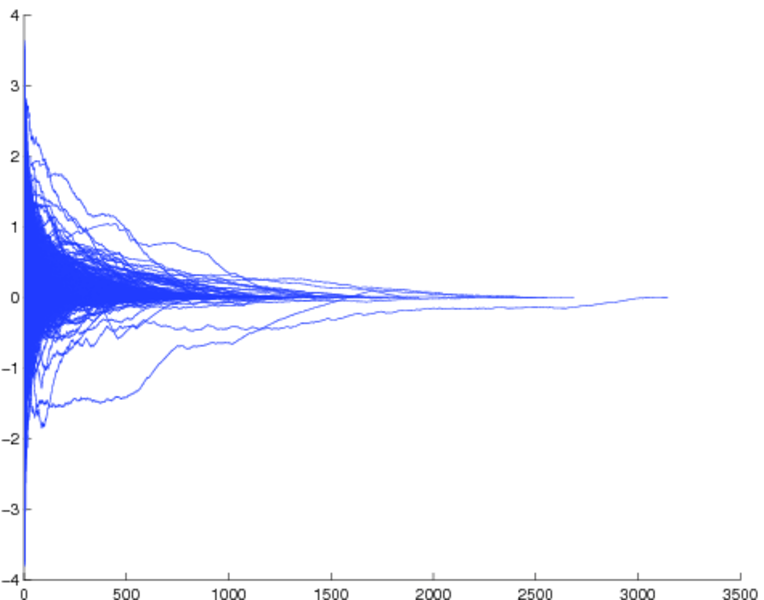
| Spectral norm | α = | 7,942.59
|
| Spectral separation | |λ1[A] / λ2[A]| = | 3.442 97
|
| Negativity | ζ = | 0.377 003
|
| Controllability | C = | 1,690,624
|
| Relative controllability | Cr = | 0.500 633
|
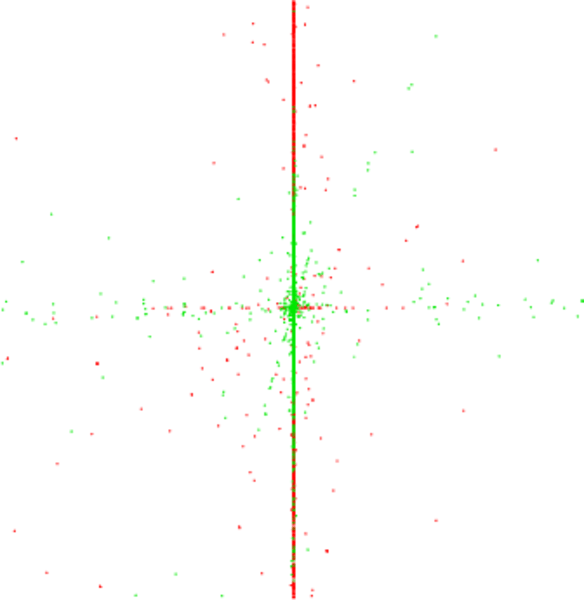
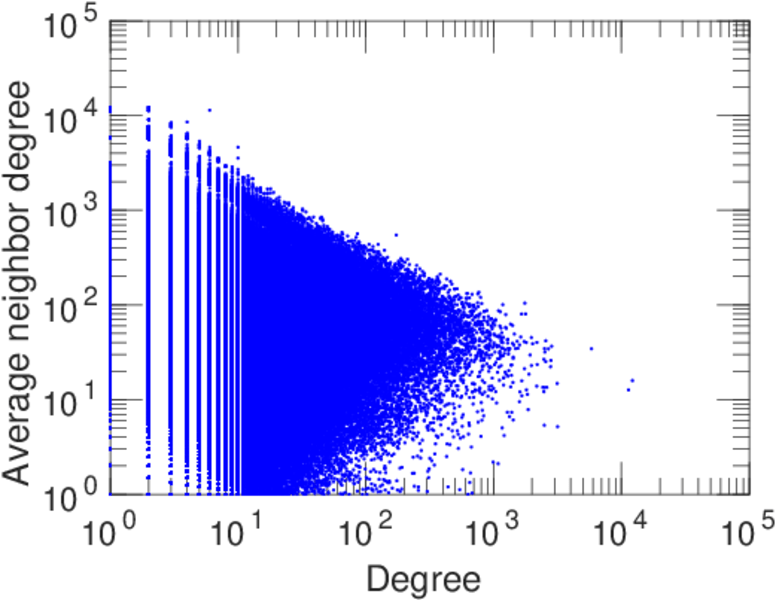
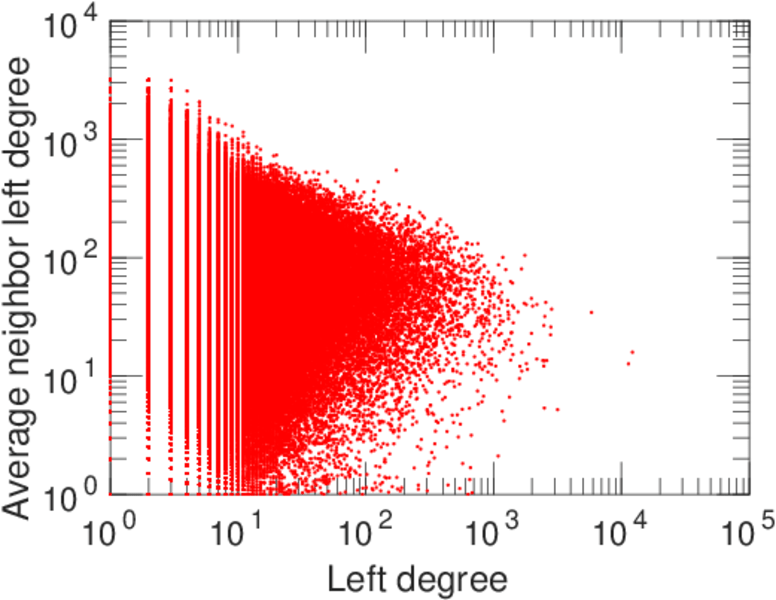
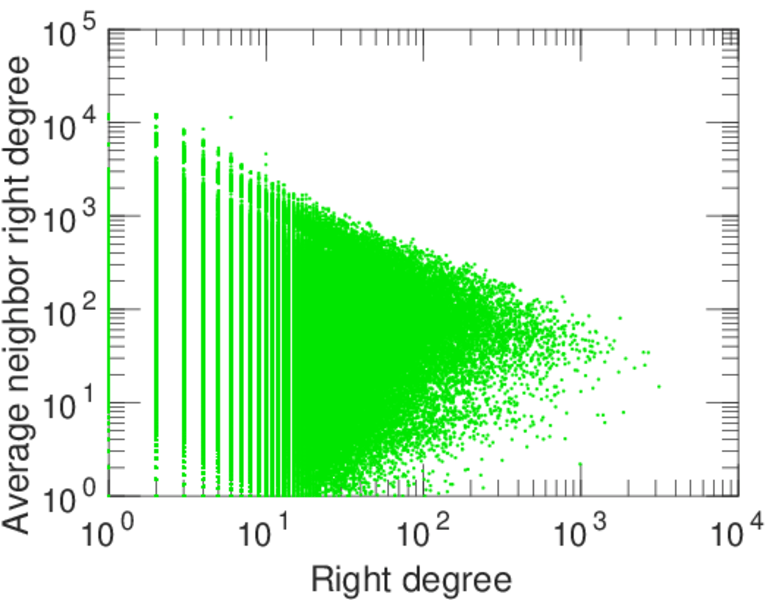
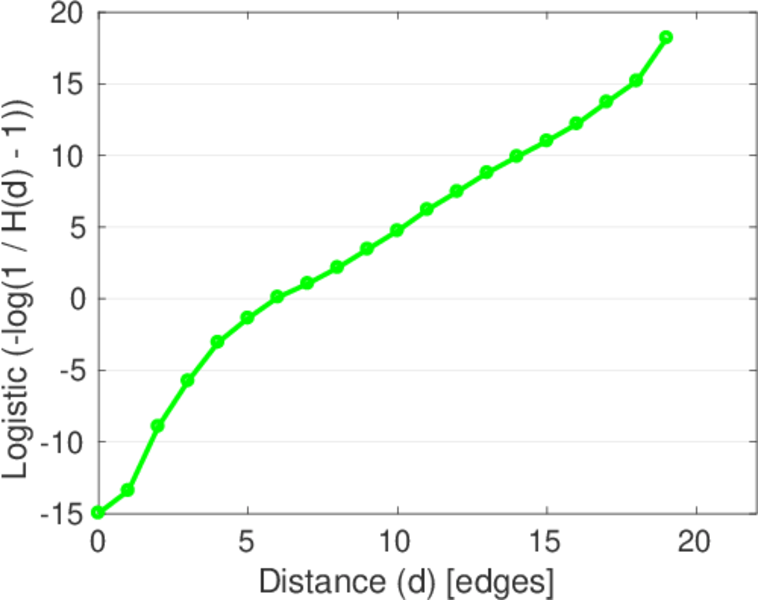
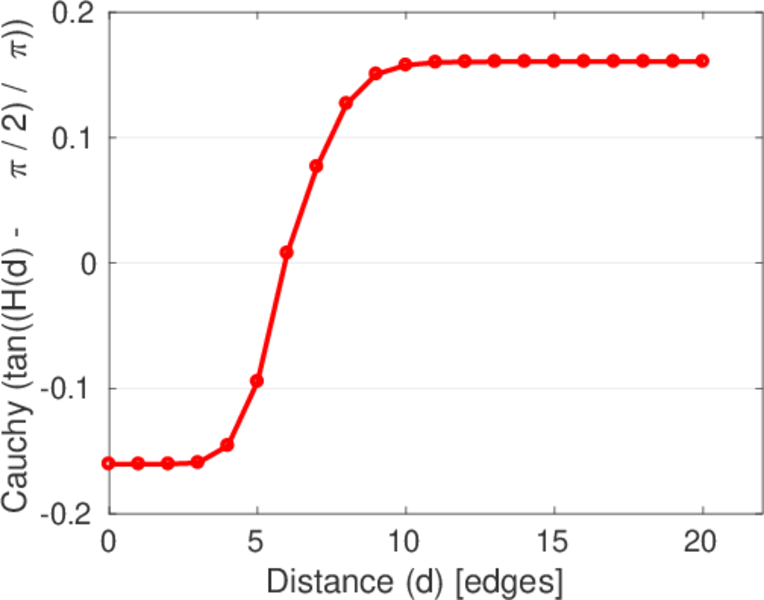
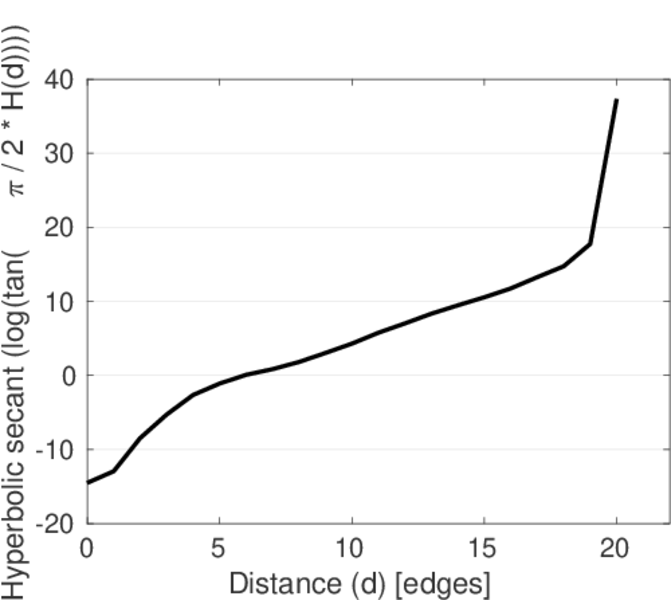
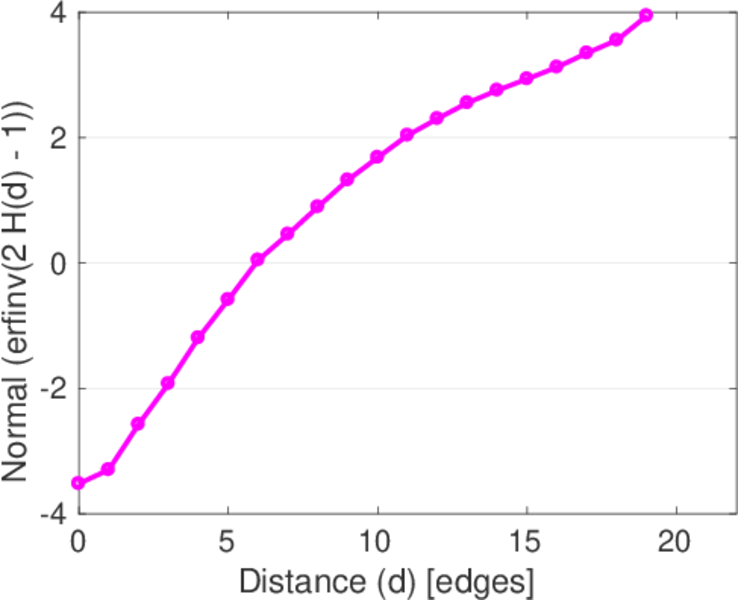
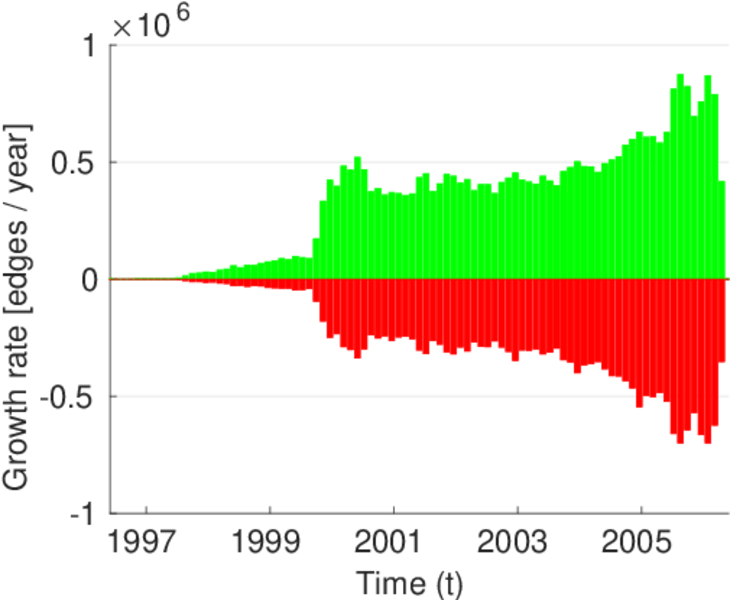
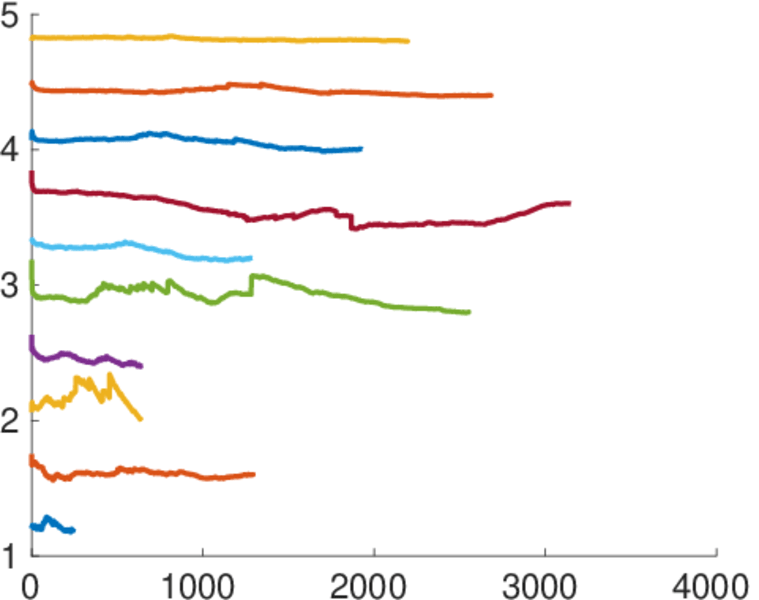
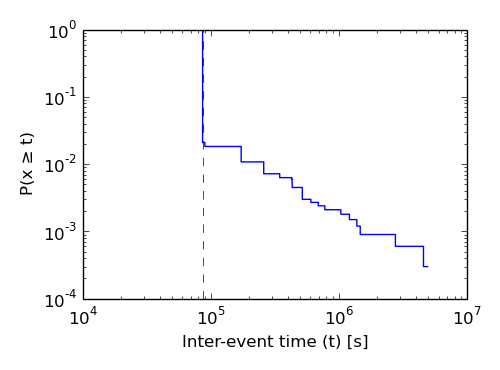
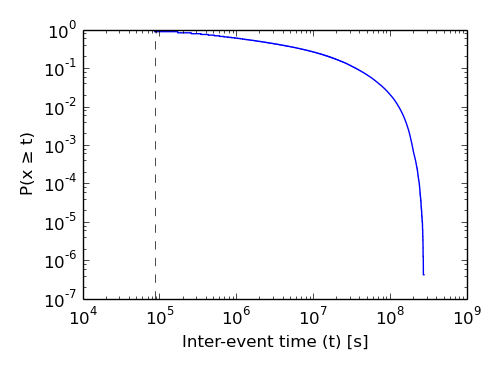
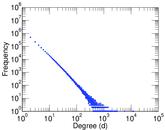
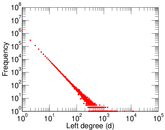
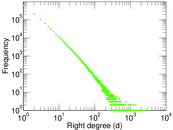
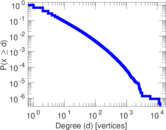
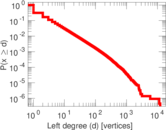
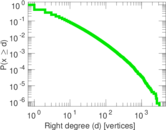
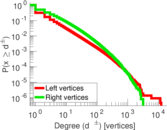
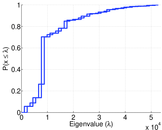
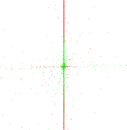
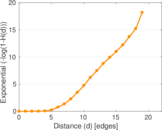
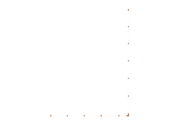
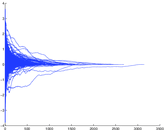
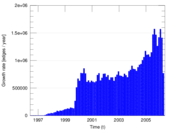
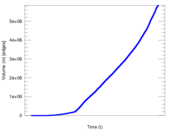
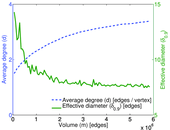
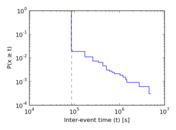
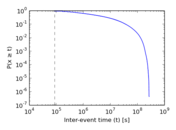
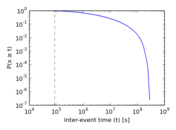
Plots


Downloads
References
|
[1]
|
Jérôme Kunegis.
KONECT – The Koblenz Network Collection.
In Proc. Int. Conf. on World Wide Web Companion, pages
1343–1350, 2013.
[ http ]
|
|
[2]
|
Ee-Peng Lim, Viet-An Nguyen, Nitin Jindal, Bing Liu, and Hady Wirawan Lauw.
Detecting product review spammers using rating behaviors.
In Proc. Int. Conf. on Information and Knowl. Management, pages
939–948, 2010.
|
|
[3]
|
Nitin Jindal and Bing Liu.
Opinion spam and analysis.
In Proc. Int. Conf. on Web Search and Web Data Min., pages
219–230, 2008.
|
|
[4]
|
Arjun Mukherjee, Bing Liu, and Natalie Glance.
Spotting fake reviewer groups in consumer reviews.
In Proc. Int. Conf. on World Wide Web, pages 191–200, 2012.
|
 KONECT ‣ Networks ‣
Buy Me a Coffee
KONECT ‣ Networks ‣
Buy Me a Coffee