arXiv hep-ph
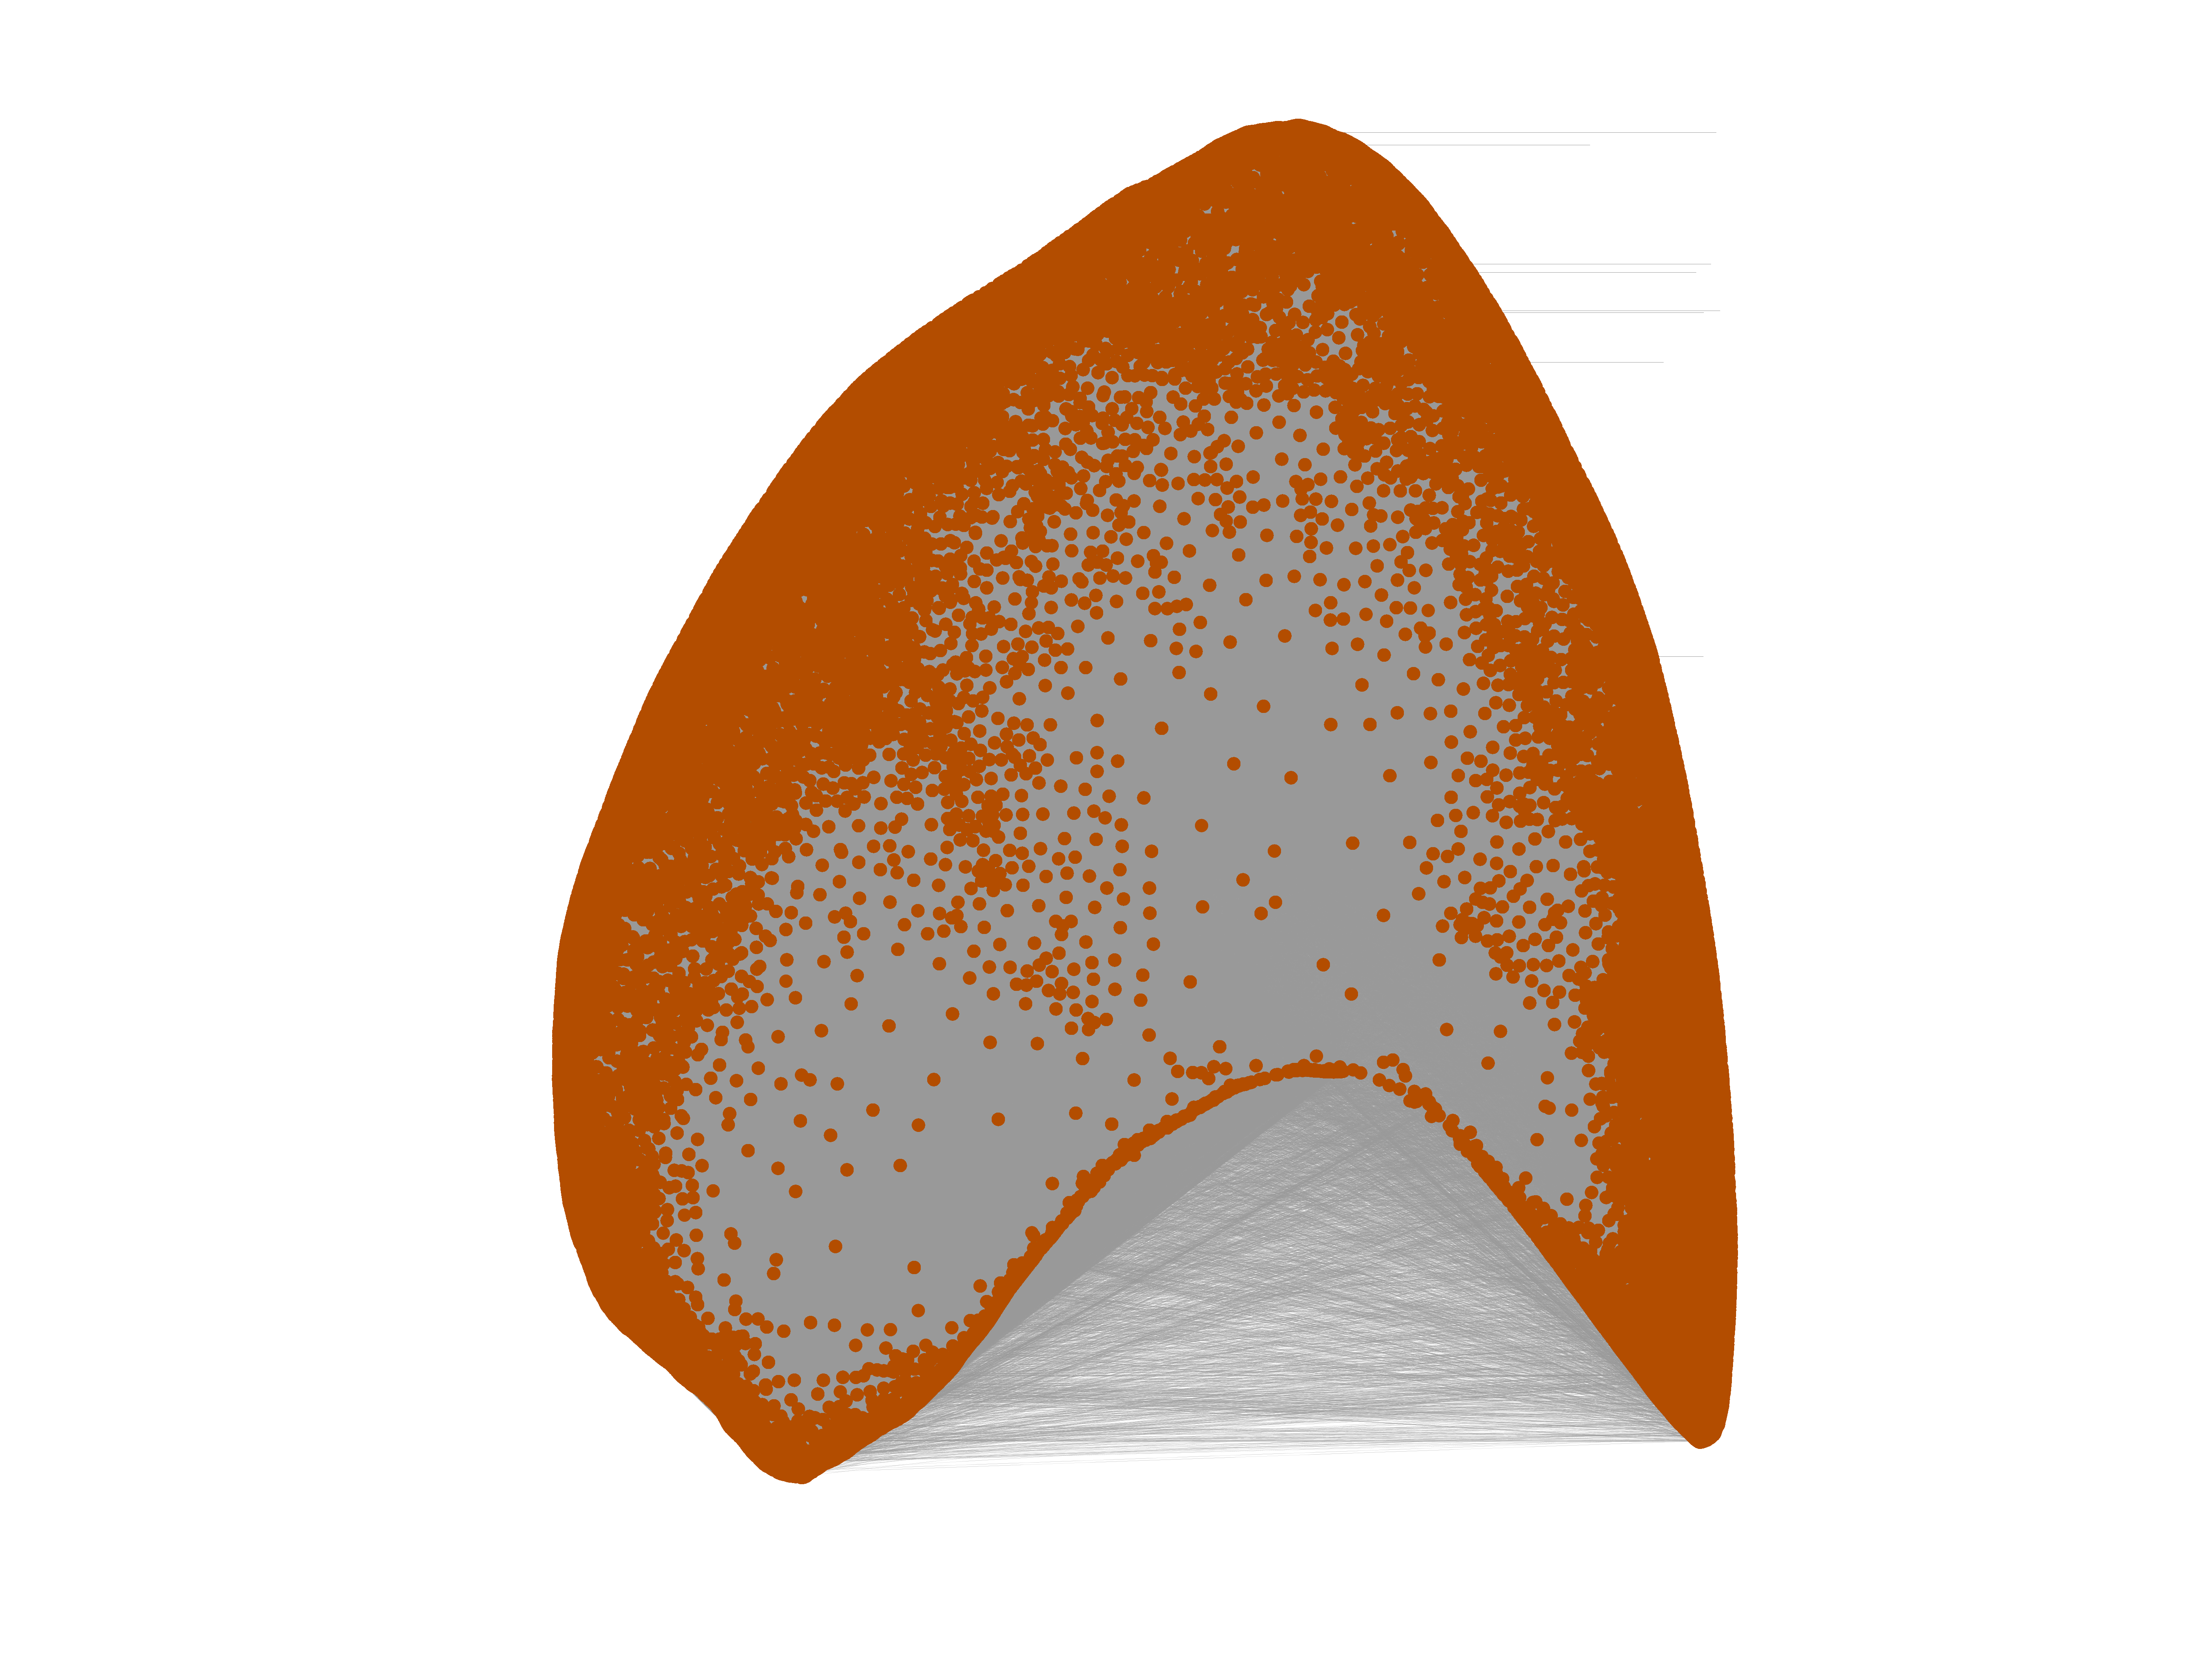
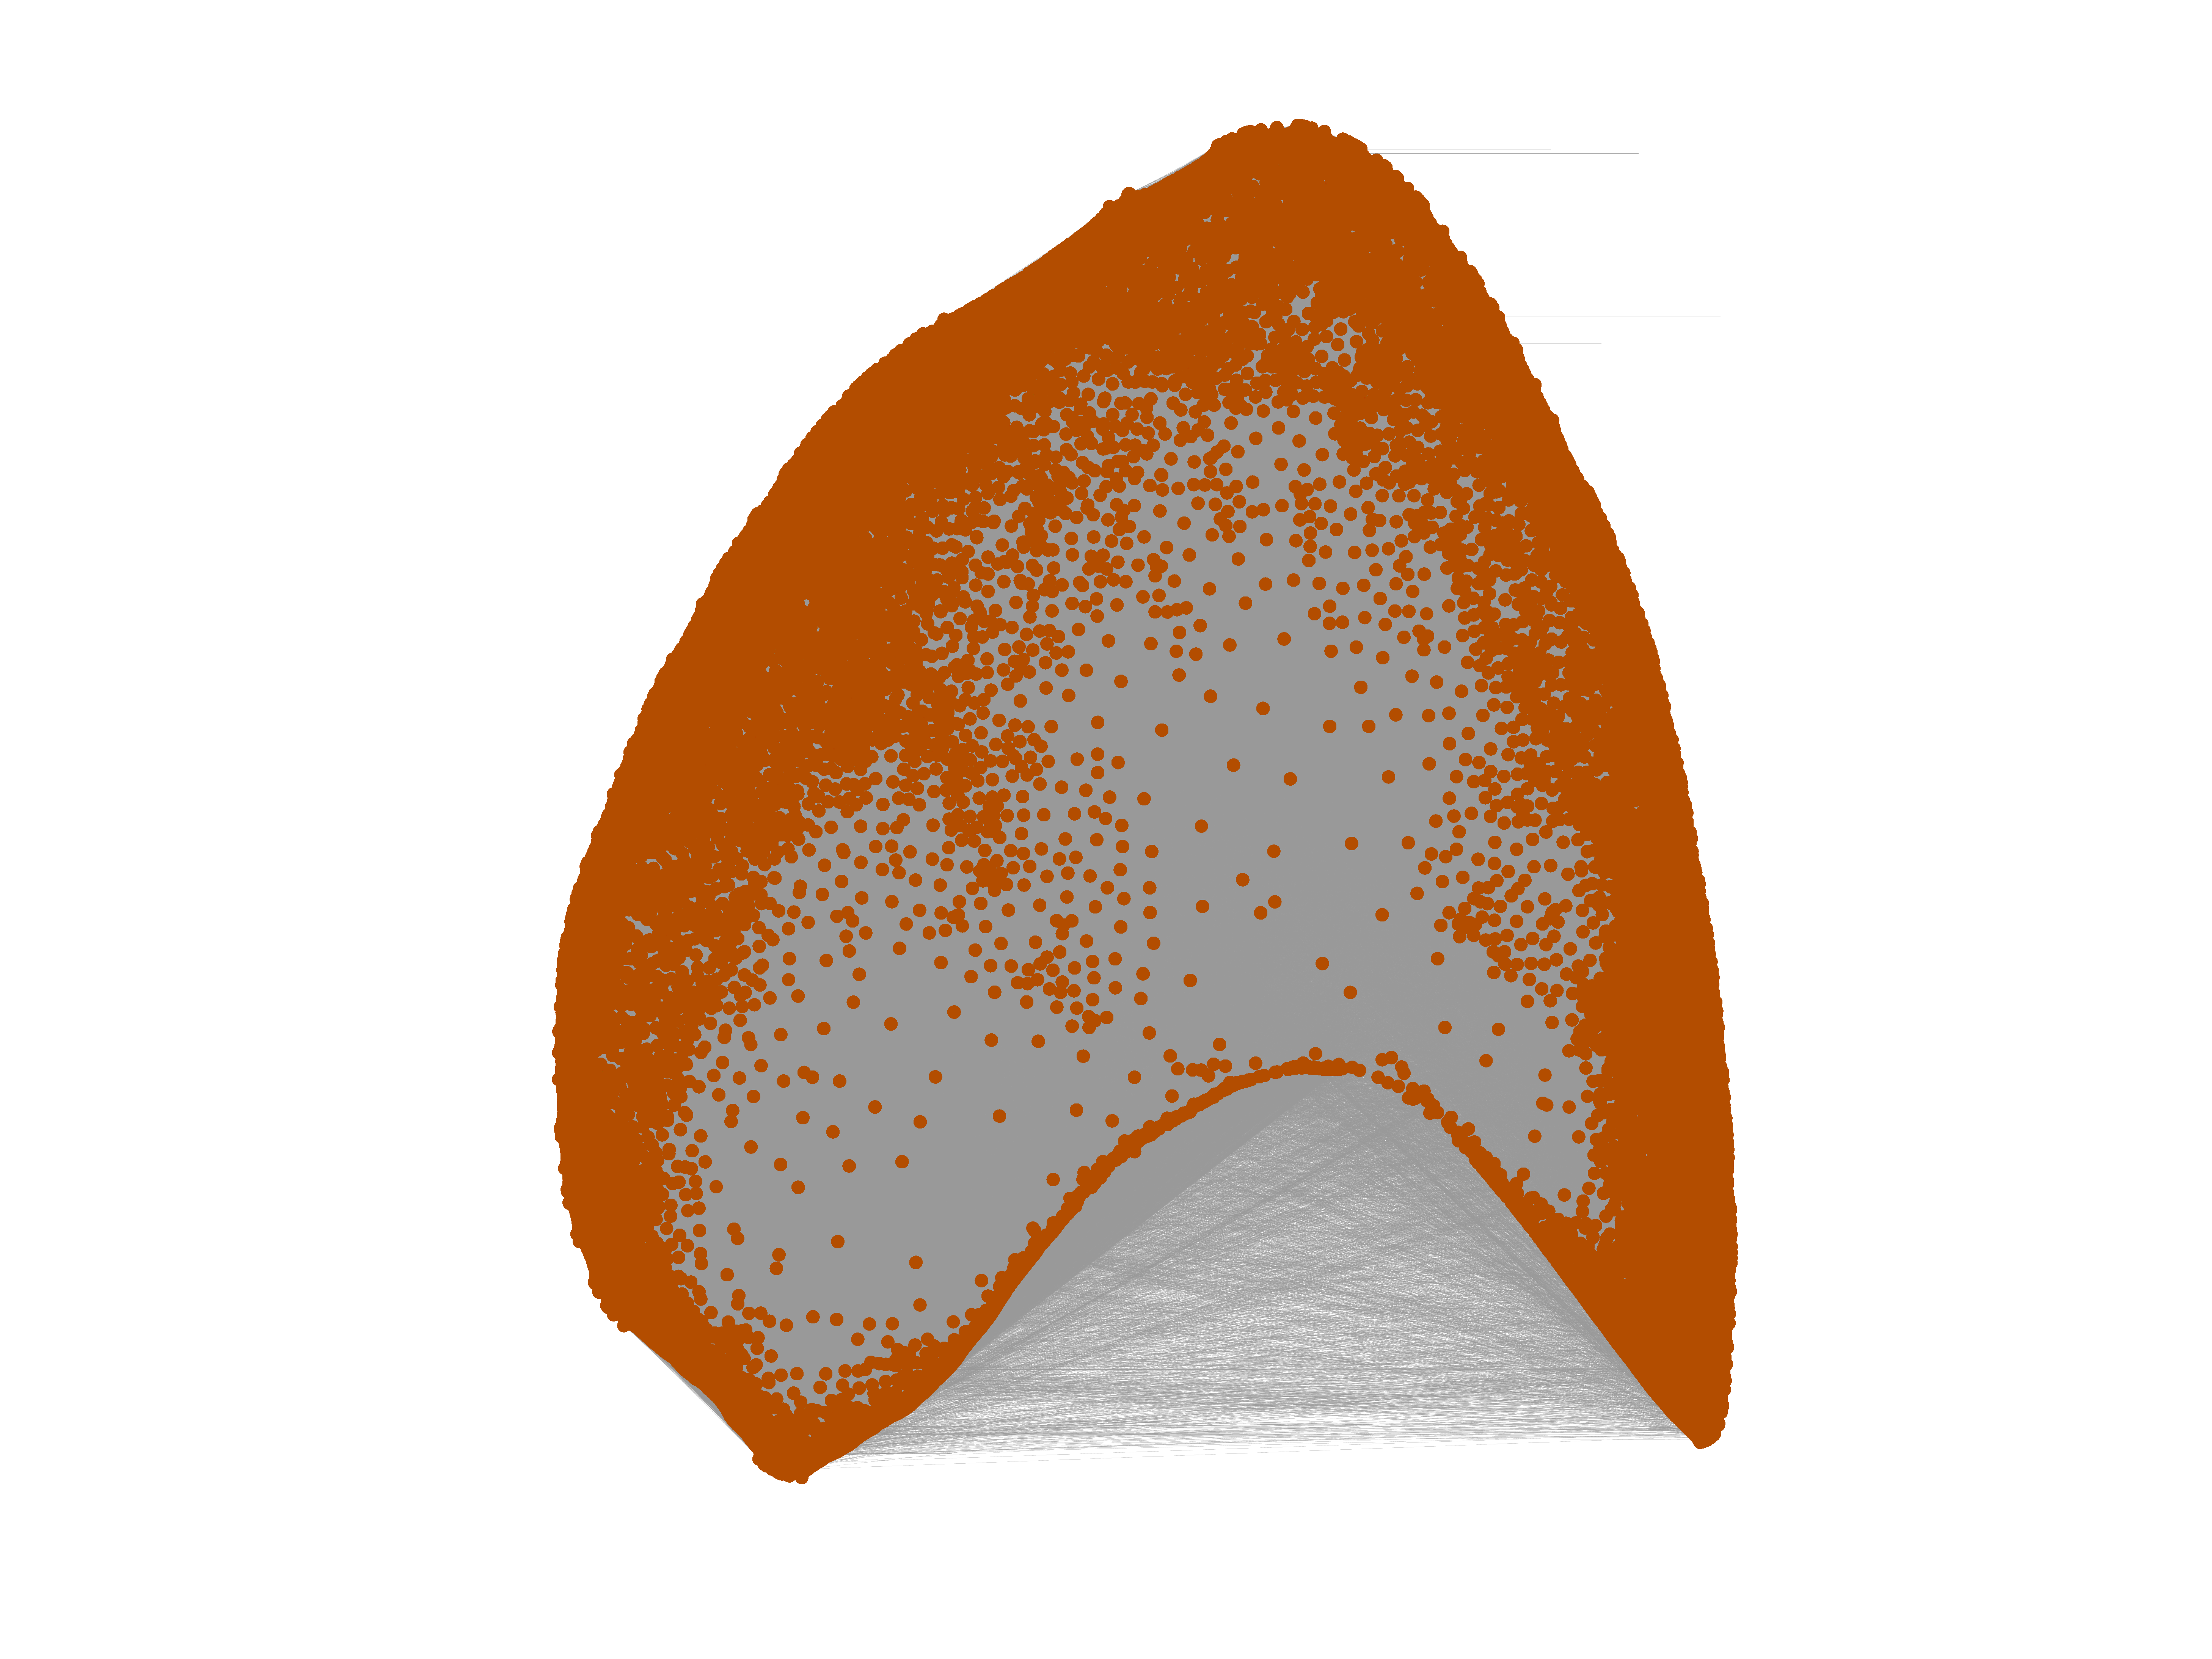
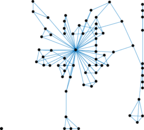
This is the co-citation network of scientific papers from the arXiv's High
Energy Physics – Phenomenology (hep-ph) section. An edge between two papers
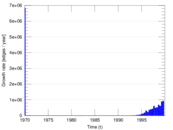
represents a common citing publication. Timestamps denote the date of the
citing publication.
Metadata
Statistics
| Size | n = | 28,093
|
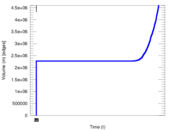
| Volume | m = | 4,596,803
|
| Unique edge count | m̿ = | 3,148,447
|
| Loop count | l = | 0
|
| Wedge count | s = | 2,097,593,926
|
| Claw count | z = | 862,892,139,927
|
| Cross count | x = | 409,090,345,290,895
|
| Triangle count | t = | 195,758,685
|
| Square count | q = | 69,676,915,730
|
| 4-Tour count | T4 = | 565,811,998,438
|
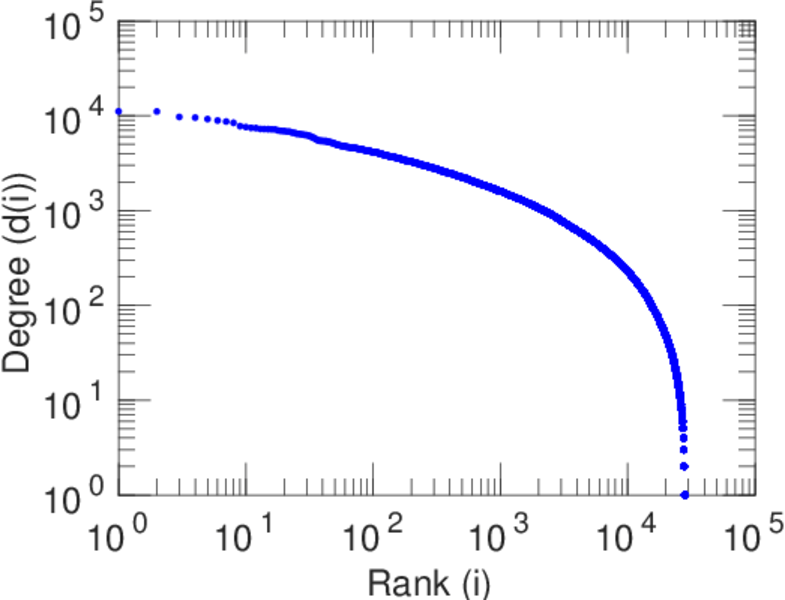
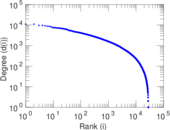
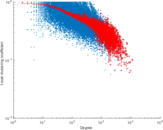
| Maximum degree | dmax = | 11,134
|
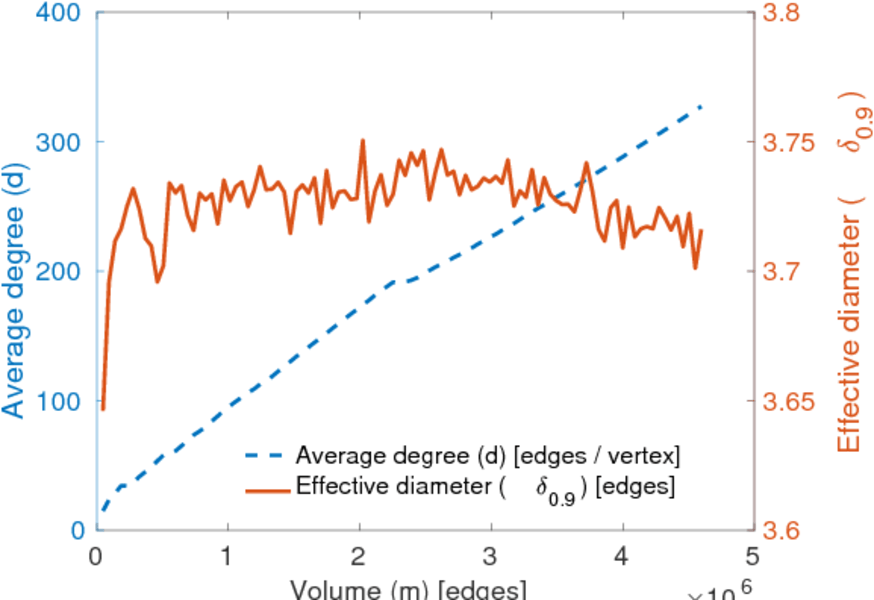
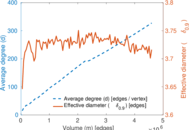
| Average degree | d = | 327.256
|
| Fill | p = | 0.007 978 95
|
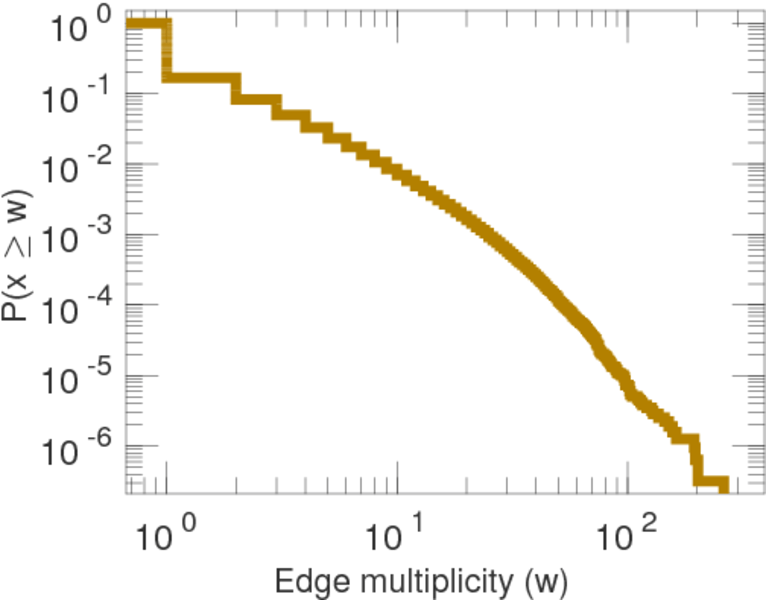
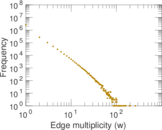
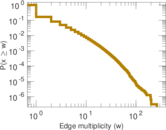
| Average edge multiplicity | m̃ = | 1.460 02
|
| Size of LCC | N = | 28,045
|
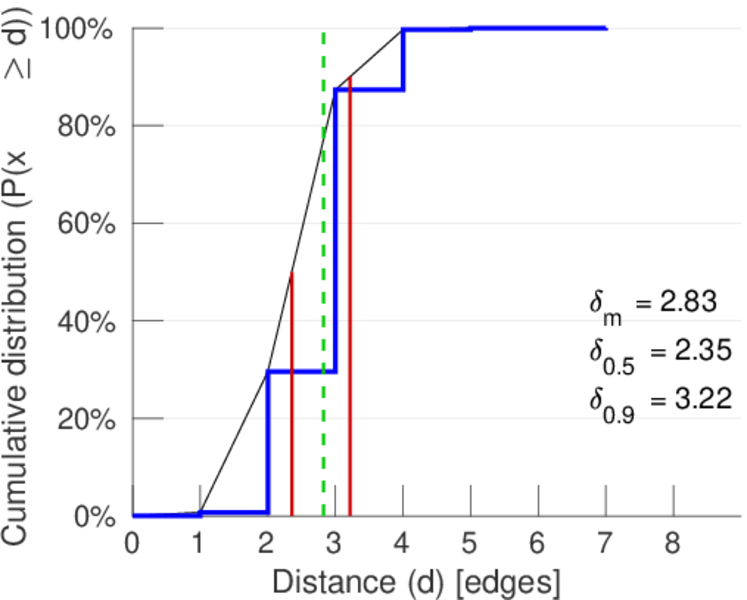
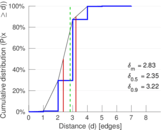
| Diameter | δ = | 9
|
| 50-Percentile effective diameter | δ0.5 = | 2.353 74
|
| 90-Percentile effective diameter | δ0.9 = | 3.216 57
|
| Median distance | δM = | 3
|
| Mean distance | δm = | 2.827 13
|
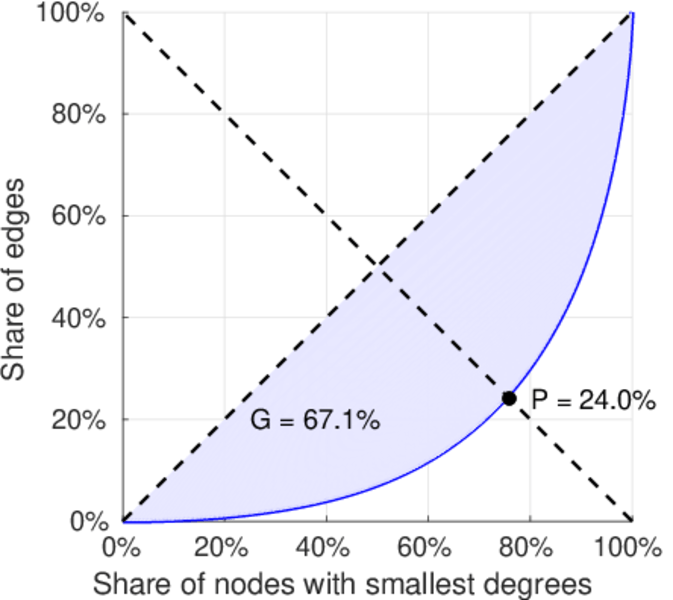
| Gini coefficient | G = | 0.670 678
|
| Balanced inequality ratio | P = | 0.239 576
|
| Relative edge distribution entropy | Her = | 0.934 575
|
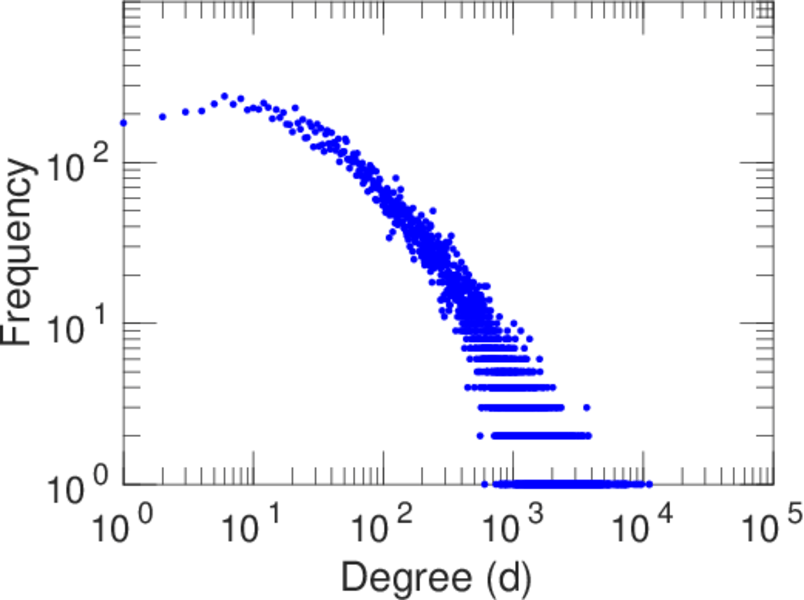
| Power law exponent | γ = | 1.219 86
|
| Tail power law exponent | γt = | 1.731 00
|
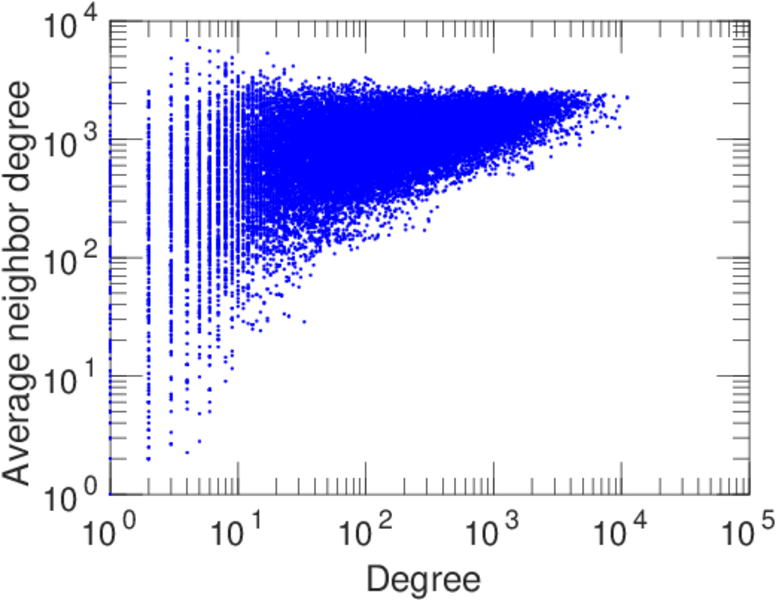
| Degree assortativity | ρ = | +0.033 384 3
|
| Degree assortativity p-value | pρ = | 0.000 00
|
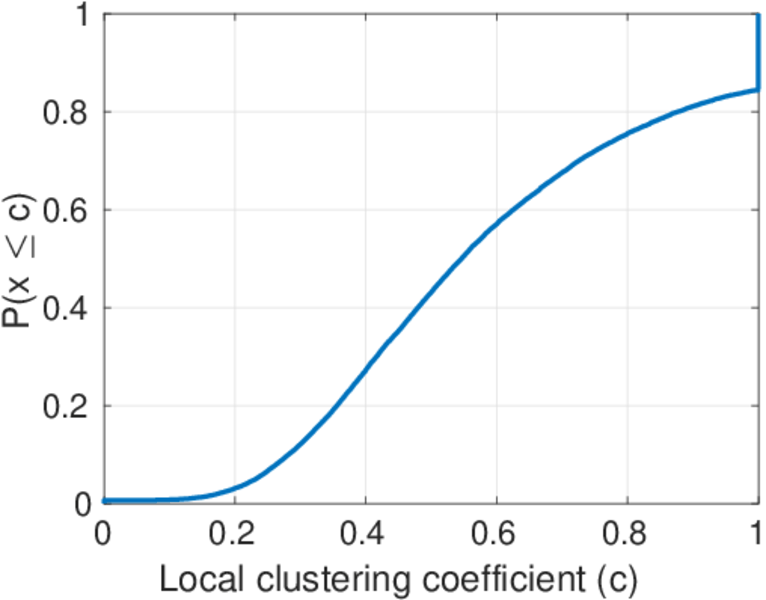
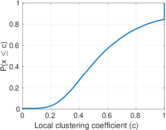
| Clustering coefficient | c = | 0.279 976
|
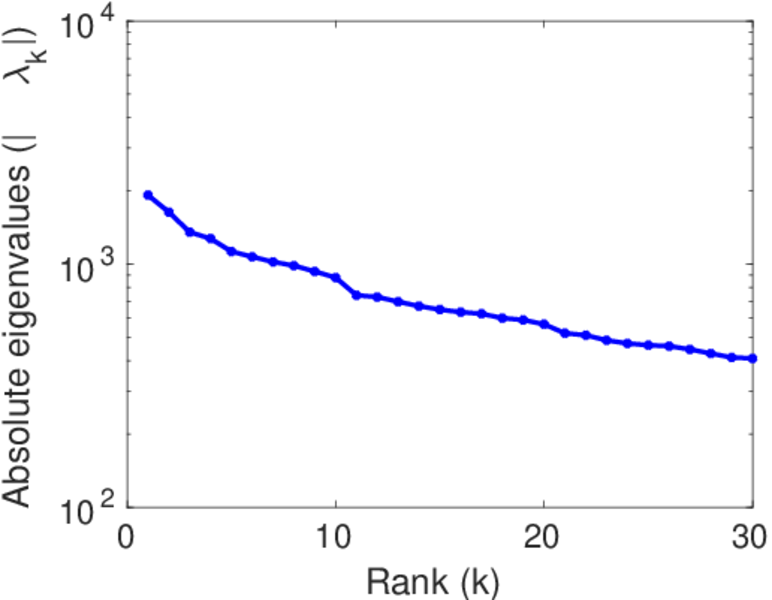
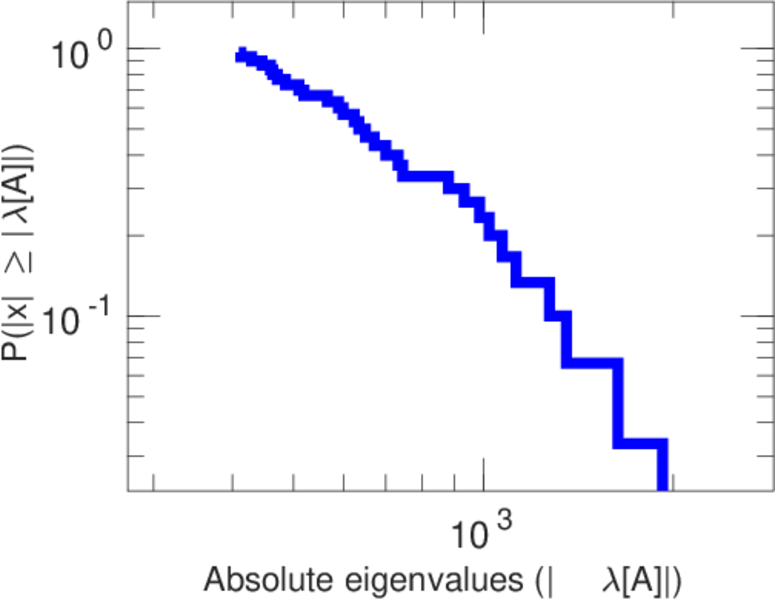
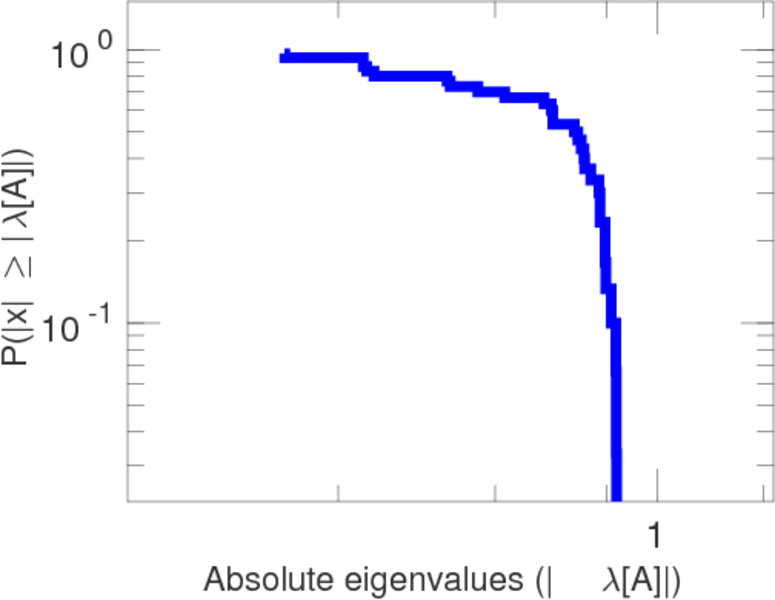
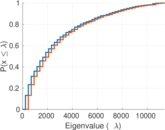
| Spectral norm | α = | 1,921.46
|
| Algebraic connectivity | a = | 0.169 297
|
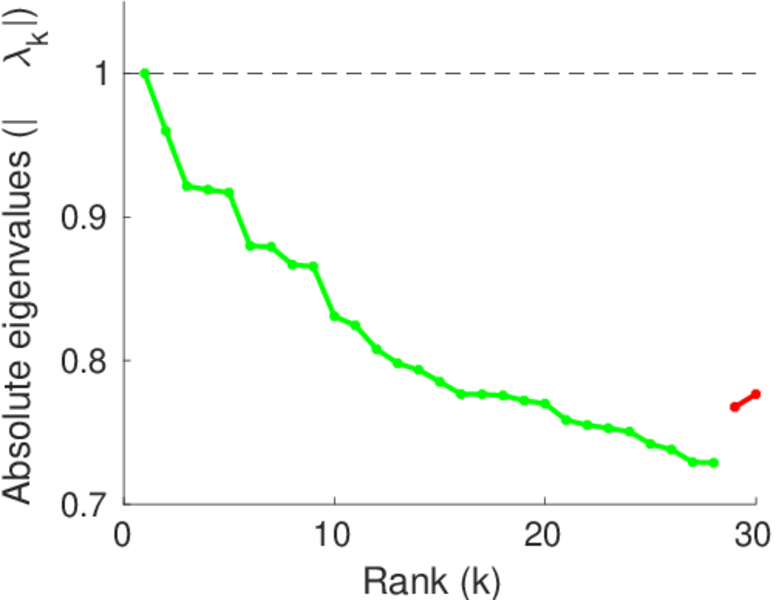
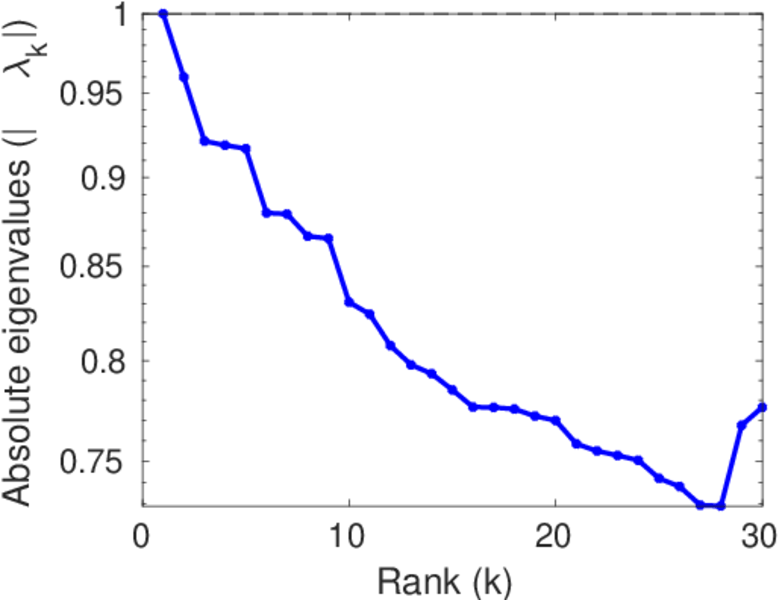
| Spectral separation | |λ1[A] / λ2[A]| = | 1.175 18
|
| Non-bipartivity | bA = | 0.862 128
|
| Normalized non-bipartivity | bN = | 0.232 408
|
| Algebraic non-bipartivity | χ = | 0.381 300
|
| Spectral bipartite frustration | bK = | 0.000 424 561
|
| Controllability | C = | 11
|
| Relative controllability | Cr = | 0.000 391 557
|
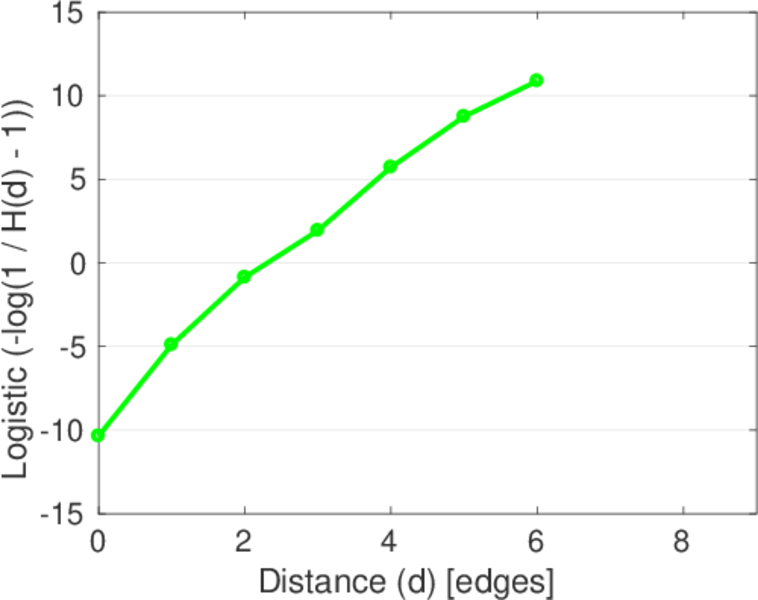
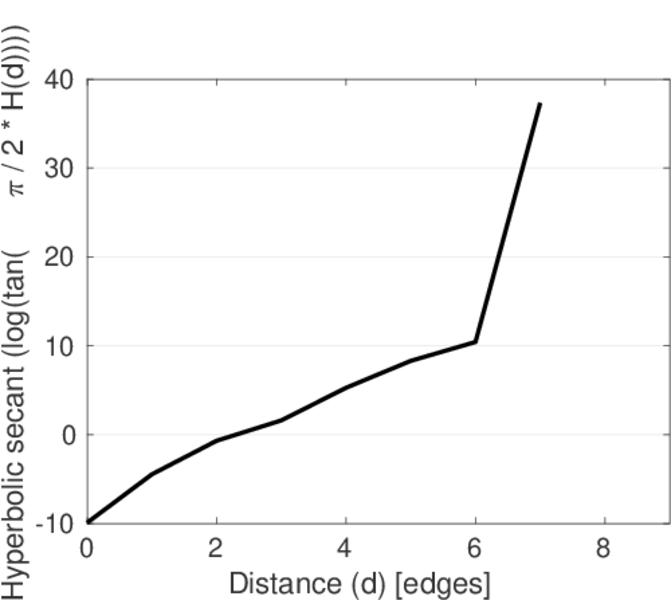
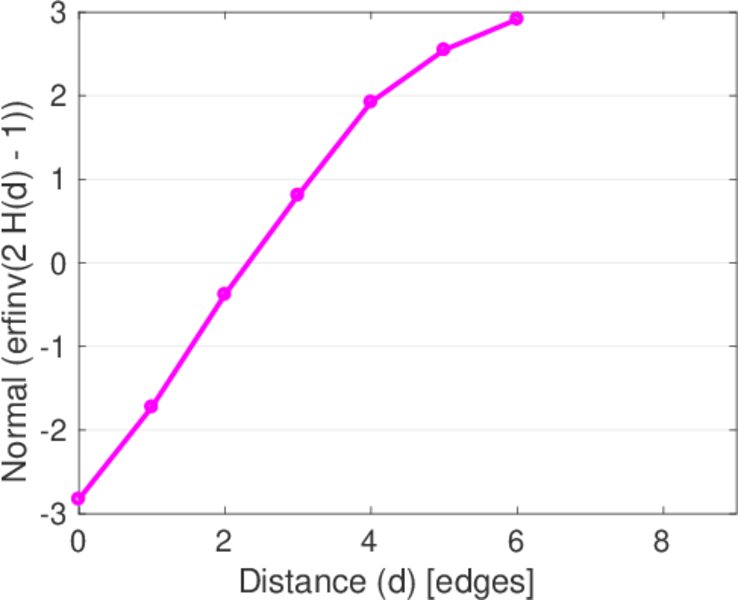
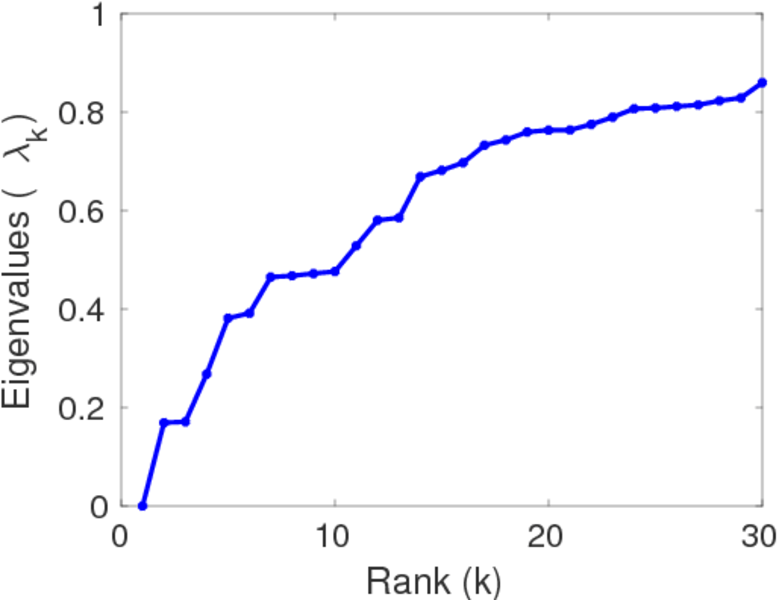
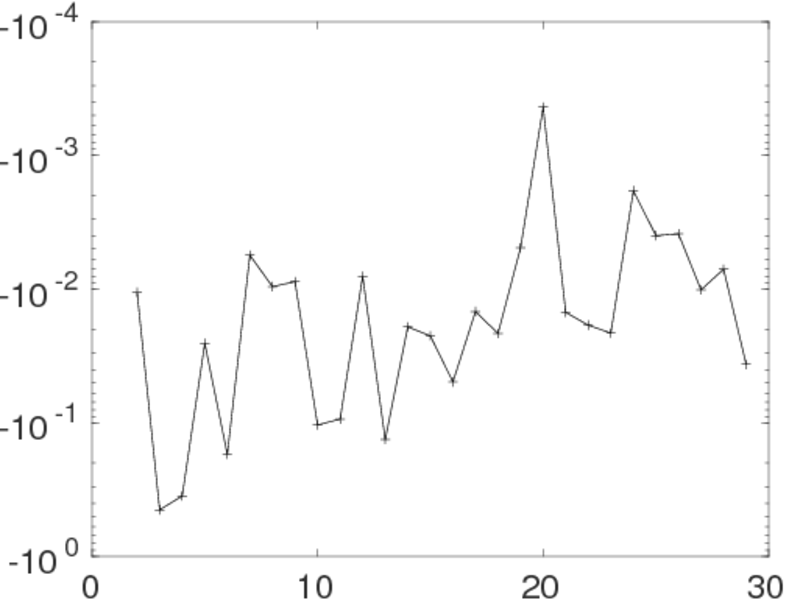
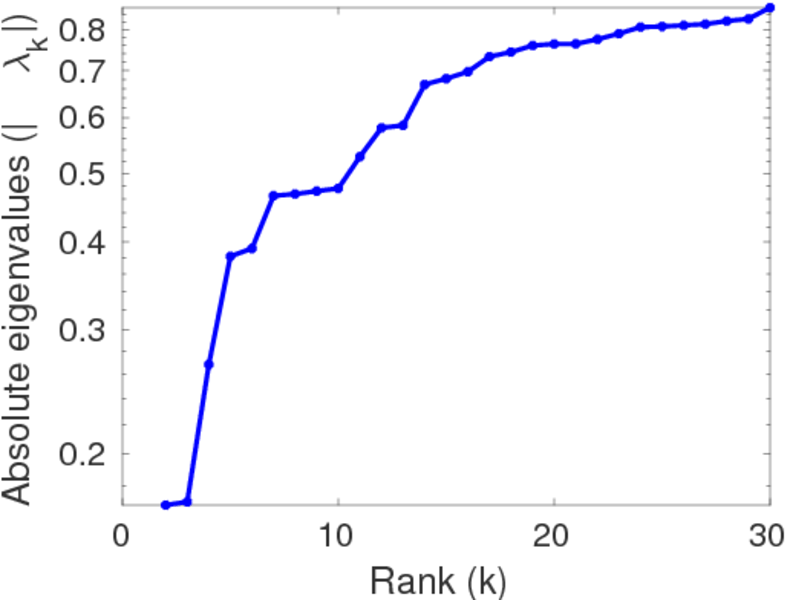
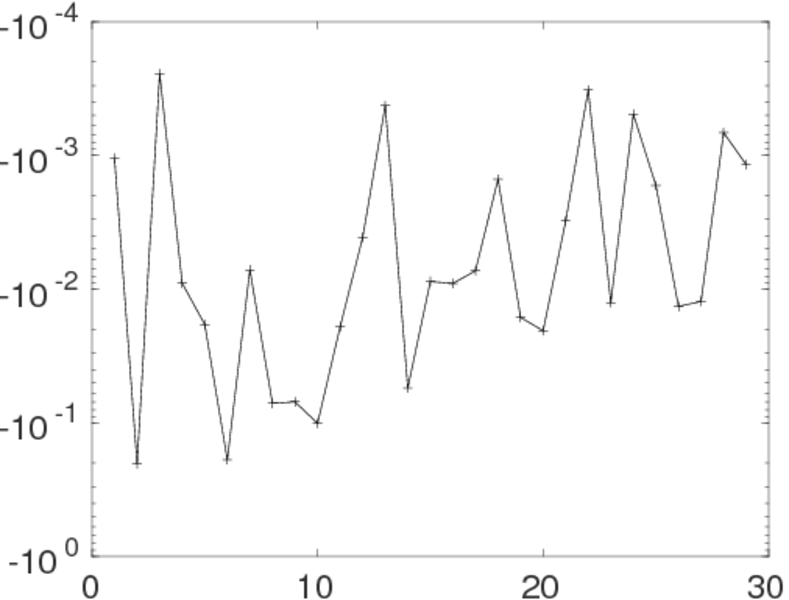
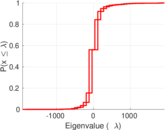
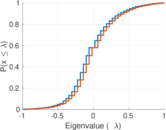
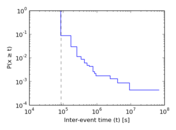
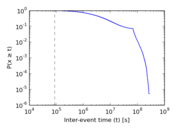
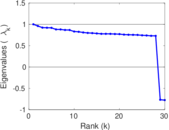
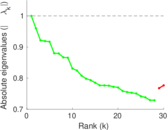
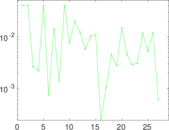
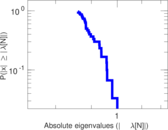
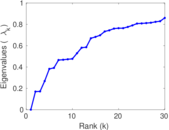
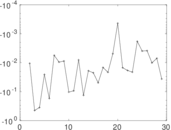
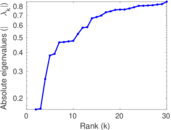
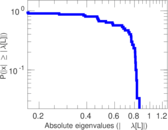
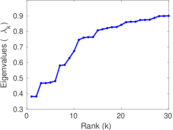
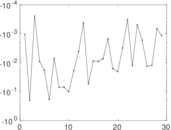
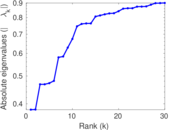
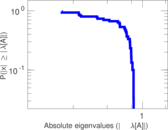
Plots


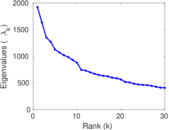
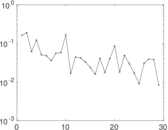
Matrix decompositions plots


Downloads
References
|
[1]
|
Jérôme Kunegis.
KONECT – The Koblenz Network Collection.
In Proc. Int. Conf. on World Wide Web Companion, pages
1343–1350, 2013.
[ http ]
|
|
[2]
|
Jure Leskovec, Jon Kleinberg, and Christos Faloutsos.
Graph evolution: Densification and shrinking diameters.
ACM Trans. Knowl. Discov. from Data, 1(1):1–40, 2007.
|
 KONECT ‣ Networks ‣
Buy Me a Coffee
KONECT ‣ Networks ‣
Buy Me a Coffee