arXiv hep-th
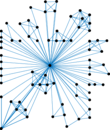
This is the co-citation graph of papers of scientific papers from the arXiv's
High Energy Physics – Theory (hep-th) section. An edge between two papers
represents a paper that cites both papers. Timestamps denote the date of a
publication.
Metadata
Statistics
| Size | n = | 22,908
|
| Volume | m = | 2,673,133
|
| Unique edge count | m̿ = | 2,444,798
|
| Wedge count | s = | 2,134,203,872
|
| Claw count | z = | 1,506,168,874,130
|
| Cross count | x = | 1,478,988,337,901,334
|
| Triangle count | t = | 191,358,360
|
| Square count | q = | 92,607,592,200
|
| 4-Tour count | T4 = | 749,402,442,684
|
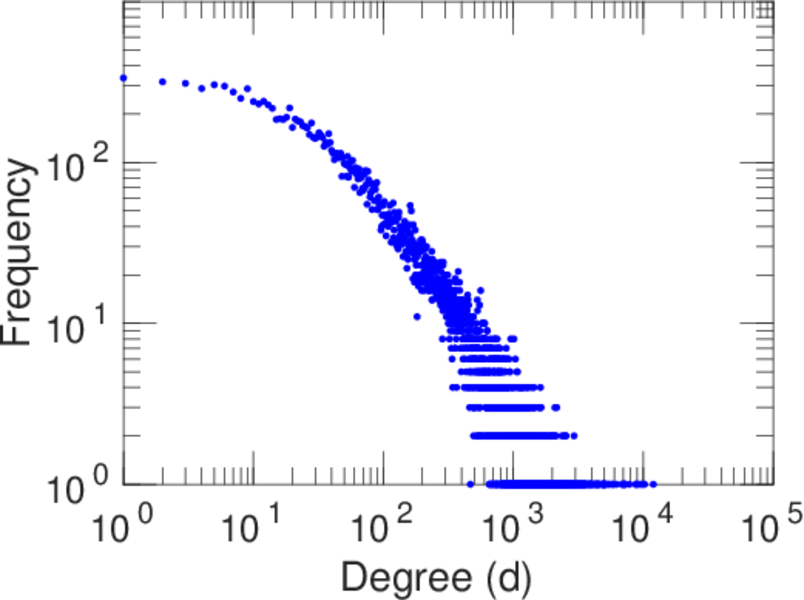
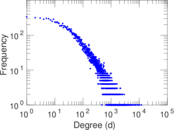
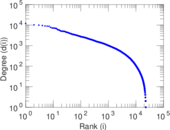
| Maximum degree | dmax = | 11,967
|
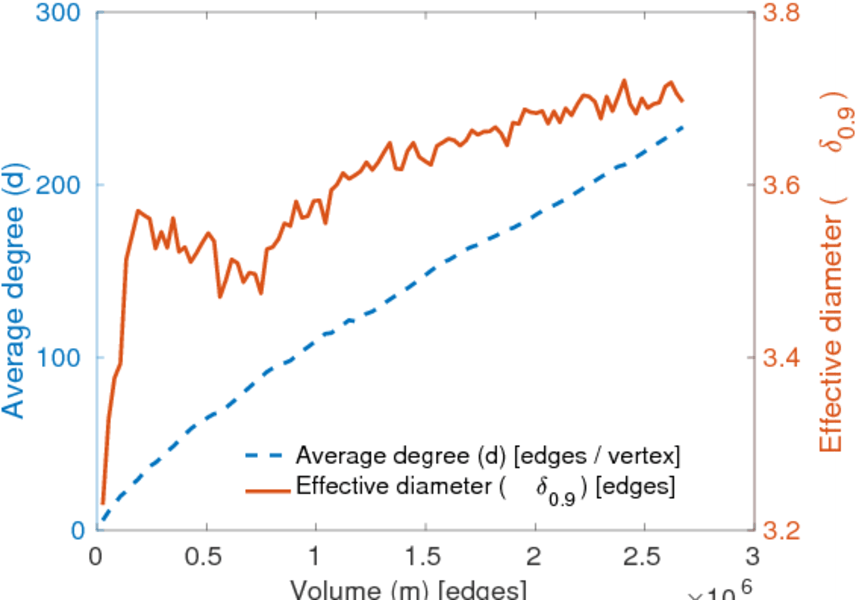
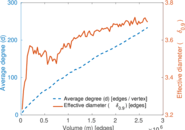
| Average degree | d = | 233.380
|
| Fill | p = | 0.009 317 89
|
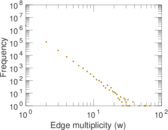
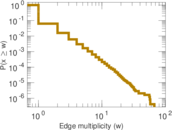
| Average edge multiplicity | m̃ = | 1.093 40
|
| Size of LCC | N = | 22,721
|
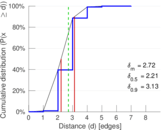
| Diameter | δ = | 9
|
| 50-Percentile effective diameter | δ0.5 = | 2.212 36
|
| 90-Percentile effective diameter | δ0.9 = | 3.131 39
|
| Median distance | δM = | 3
|
| Mean distance | δm = | 2.717 19
|
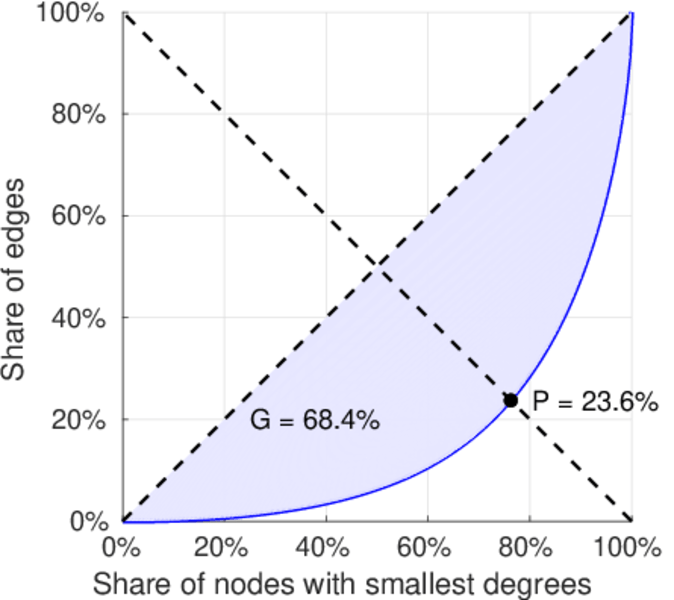
| Gini coefficient | G = | 0.684 442
|
| Balanced inequality ratio | P = | 0.235 728
|
| Power law exponent | γ = | 1.233 90
|
| Tail power law exponent | γt = | 1.721 00
|
| Degree assortativity | ρ = | −0.033 934 3
|
| Degree assortativity p-value | pρ = | 0.000 00
|
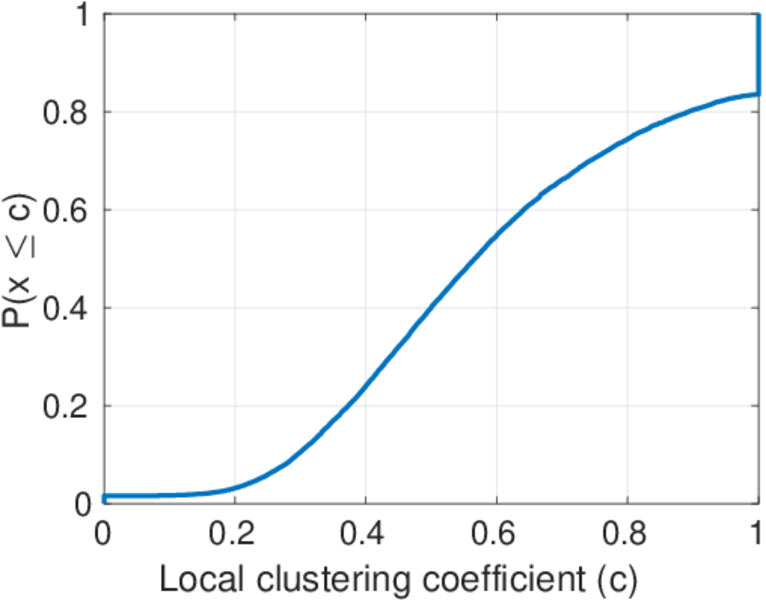
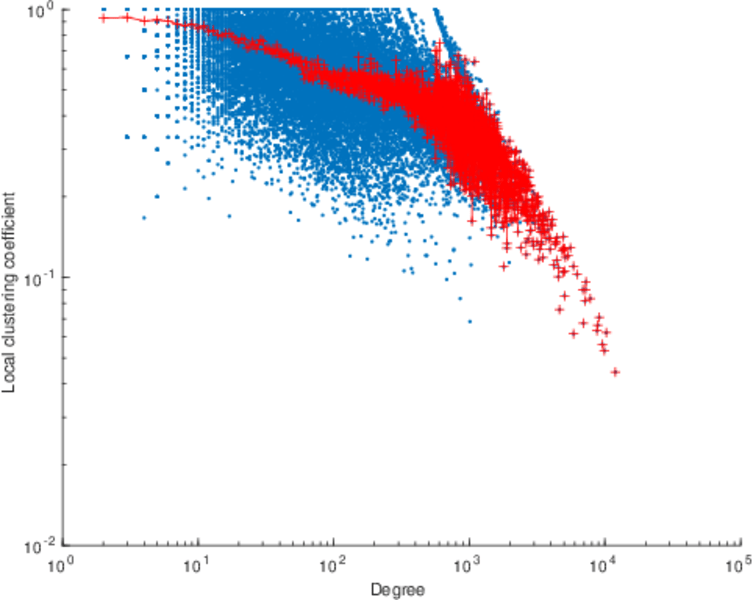
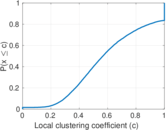
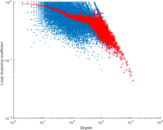
| Clustering coefficient | c = | 0.268 988
|
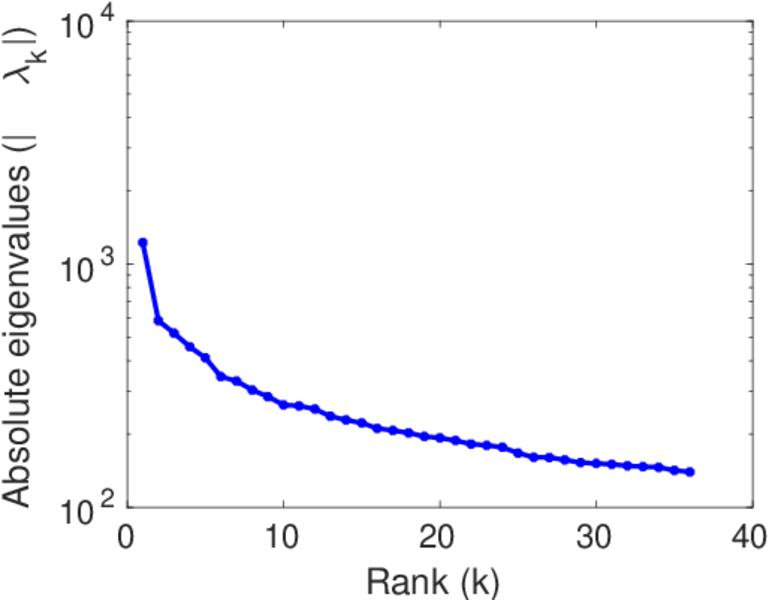
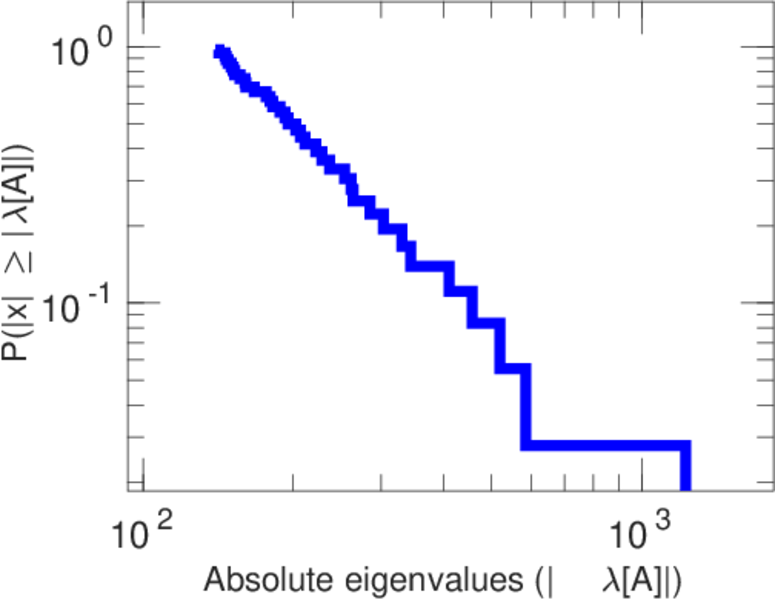
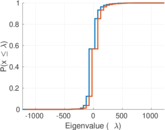
| Spectral norm | α = | 1,225.32
|
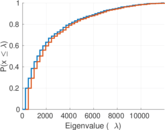
| Algebraic connectivity | a = | 0.175 383
|
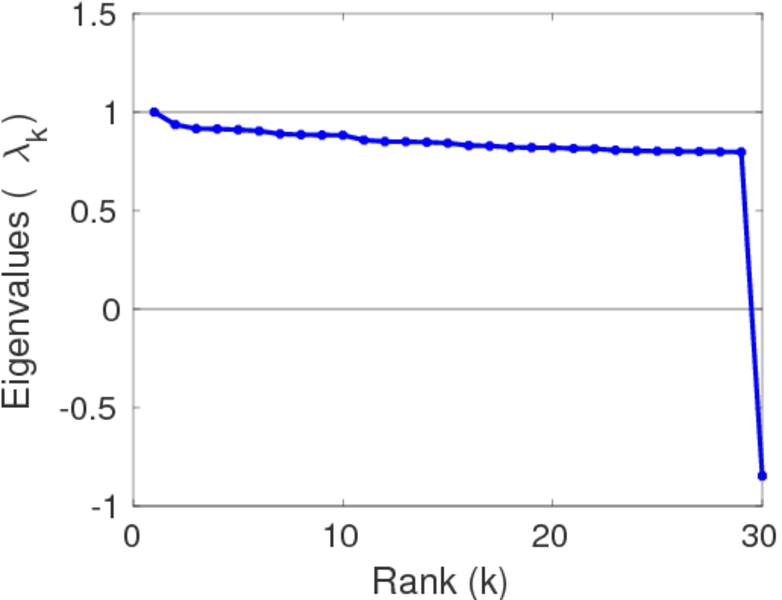
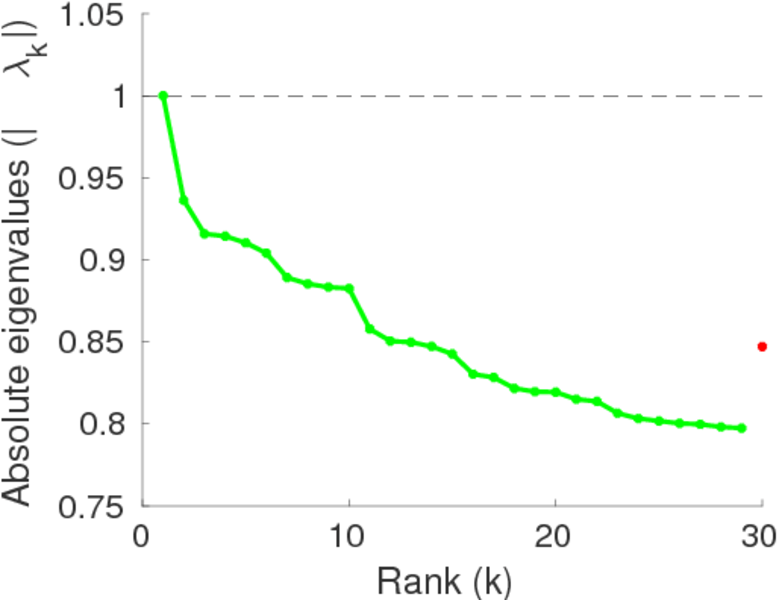
| Spectral separation | |λ1[A] / λ2[A]| = | 2.093 52
|
| Non-bipartivity | bA = | 0.896 403
|
| Normalized non-bipartivity | bN = | 0.152 926
|
| Algebraic non-bipartivity | χ = | 0.235 724
|
| Spectral bipartite frustration | bK = | 0.000 273 859
|
| Controllability | C = | 22
|
| Relative controllability | Cr = | 0.000 960 363
|
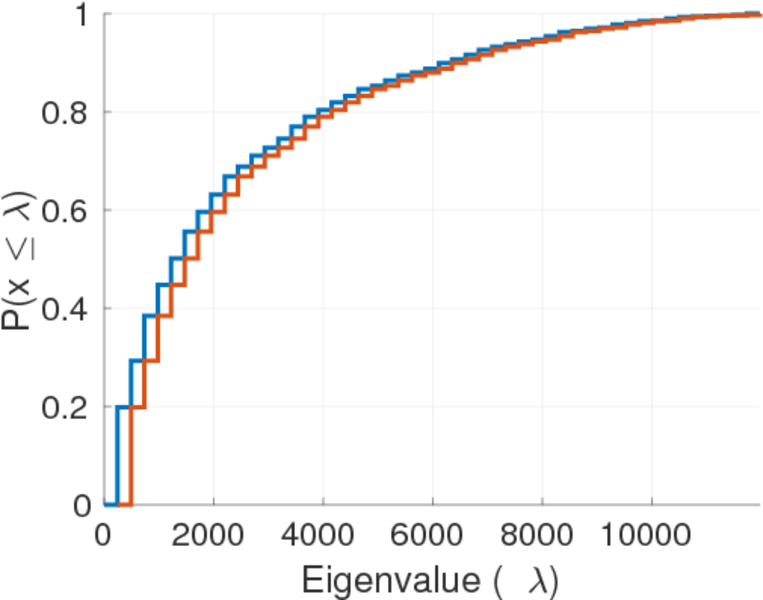
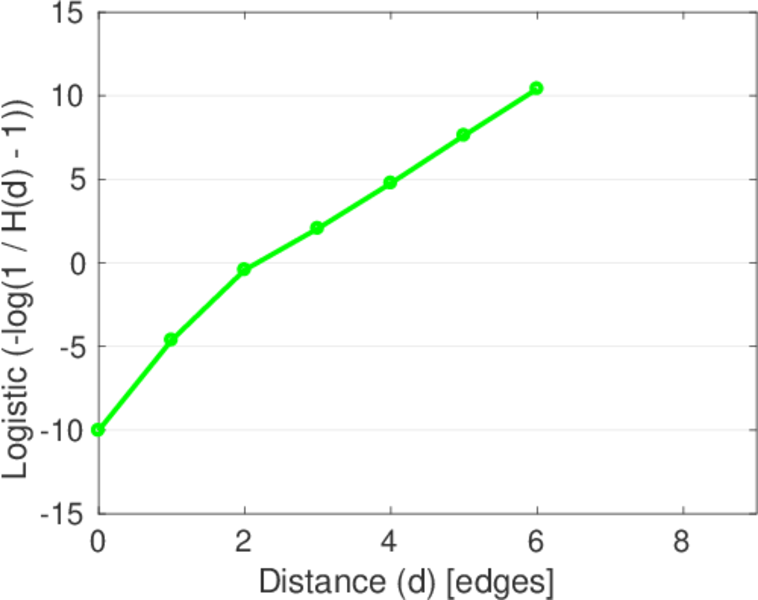
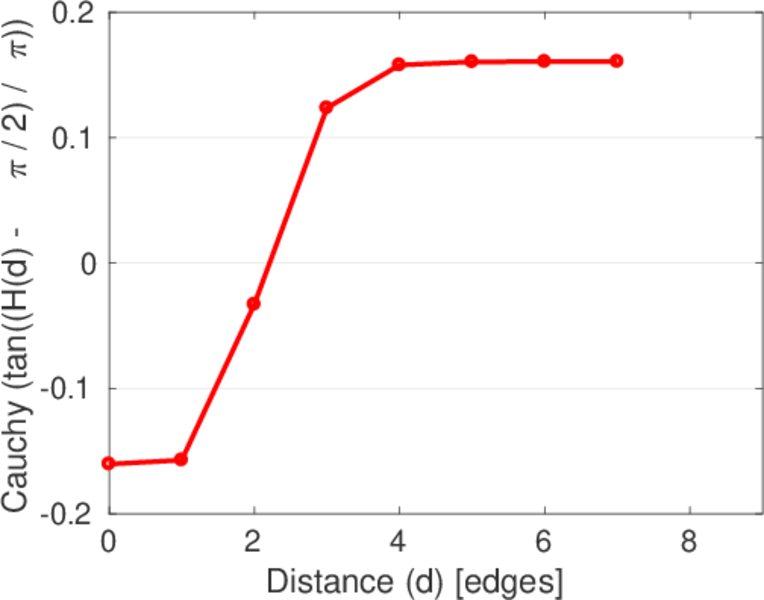
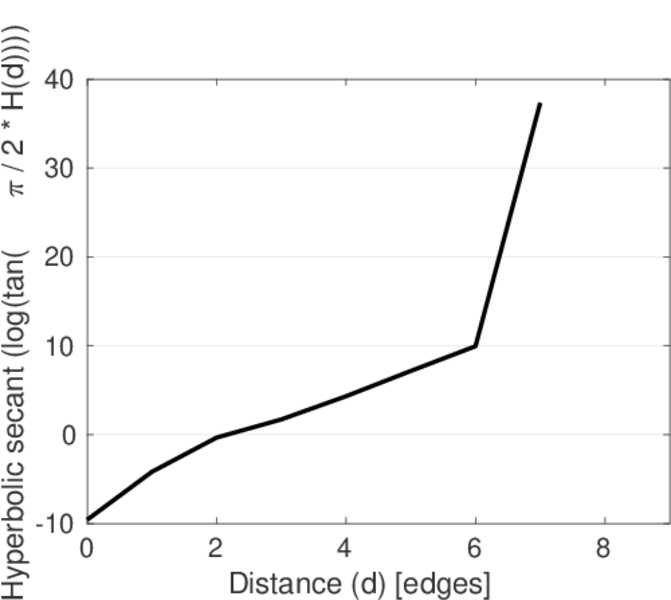
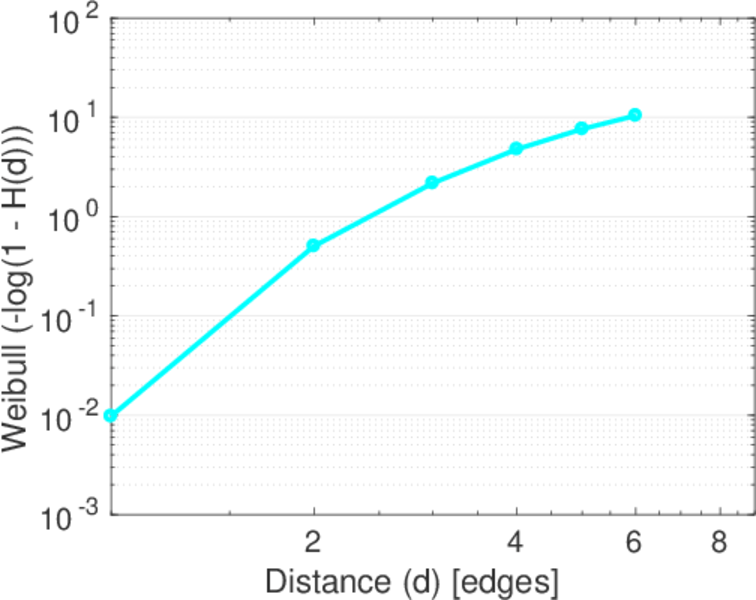
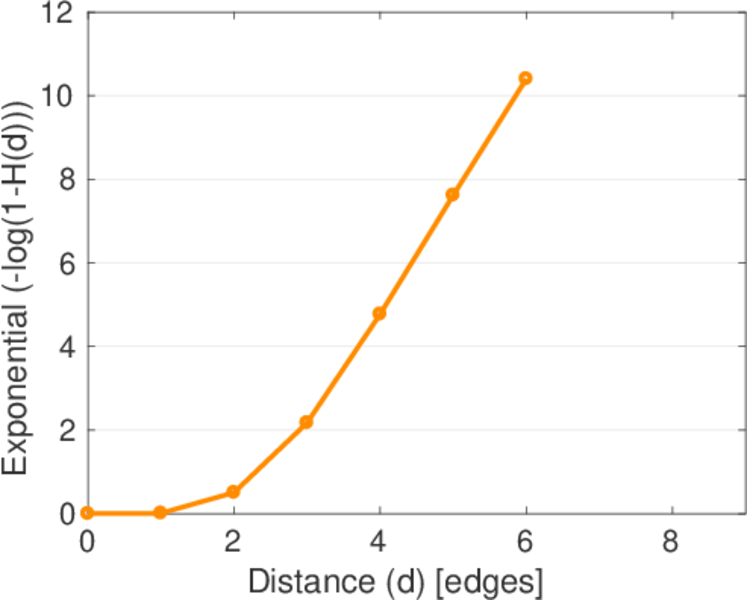
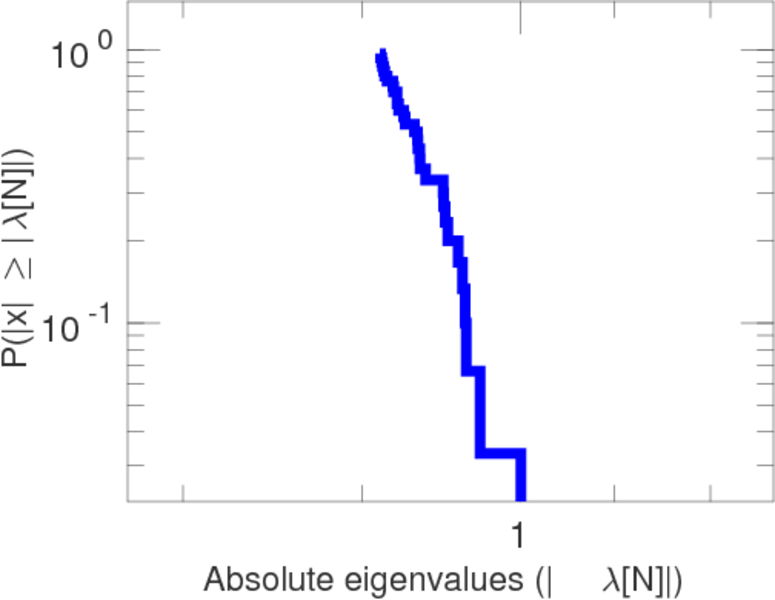
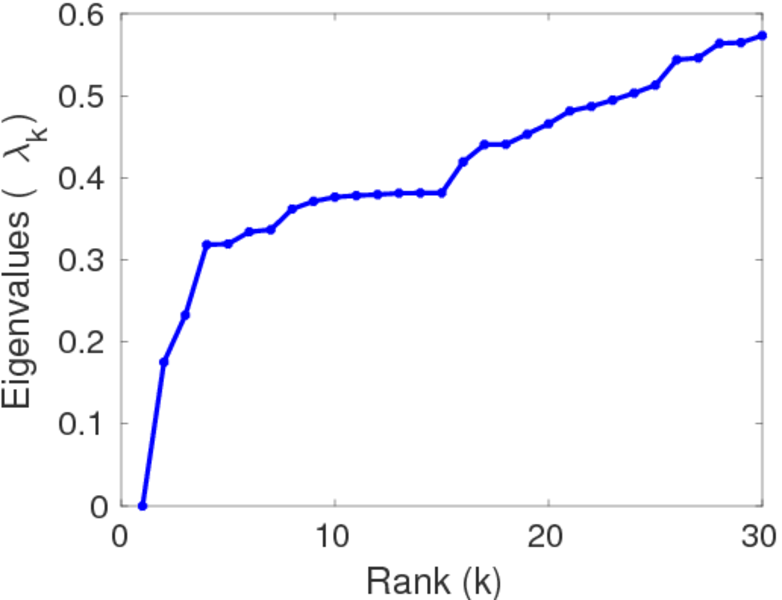
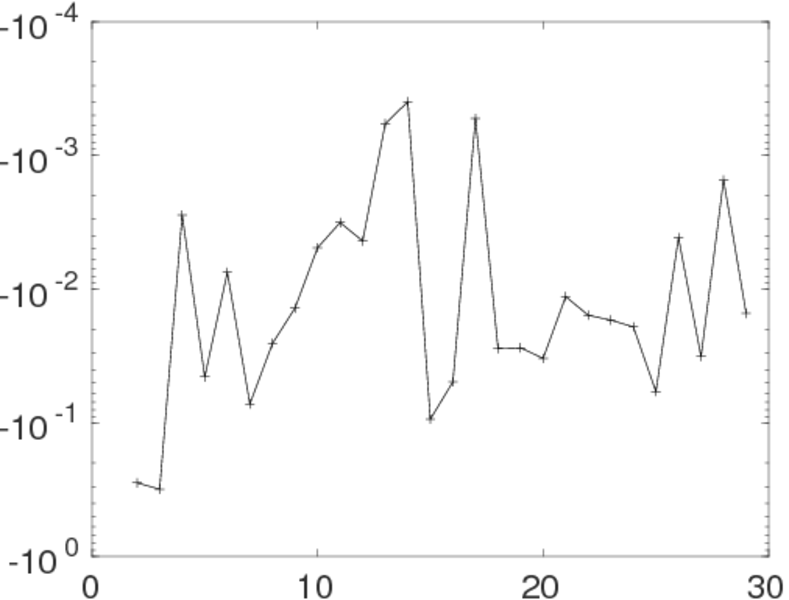
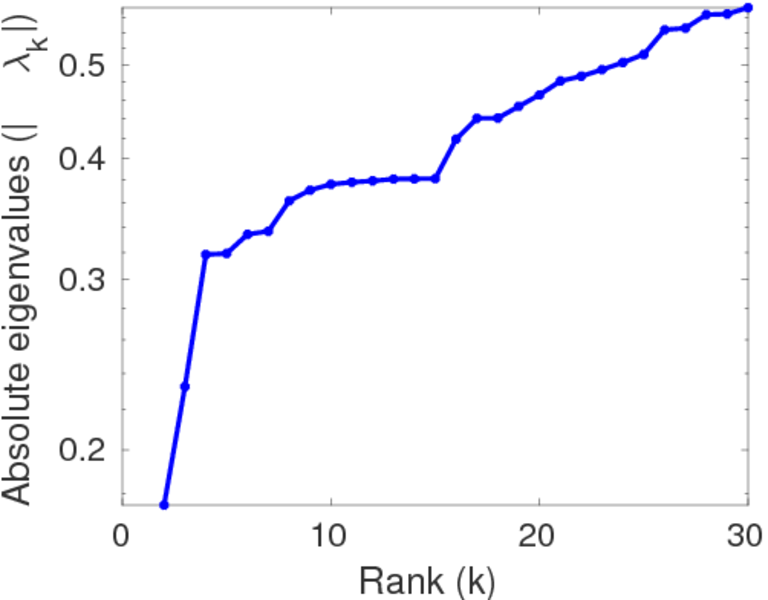
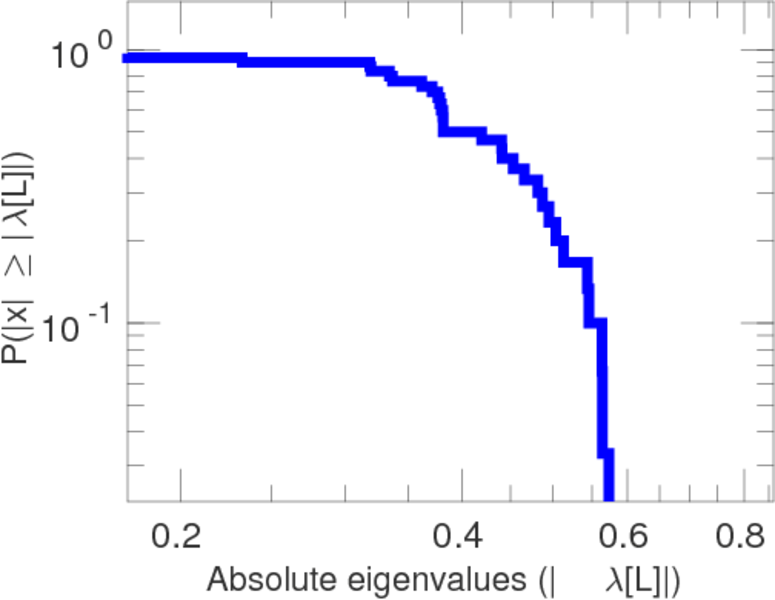
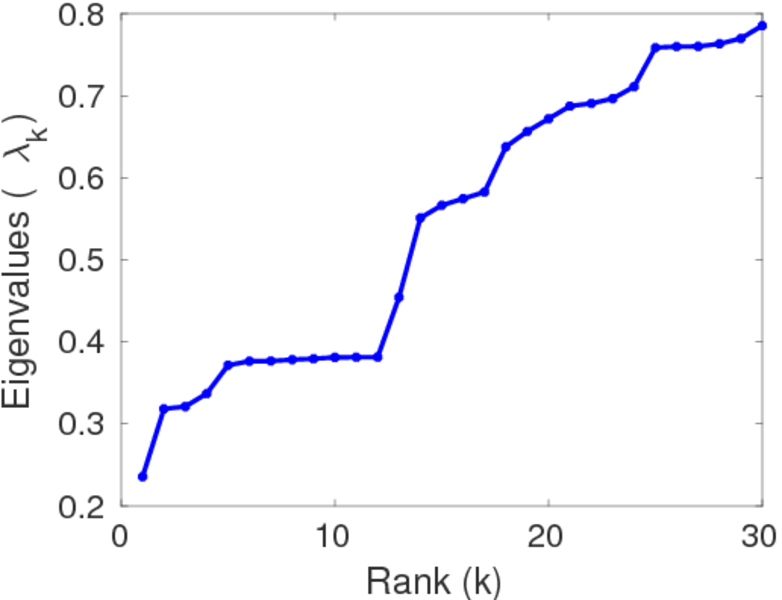
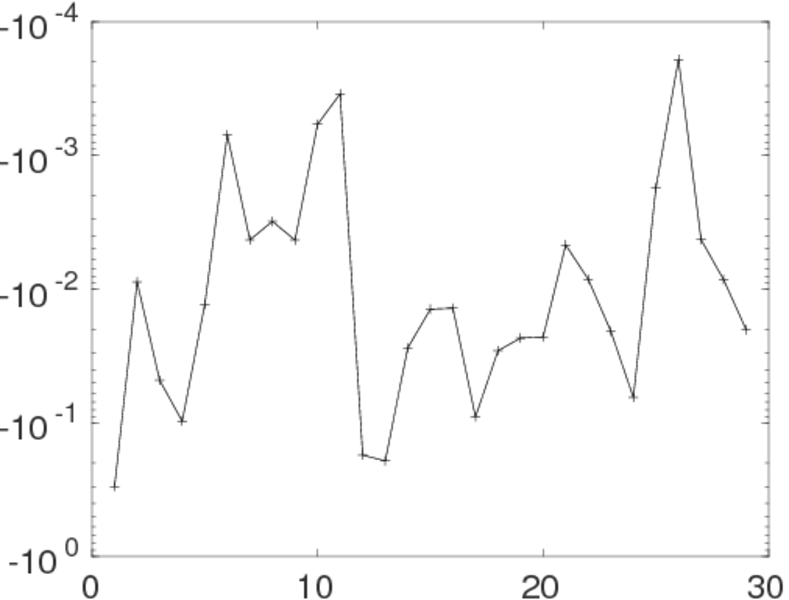
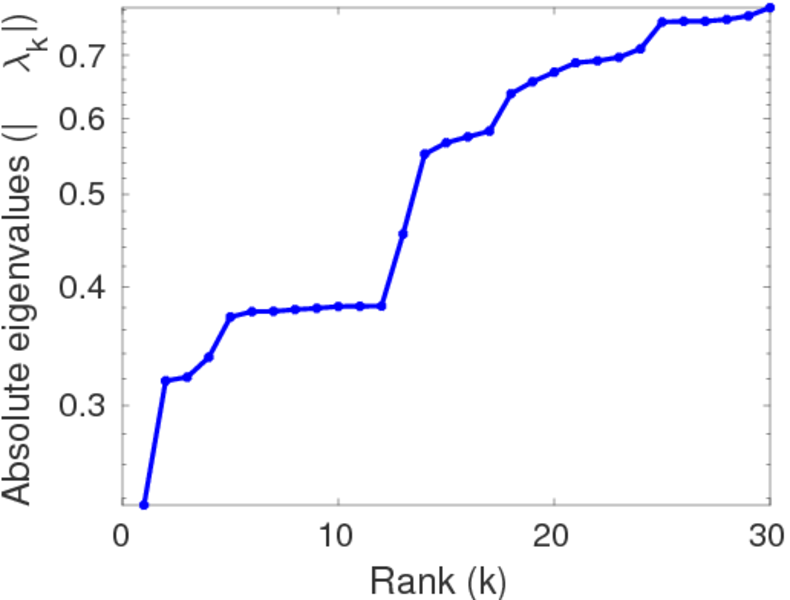
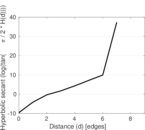
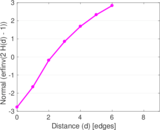
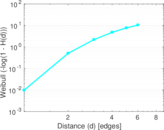
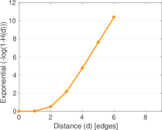
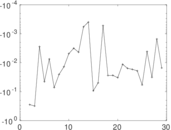
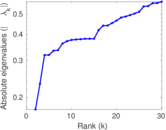
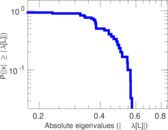
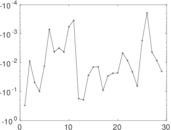
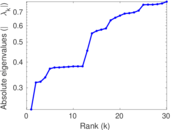
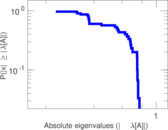
Plots


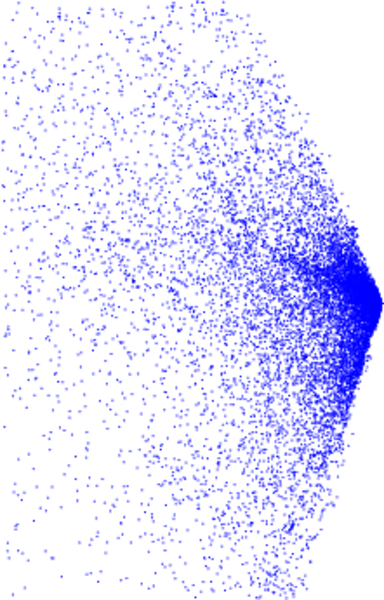
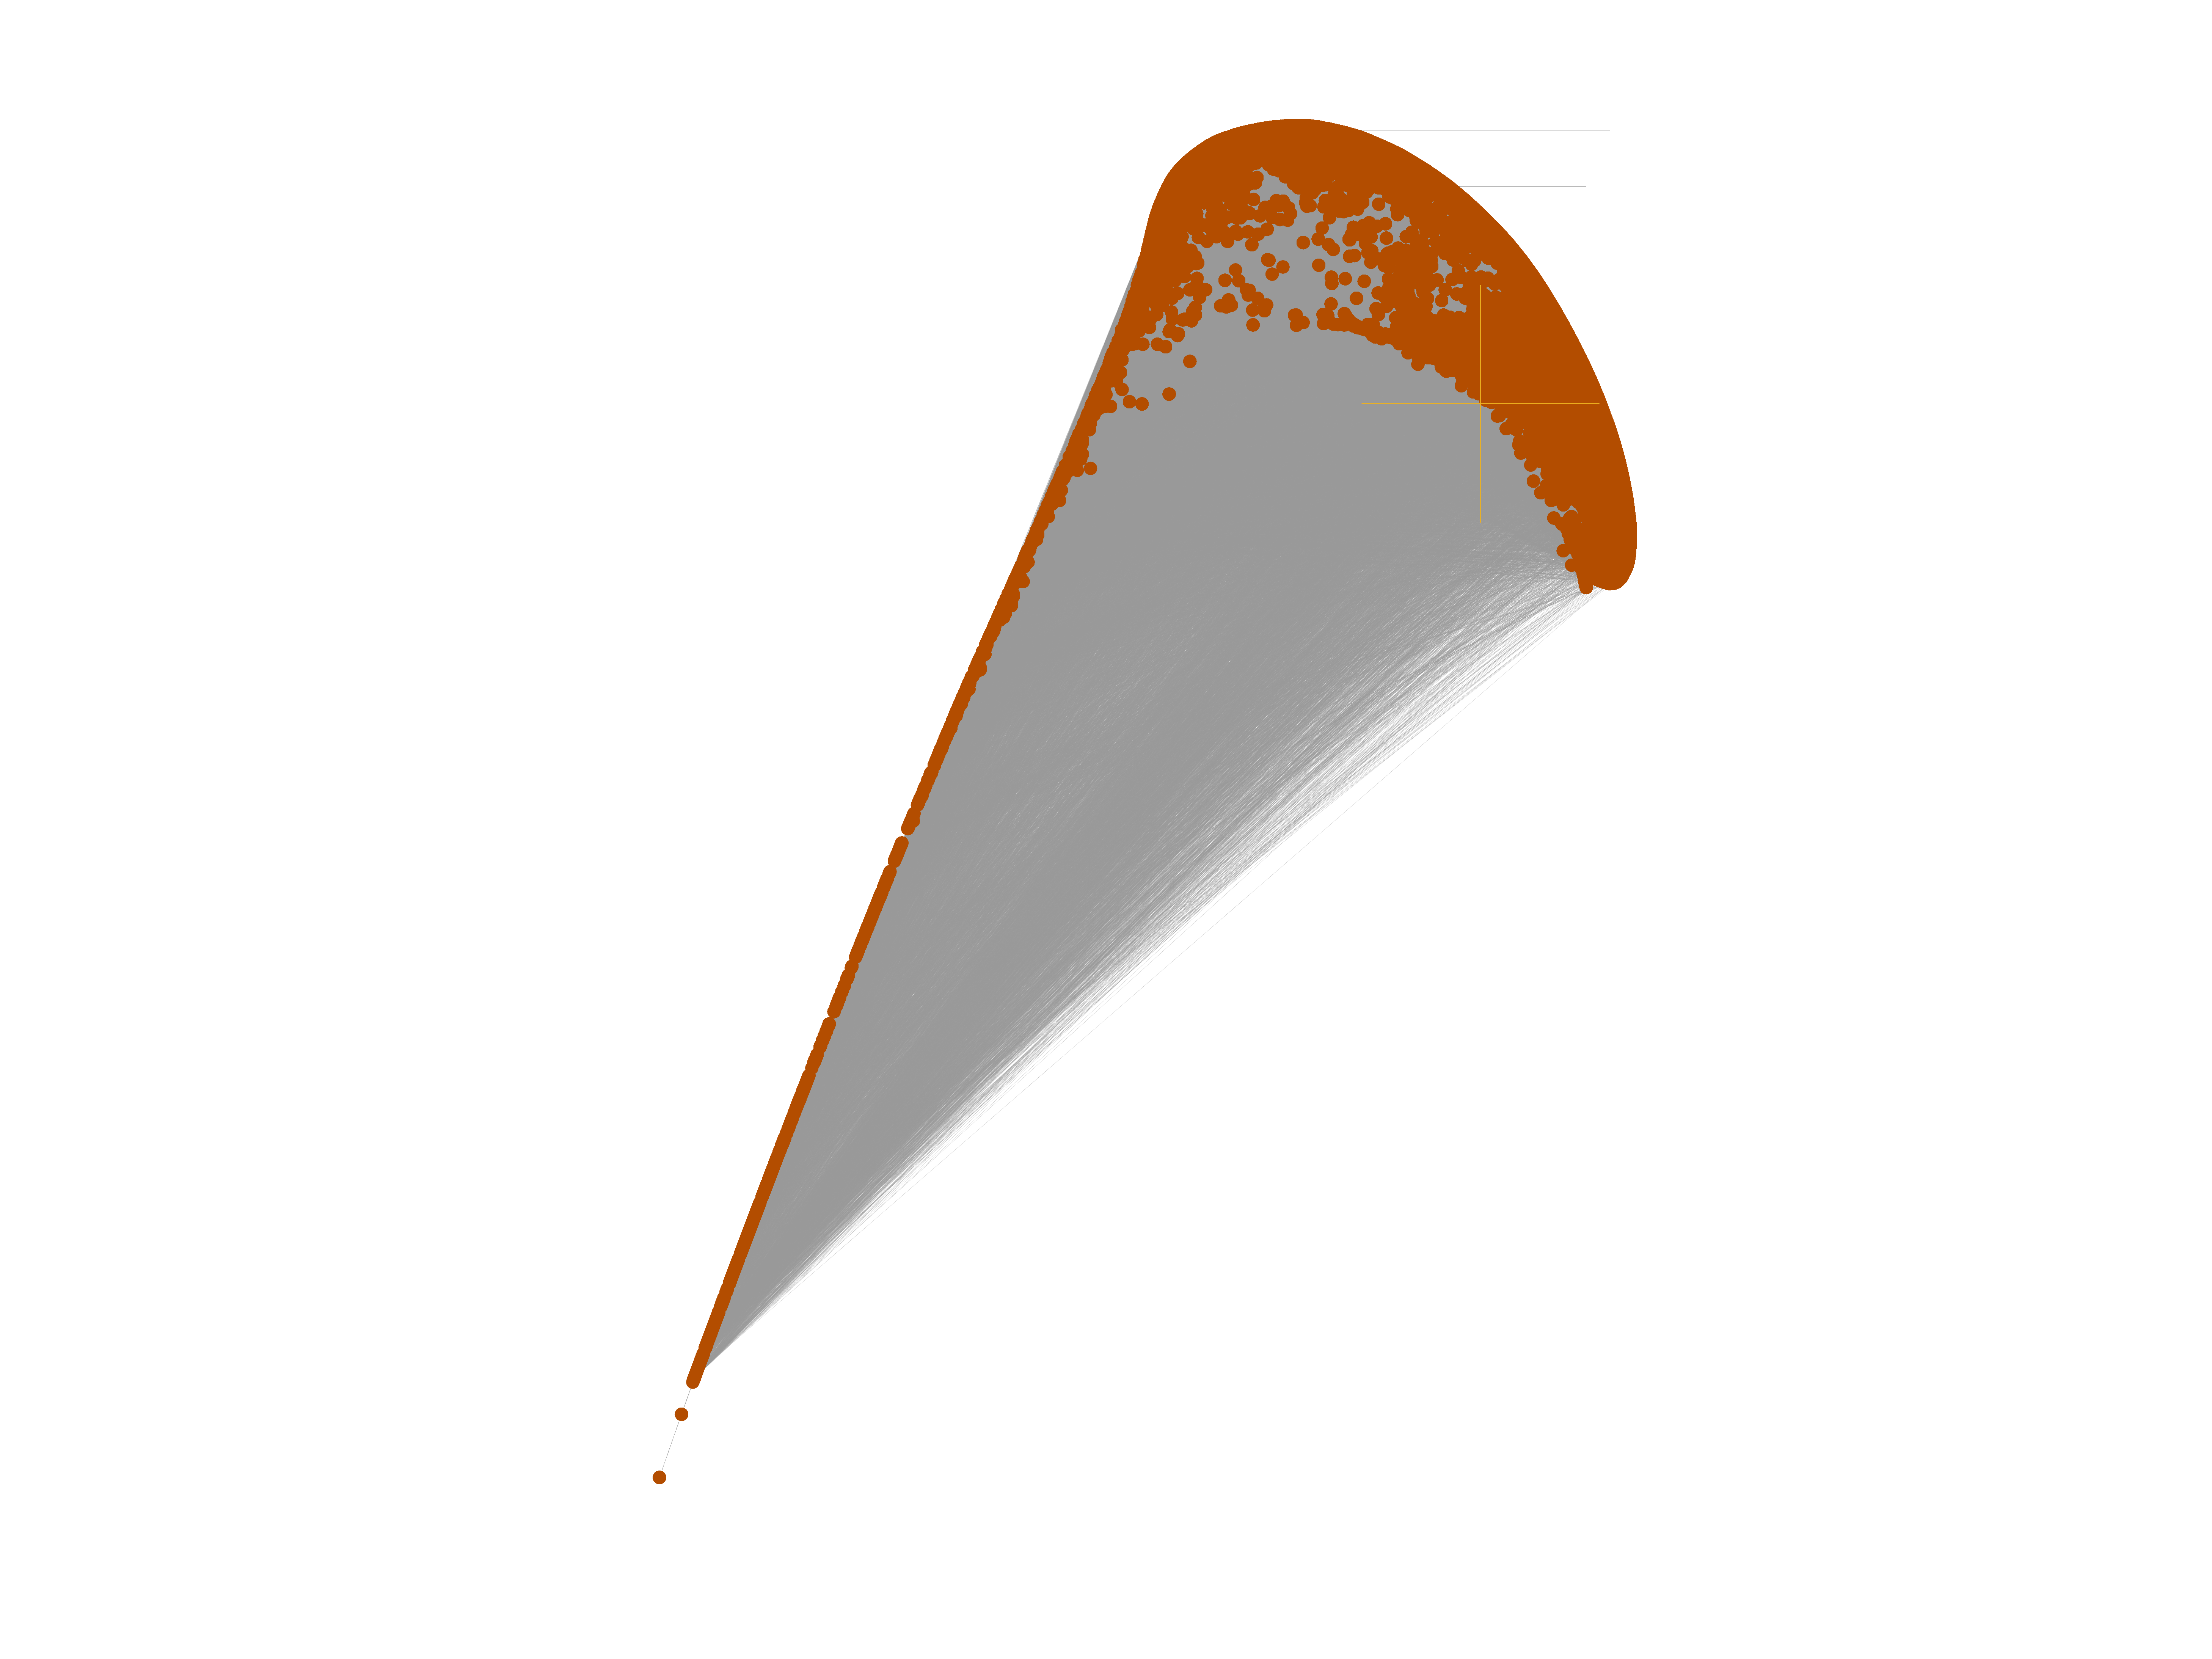
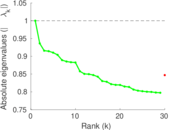
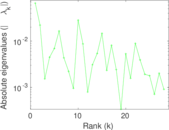
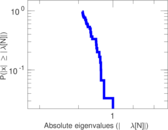
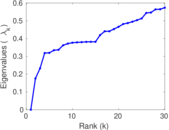
Matrix decompositions plots


Downloads
References
|
[1]
|
Jérôme Kunegis.
KONECT – The Koblenz Network Collection.
In Proc. Int. Conf. on World Wide Web Companion, pages
1343–1350, 2013.
[ http ]
|
|
[2]
|
Jure Leskovec, Jon Kleinberg, and Christos Faloutsos.
Graph evolution: Densification and shrinking diameters.
ACM Trans. Knowl. Discov. from Data, 1(1):1–40, 2007.
|
 KONECT ‣ Networks ‣
Buy Me a Coffee
KONECT ‣ Networks ‣
Buy Me a Coffee