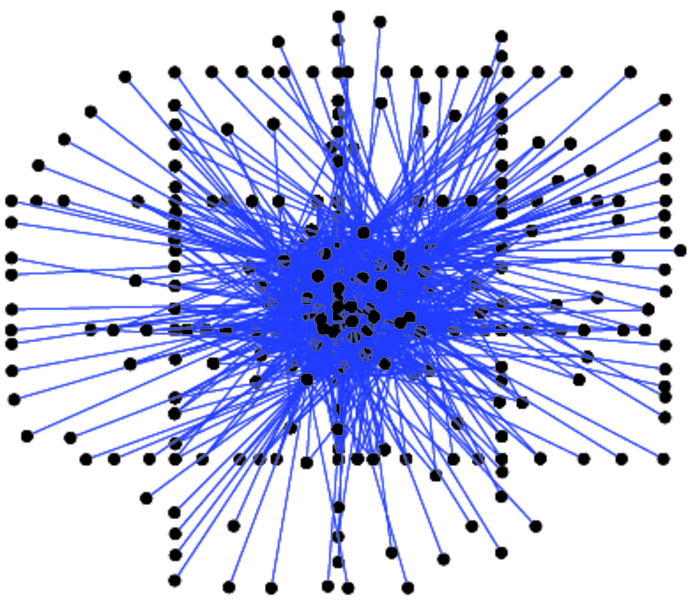
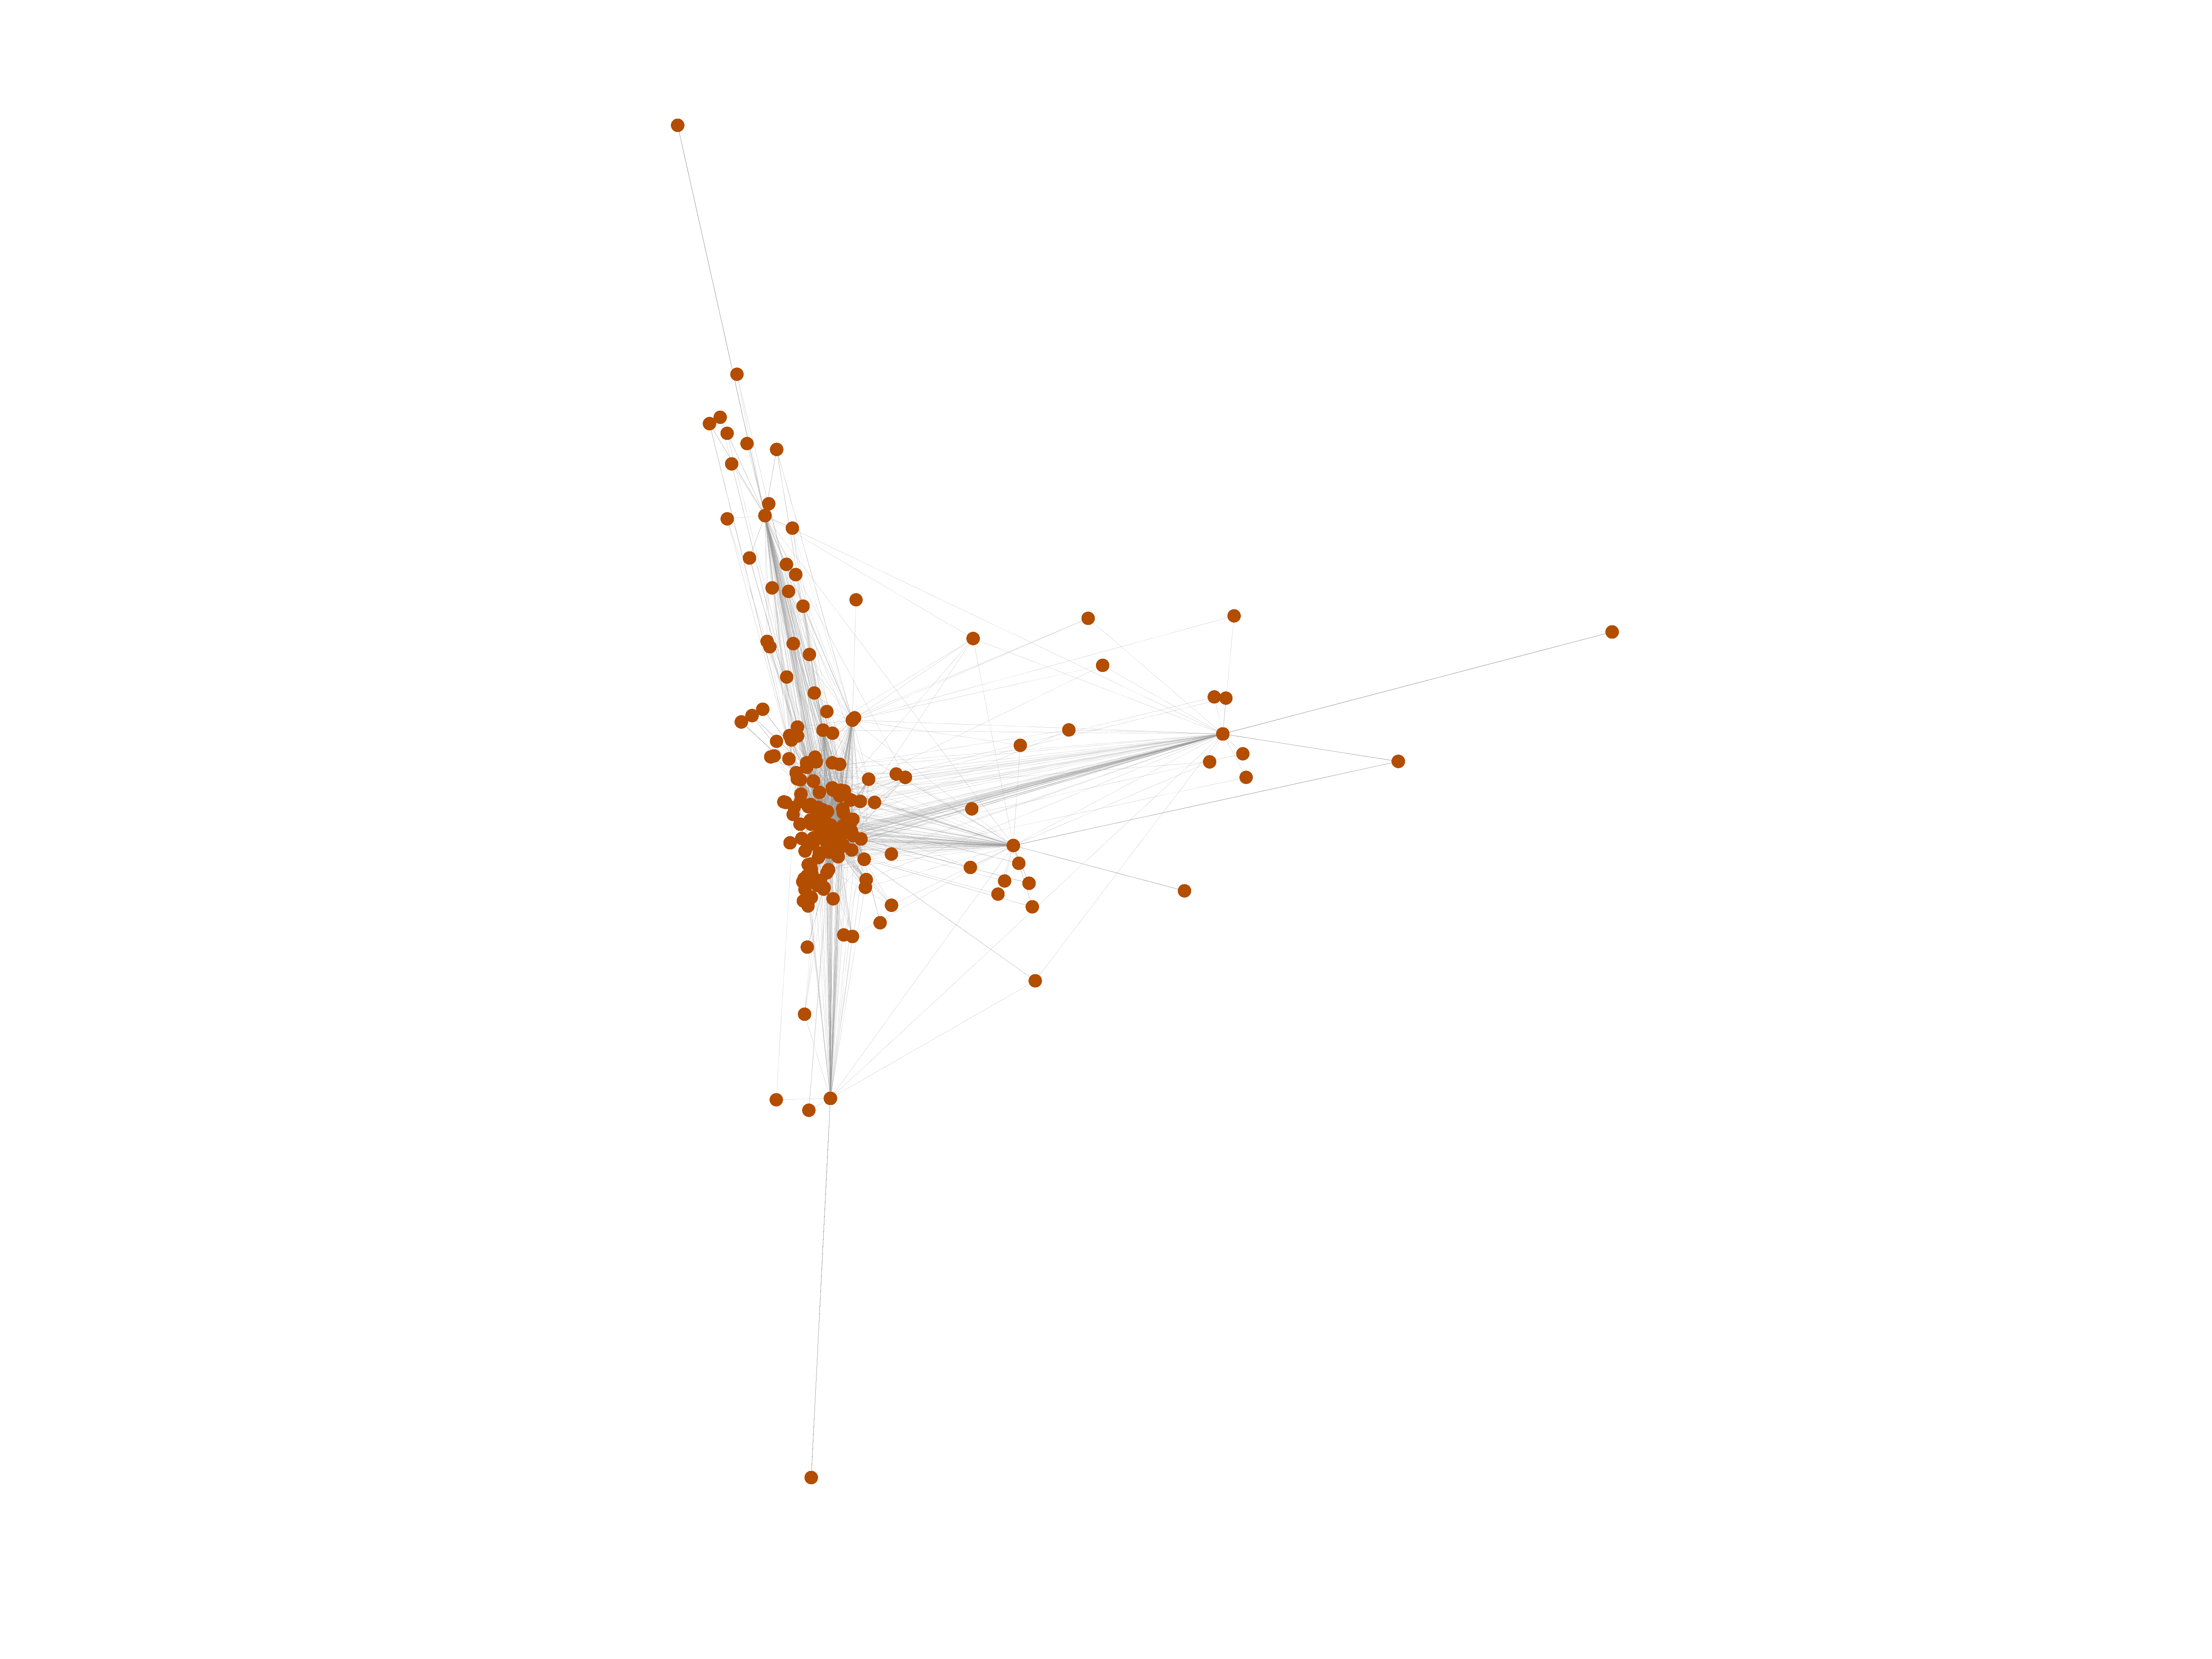
Haggle
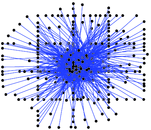
This undirected network represents contacts between people measured by carried
wireless devices. A node represents a person; an edge between two persons shows
that there was a contact between them.
Metadata
Statistics
| Size | n = | 274
|
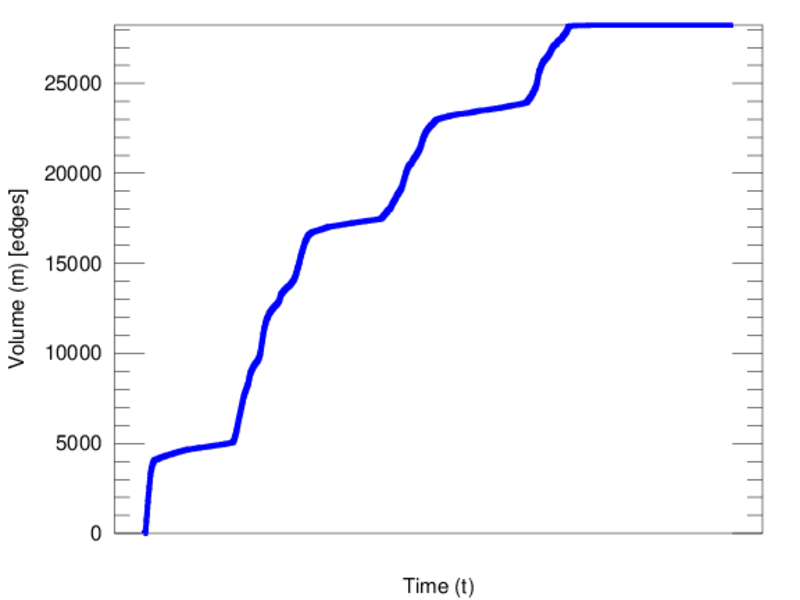
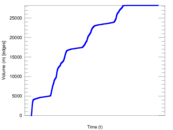
| Volume | m = | 28,244
|
| Unique edge count | m̿ = | 2,899
|
| Loop count | l = | 0
|
| Wedge count | s = | 118,281
|
| Claw count | z = | 9,250,623
|
| Cross count | x = | 255,553,498
|
| Triangle count | t = | 22,332
|
| Square count | q = | 848,067
|
| 4-Tour count | T4 = | 7,261,908
|
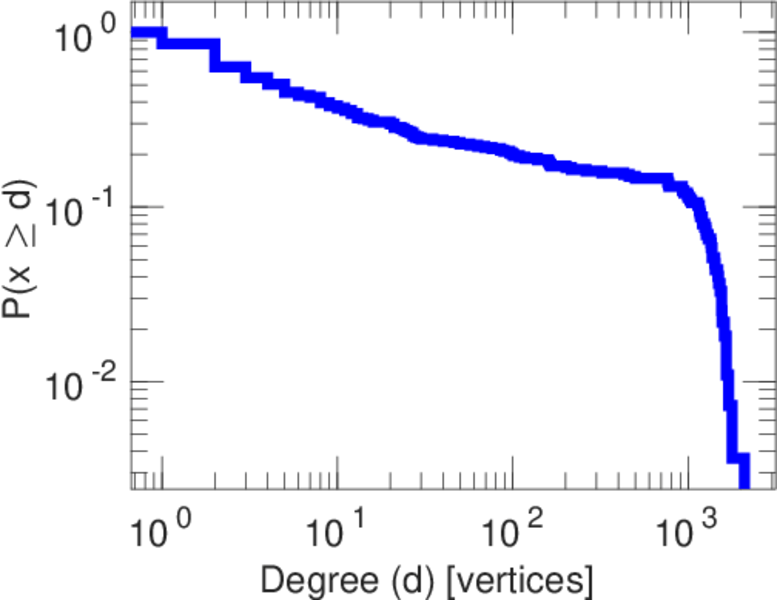
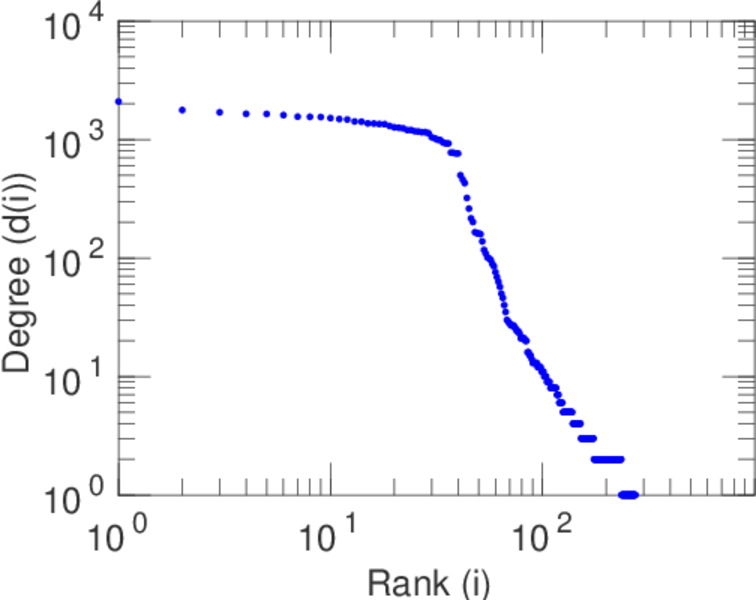
| Maximum degree | dmax = | 2,092
|
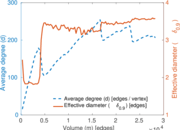
| Average degree | d = | 206.161
|
| Fill | p = | 0.077 511 3
|
| Average edge multiplicity | m̃ = | 9.742 67
|
| Size of LCC | N = | 274
|
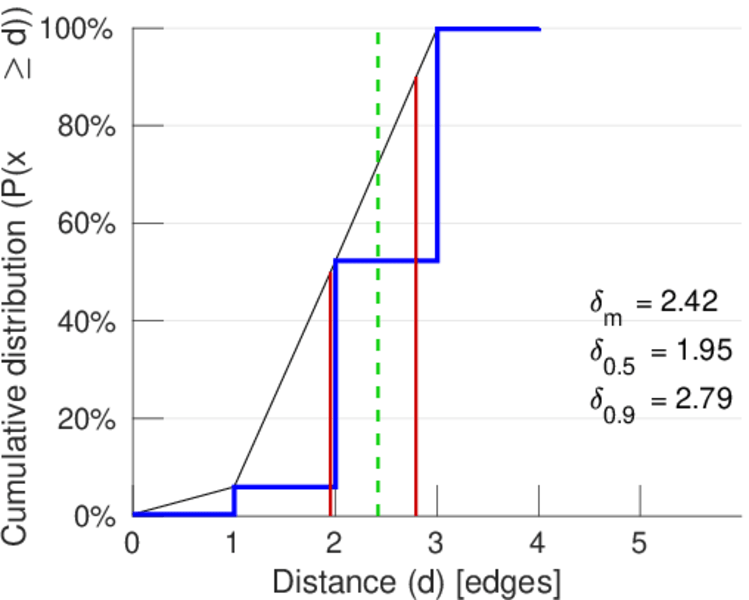
| Diameter | δ = | 4
|
| 50-Percentile effective diameter | δ0.5 = | 1.949 57
|
| 90-Percentile effective diameter | δ0.9 = | 2.792 77
|
| Median distance | δM = | 2
|
| Mean distance | δm = | 2.415 27
|
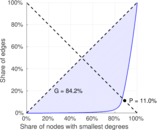
| Gini coefficient | G = | 0.841 739
|
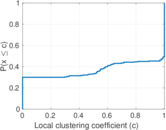
| Balanced inequality ratio | P = | 0.110 360
|
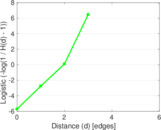
| Relative edge distribution entropy | Her = | 0.794 985
|
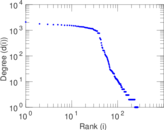
| Power law exponent | γ = | 1.672 86
|
| Tail power law exponent | γt = | 1.501 00
|
| Tail power law exponent with p | γ3 = | 1.501 00
|
| p-value | p = | 0.000 00
|
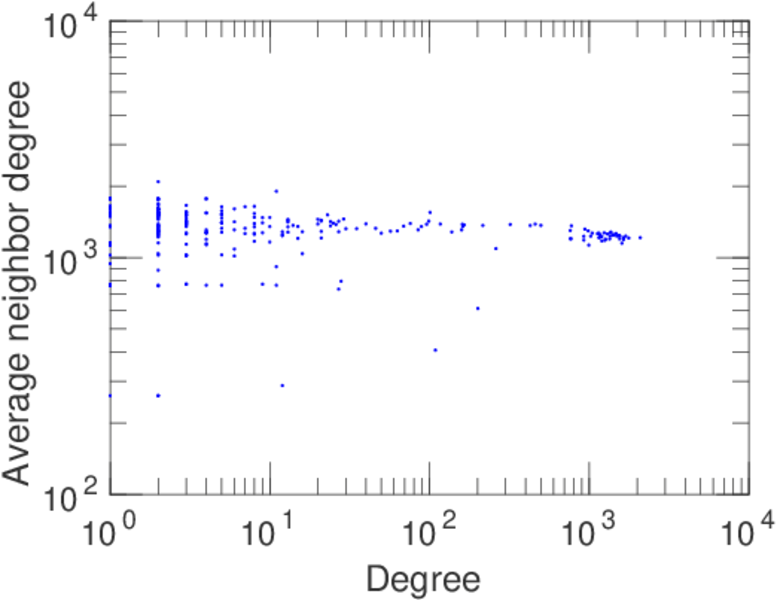
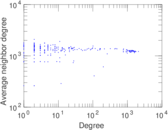
| Degree assortativity | ρ = | −0.474 322
|
| Degree assortativity p-value | pρ = | 2.635 98 × 10−237
|
| Clustering coefficient | c = | 0.566 414
|
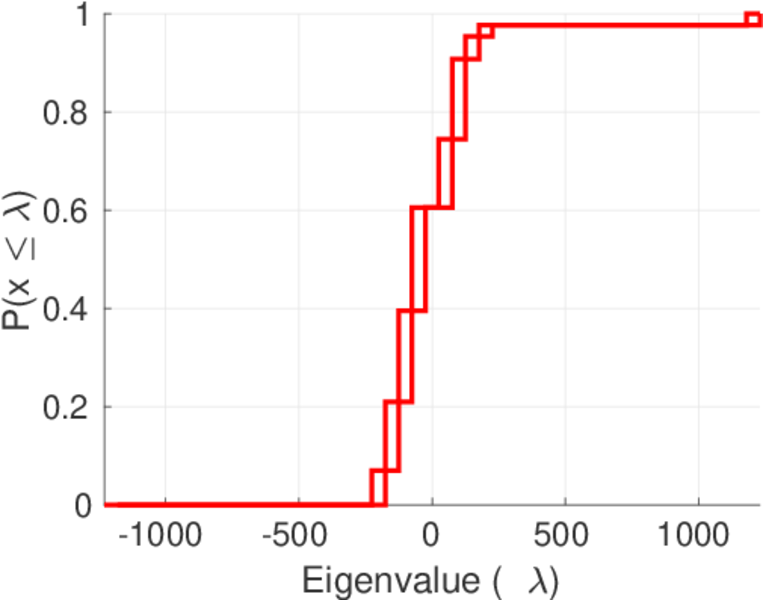
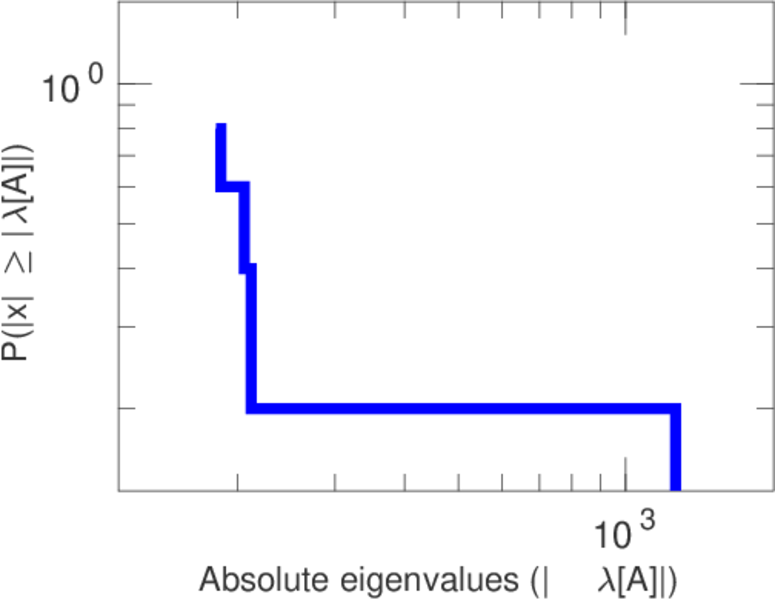
| Spectral norm | α = | 1,231.03
|
| Algebraic connectivity | a = | 0.992 336
|
| Spectral separation | |λ1[A] / λ2[A]| = | 5.811 49
|
| Non-bipartivity | bA = | 0.827 927
|
| Normalized non-bipartivity | bN = | 0.466 542
|
| Algebraic non-bipartivity | χ = | 0.827 831
|
| Spectral bipartite frustration | bK = | 0.013 349 0
|
| Controllability | C = | 192
|
| Relative controllability | Cr = | 0.700 730
|
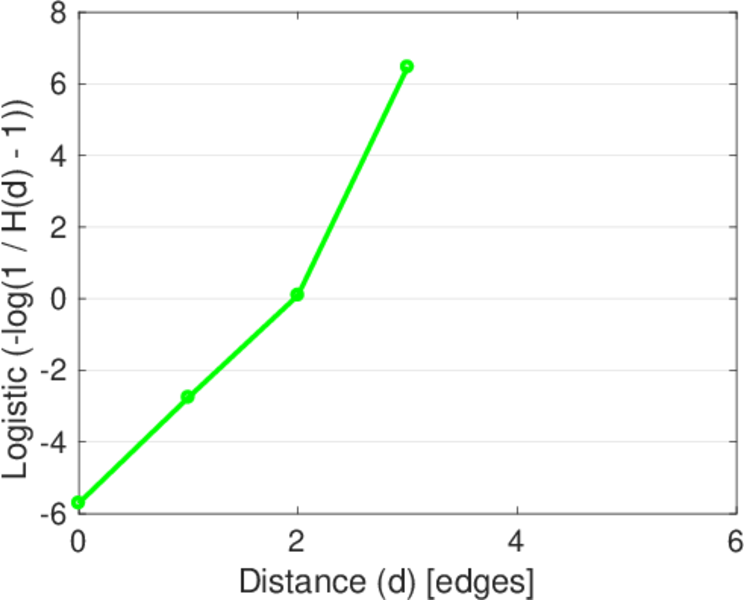
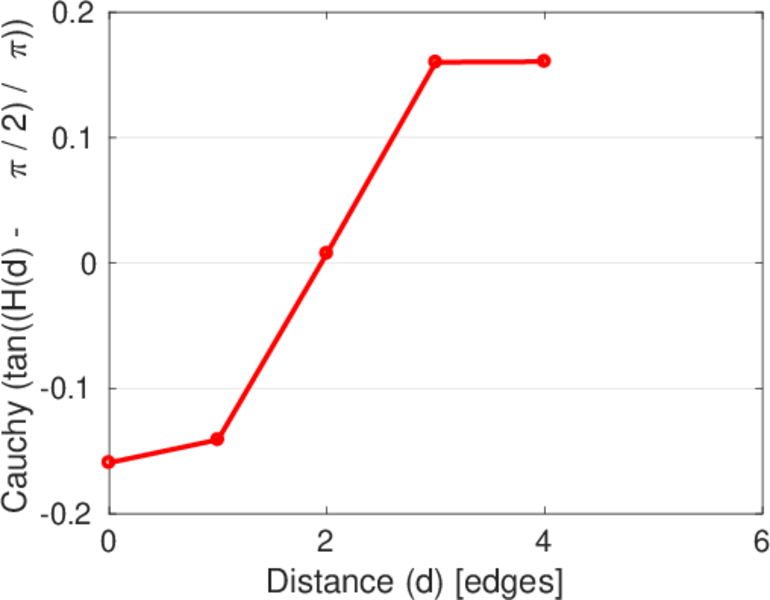
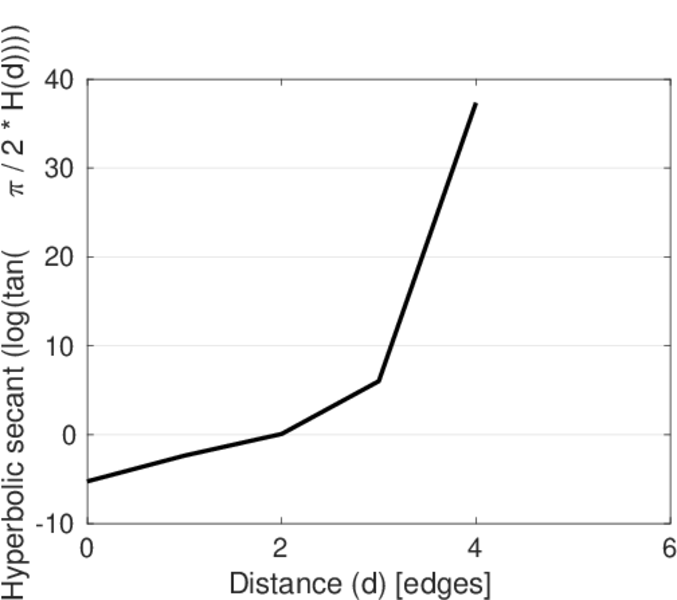
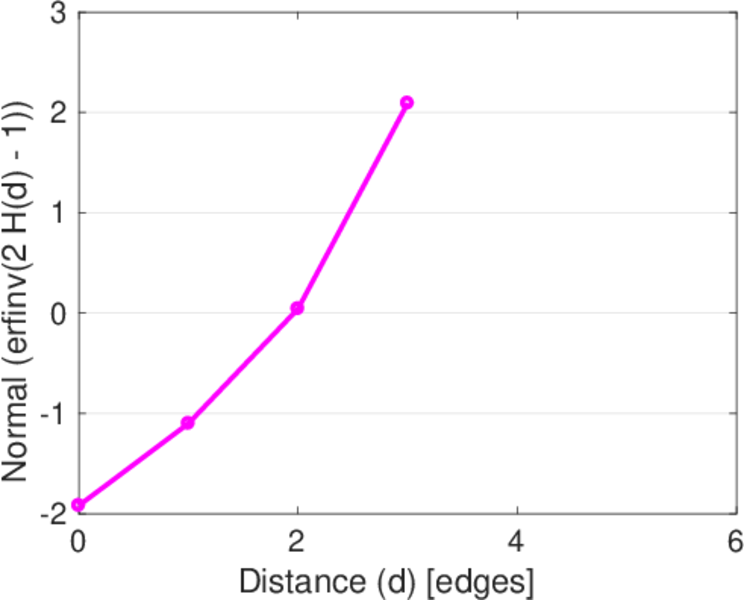
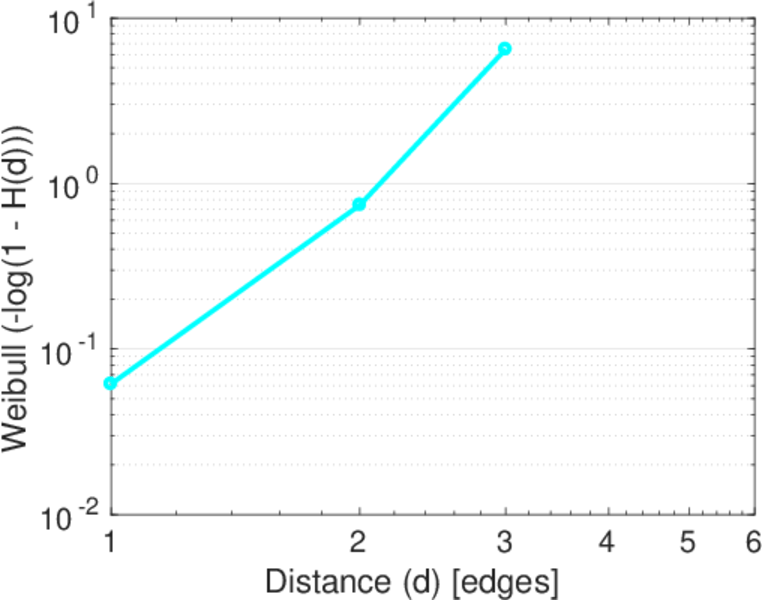
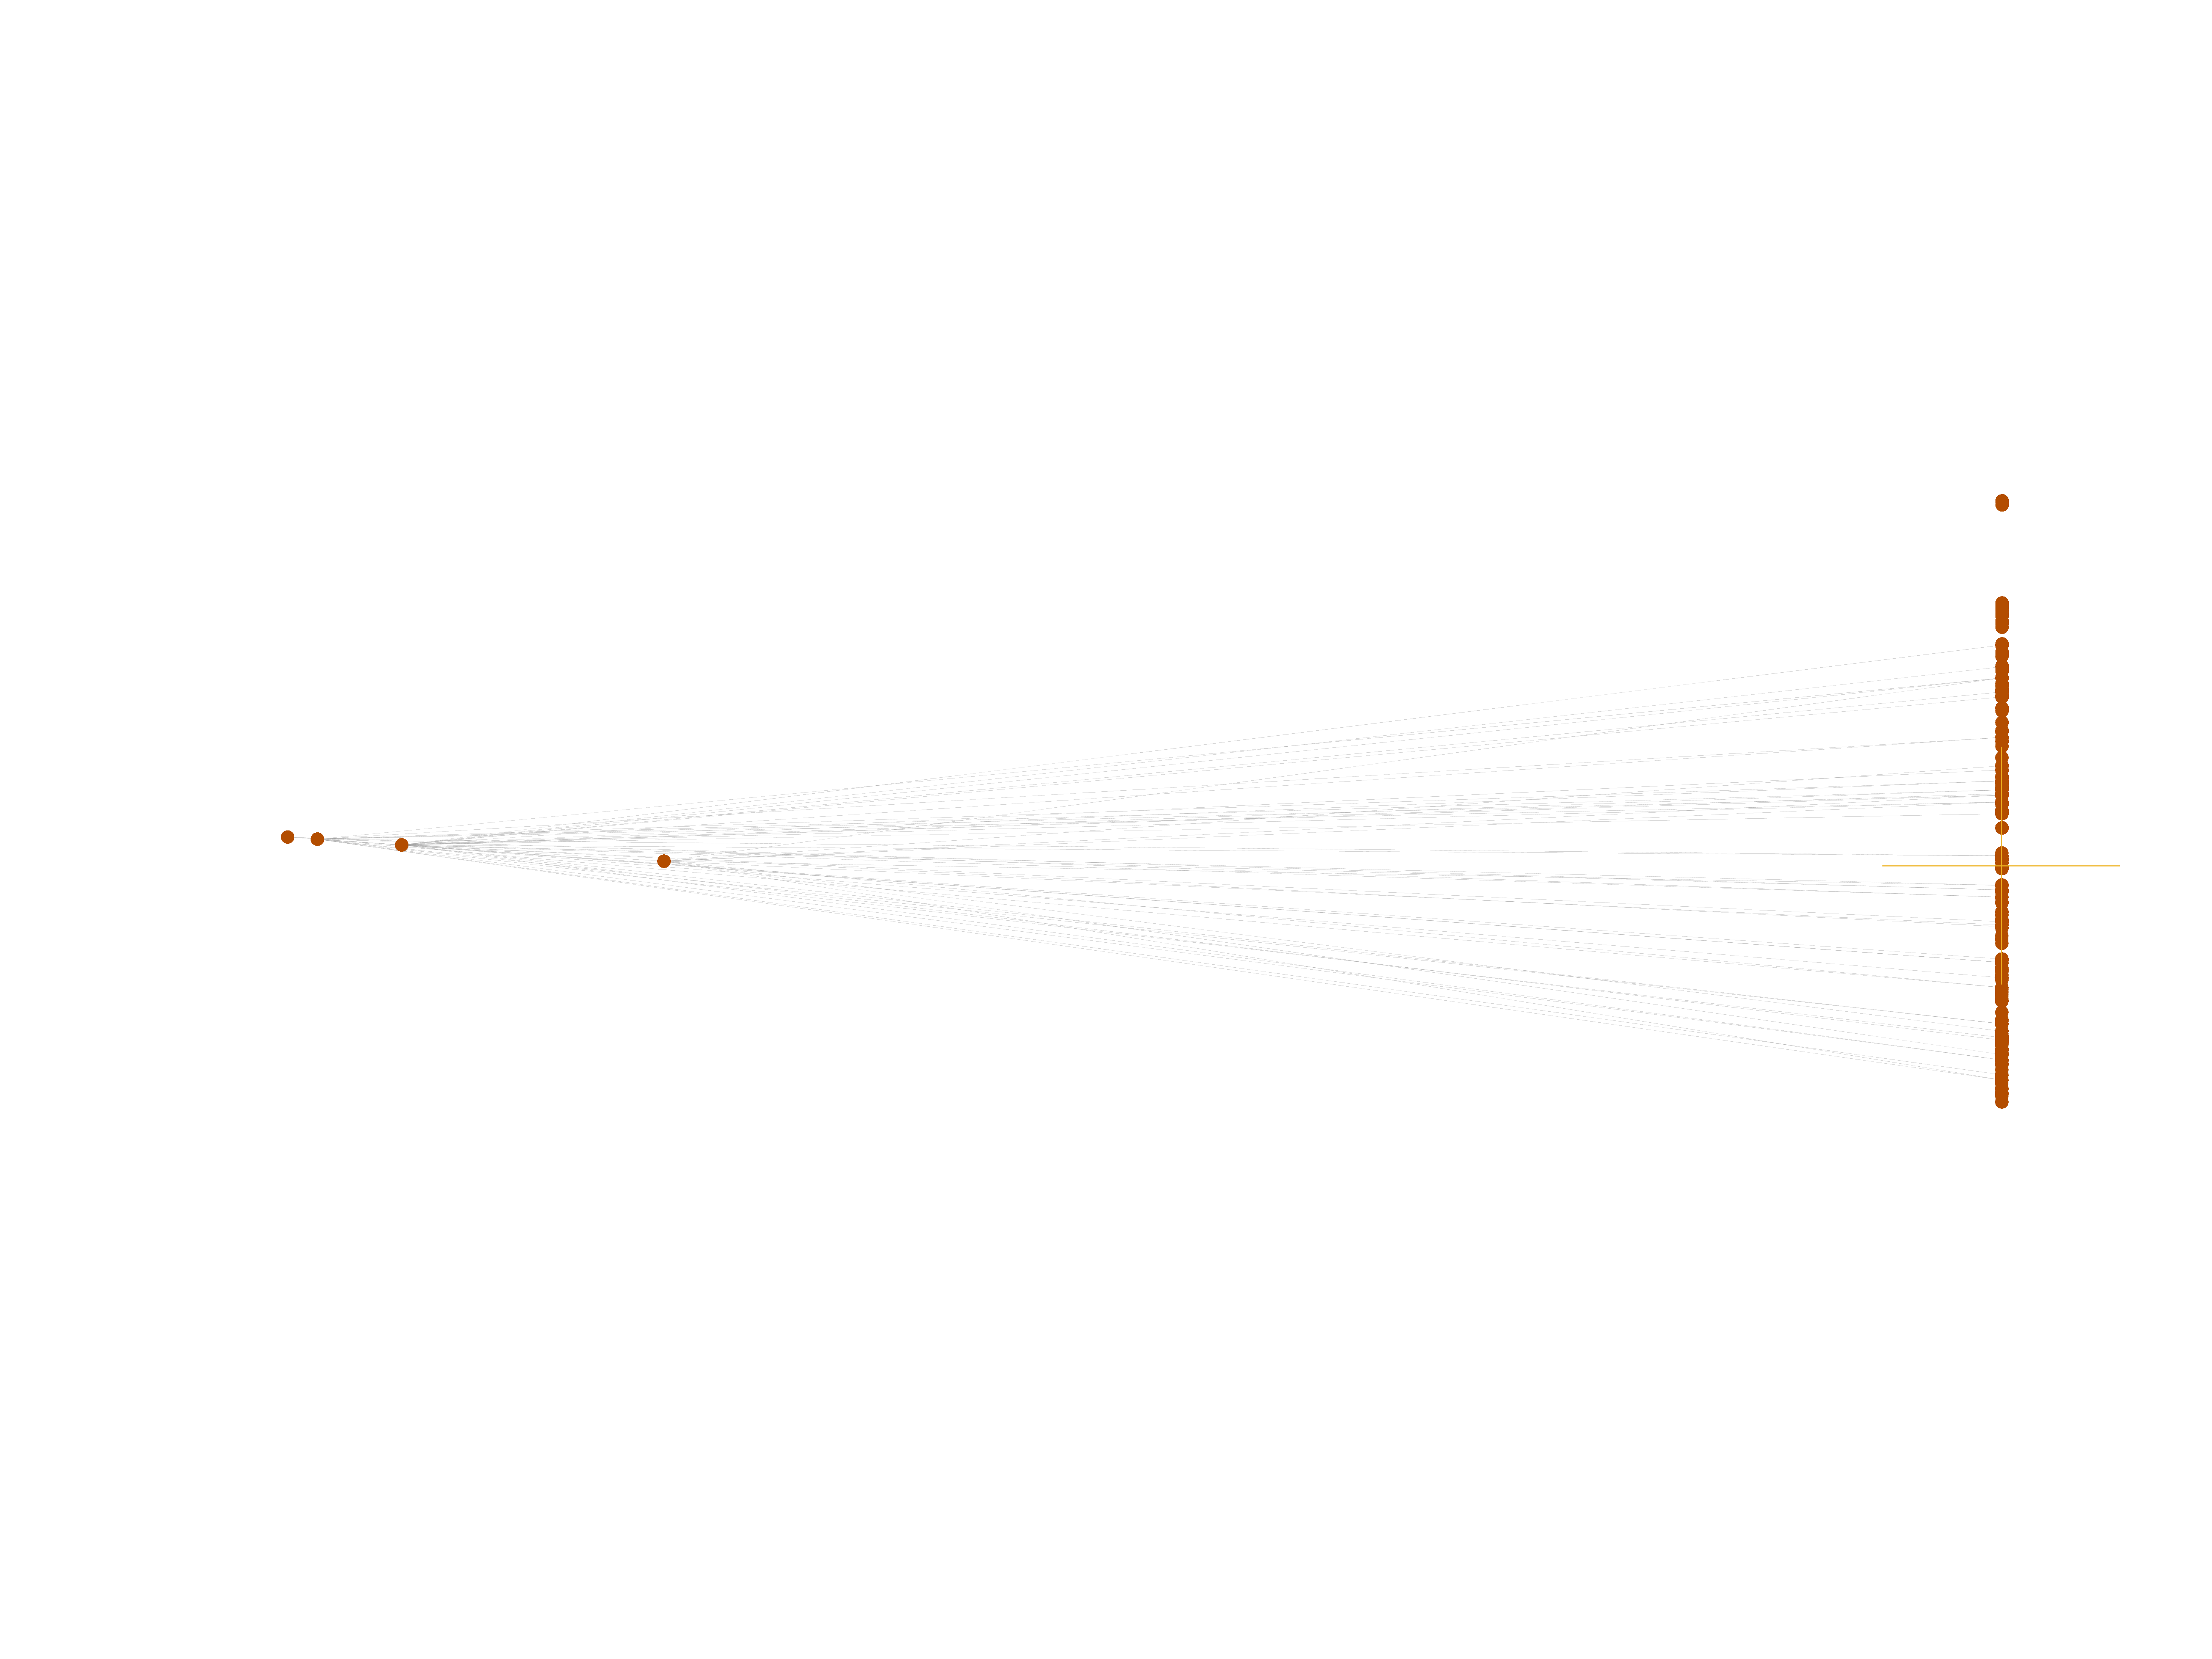
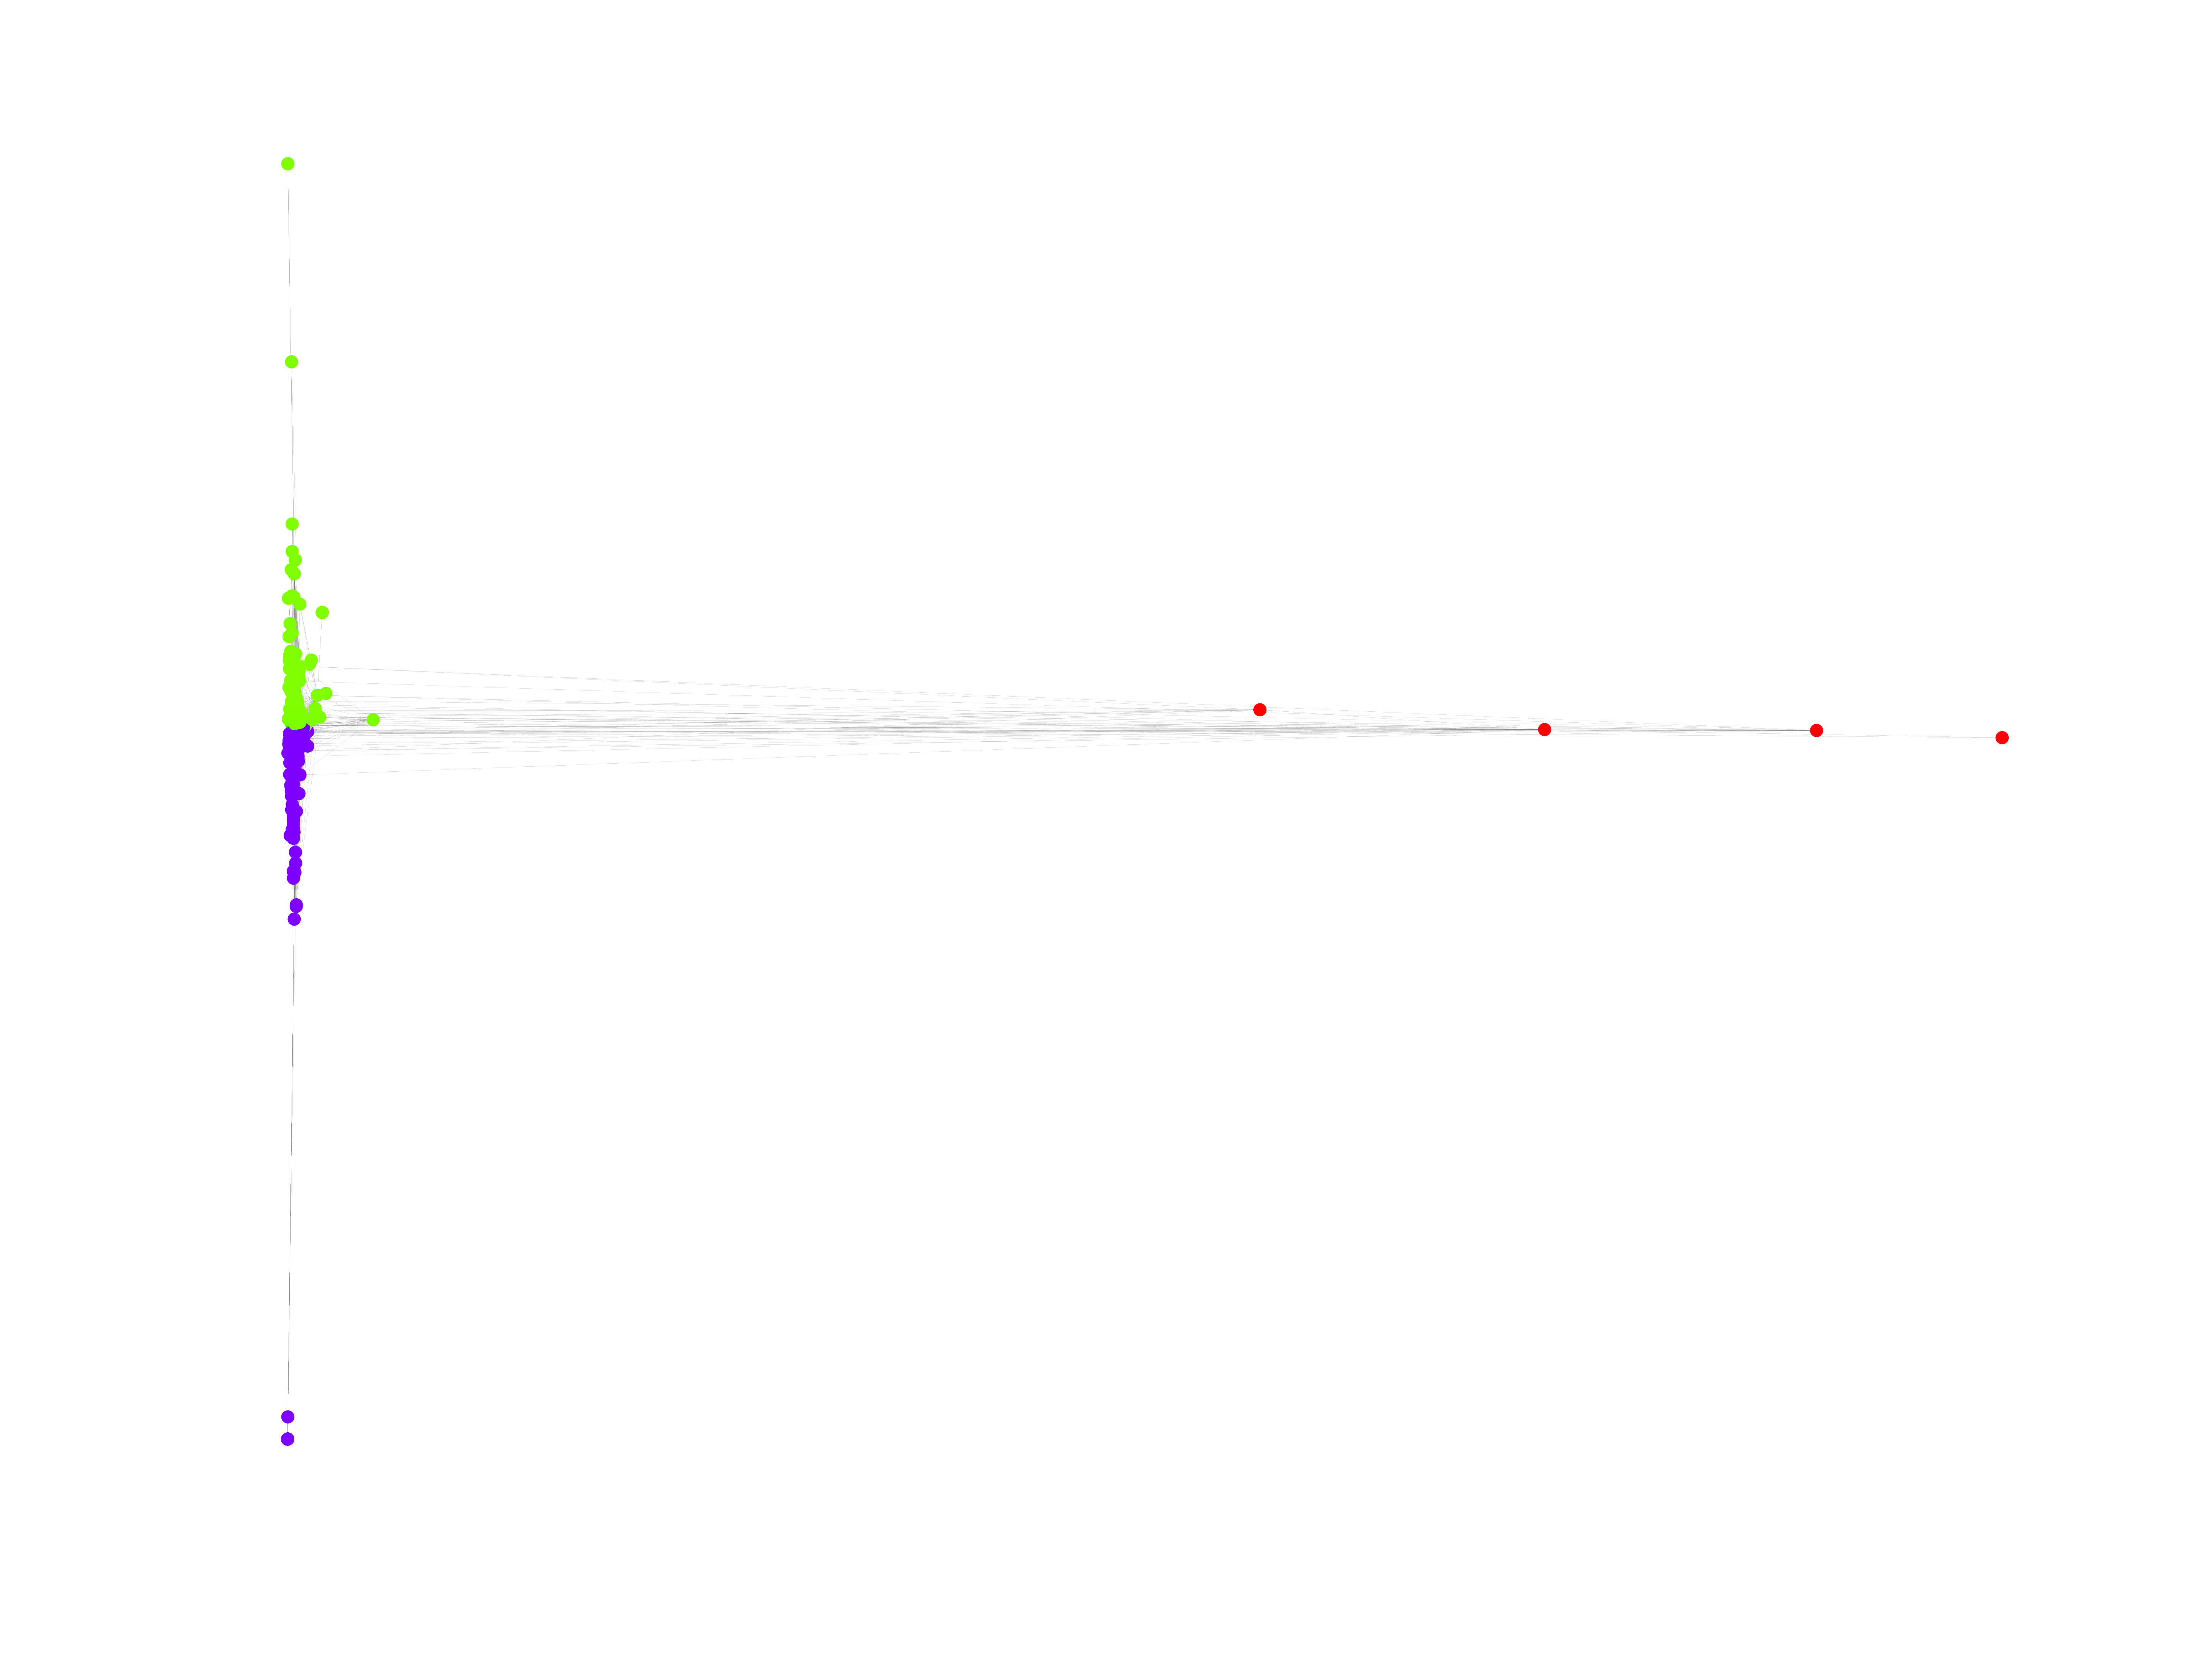
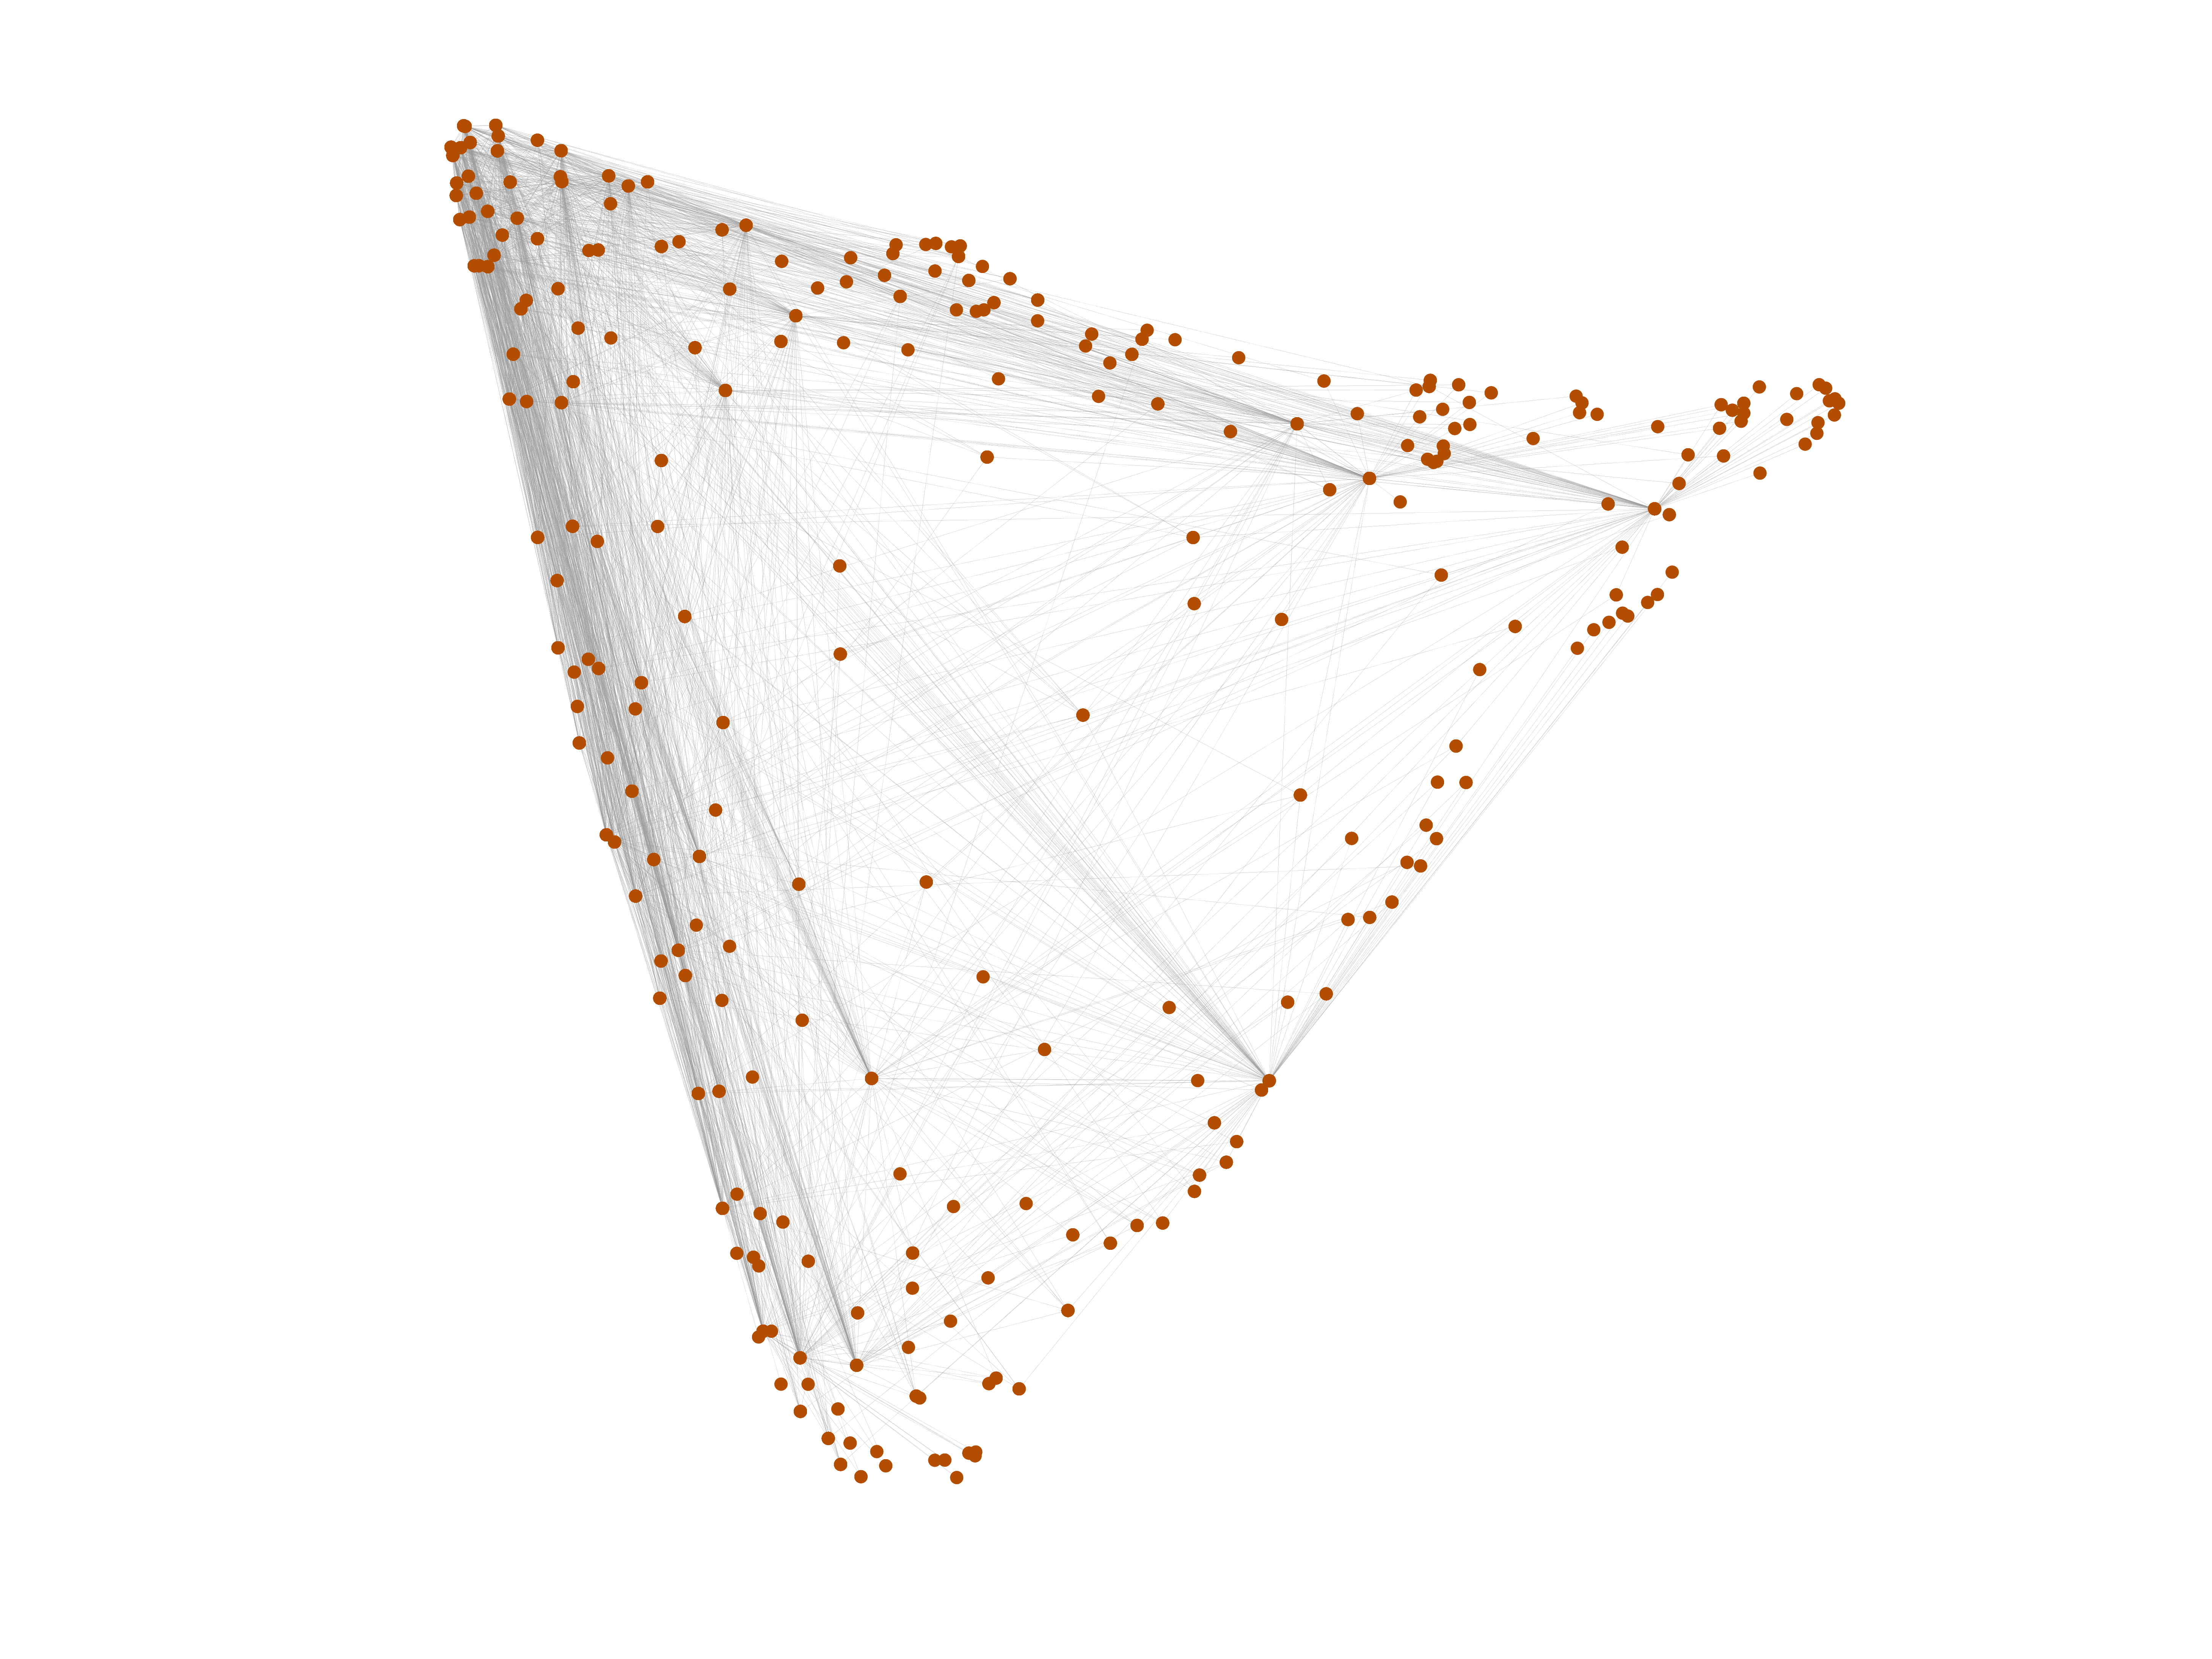
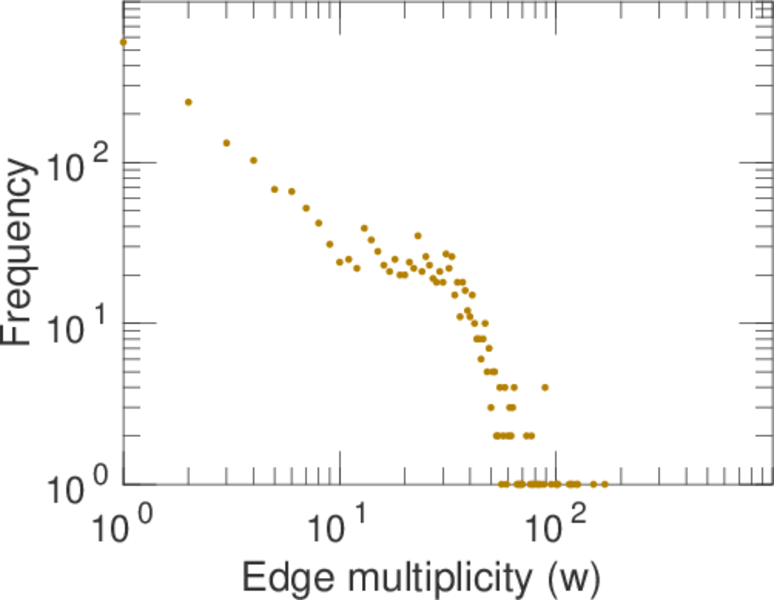
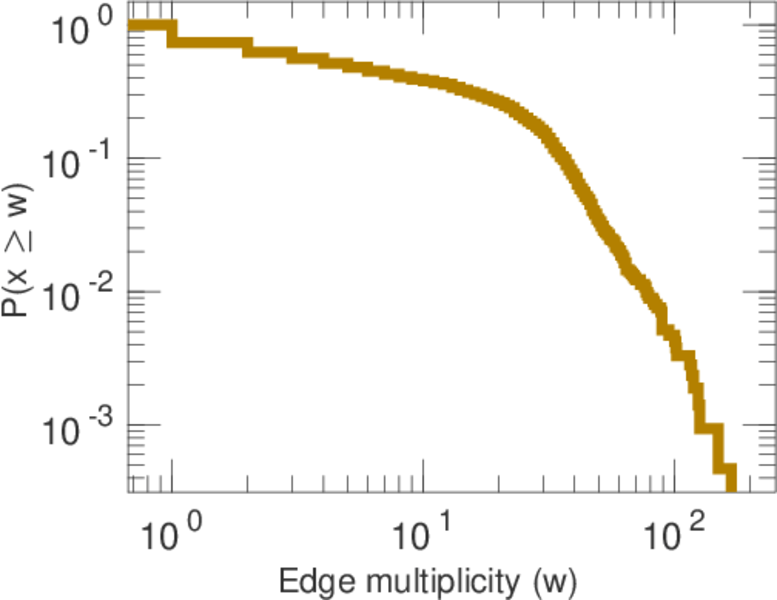
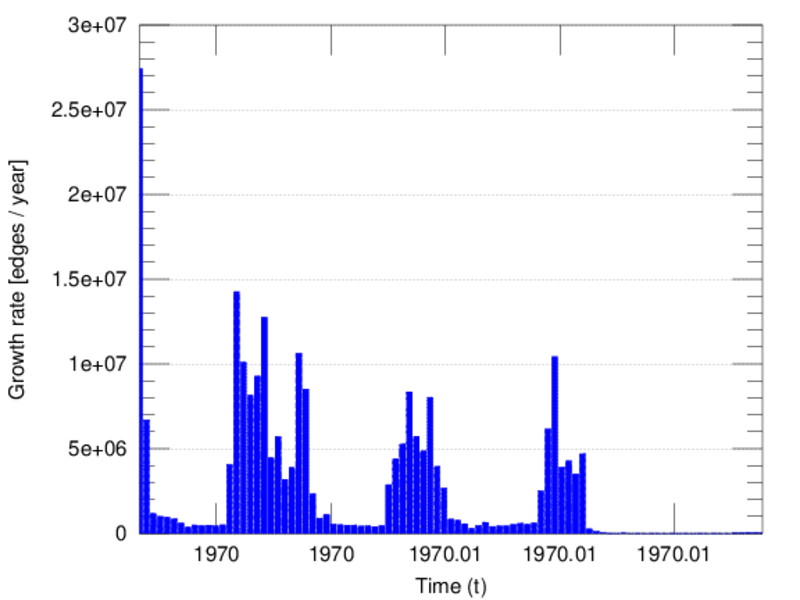
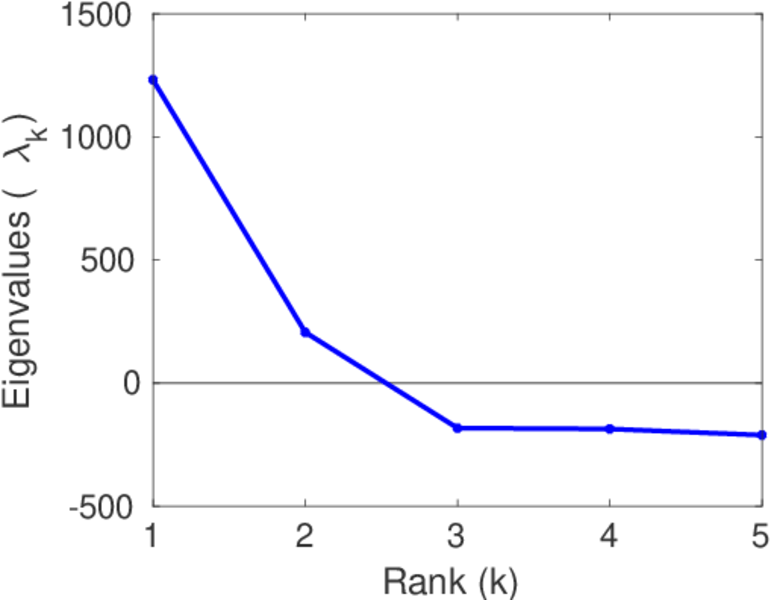
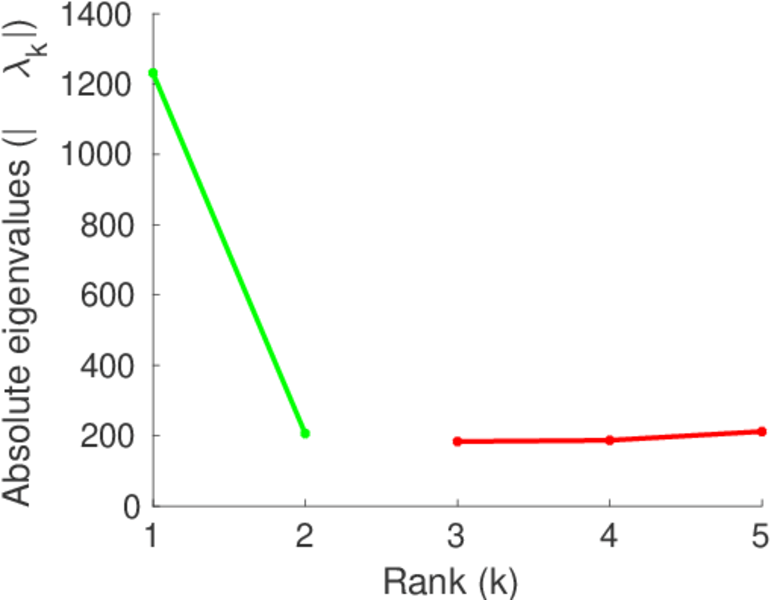
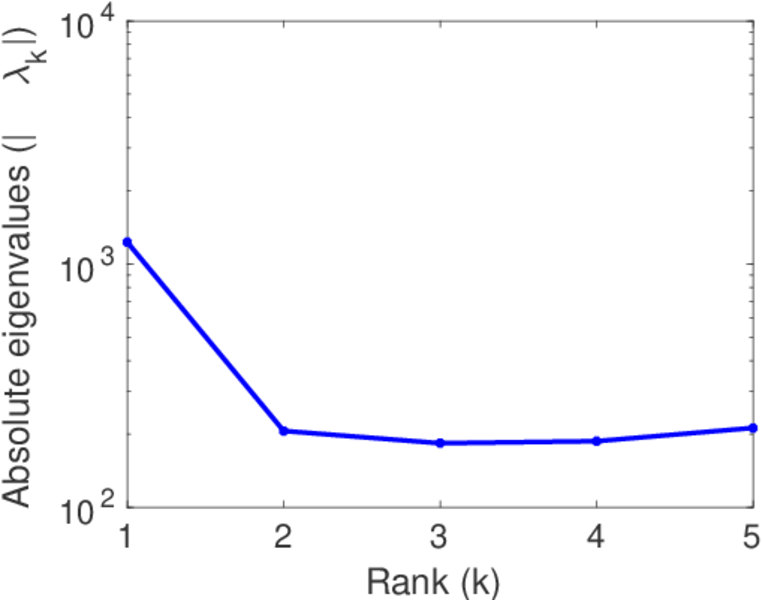
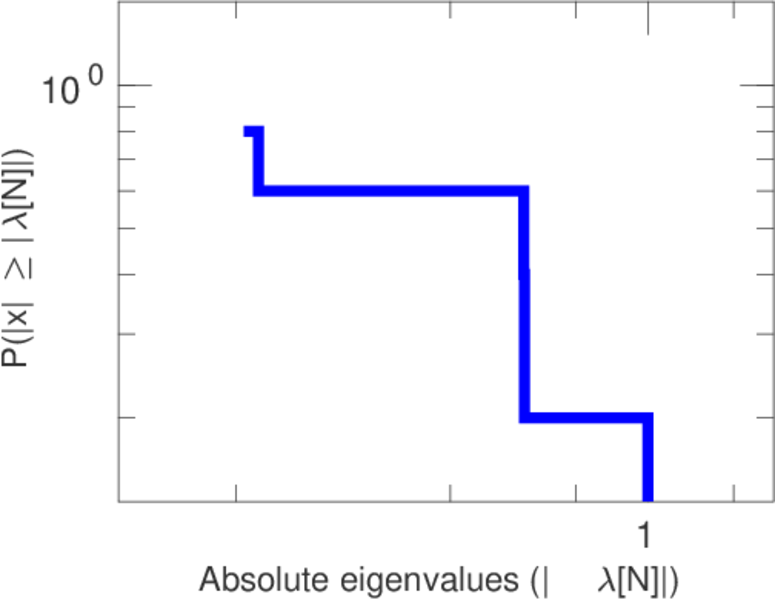
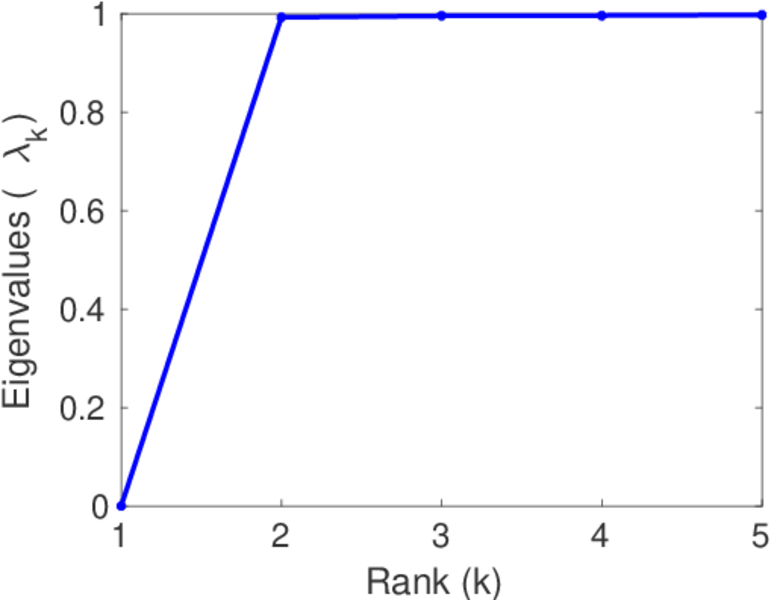
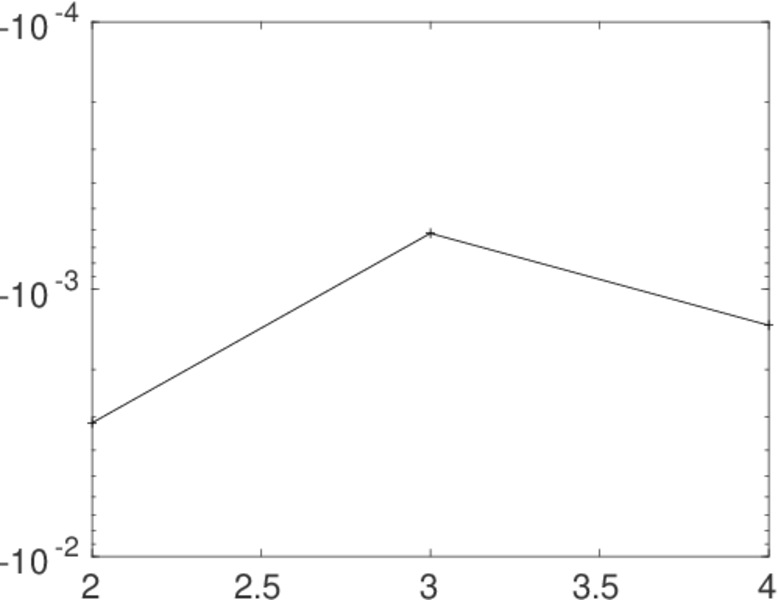
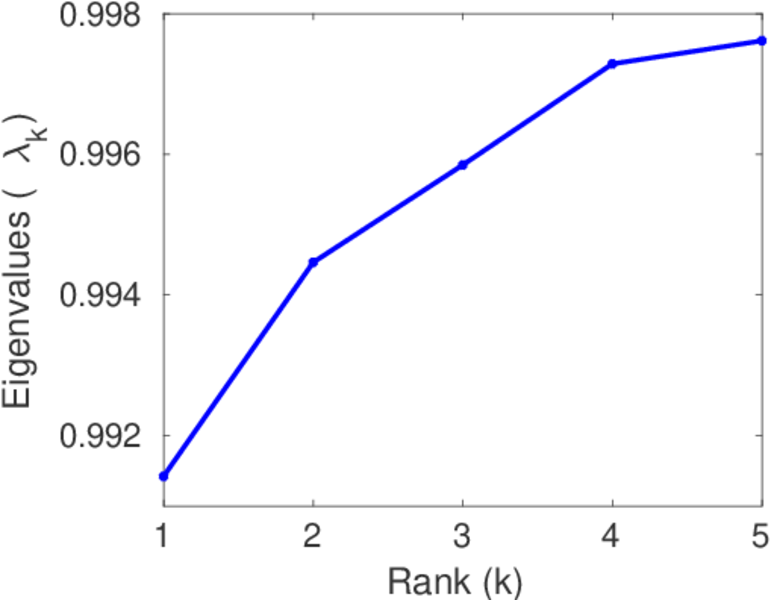
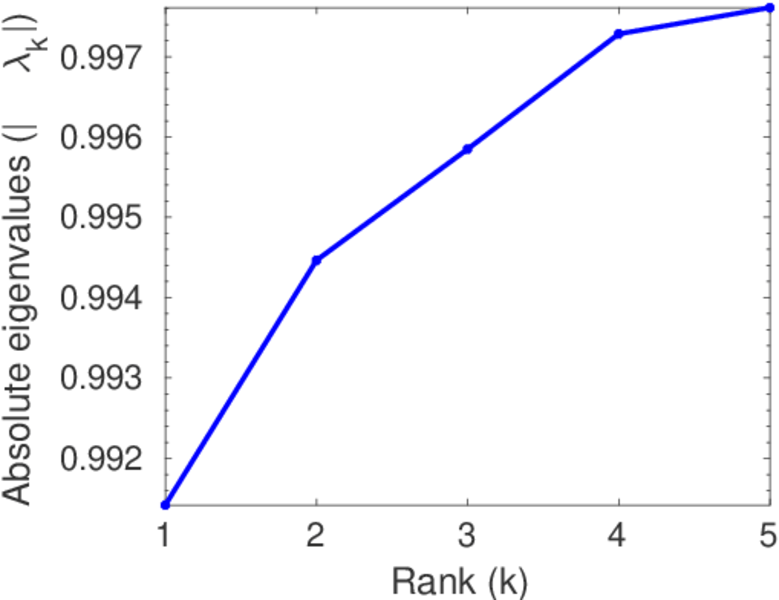
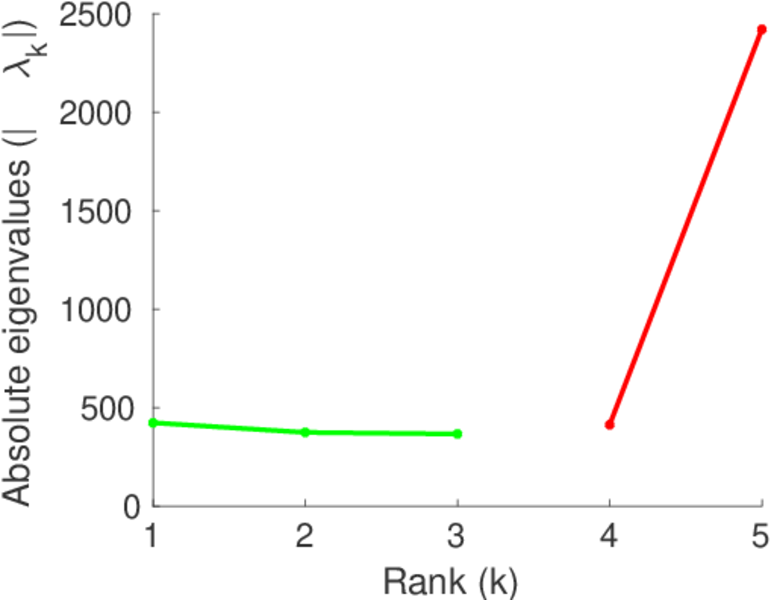
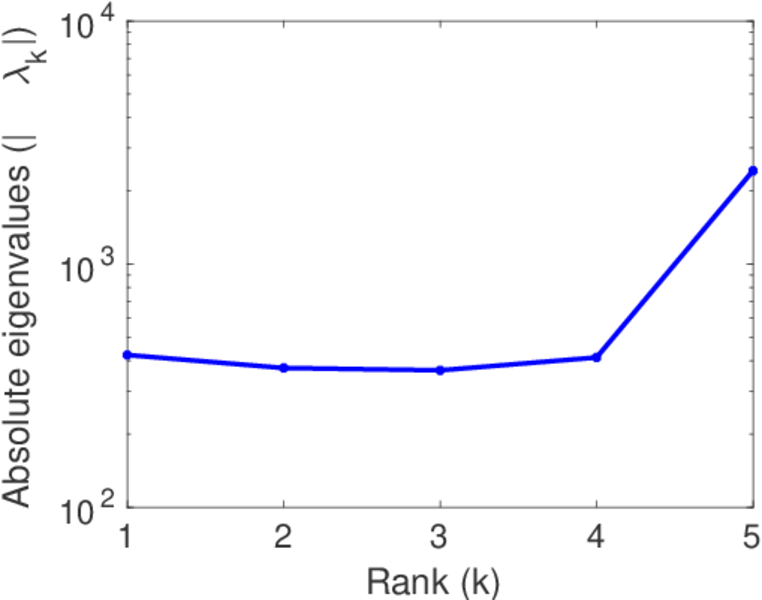
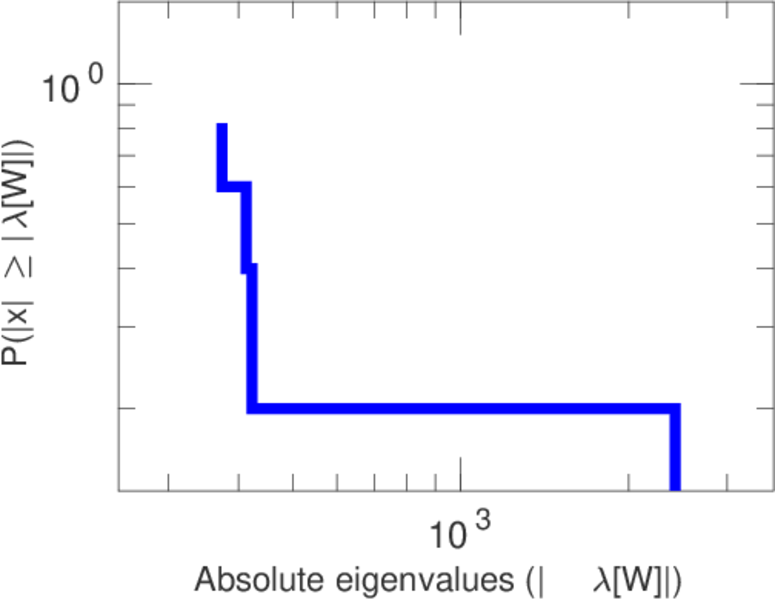
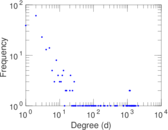
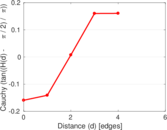
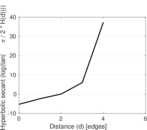
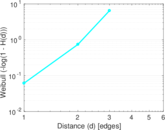
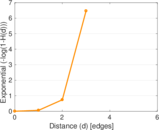
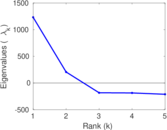
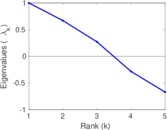
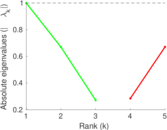
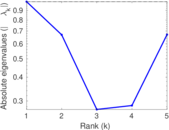
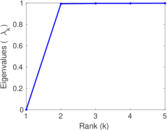
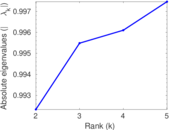
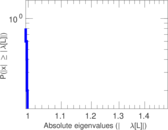
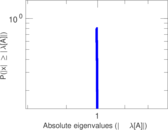
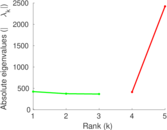
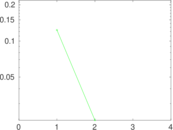
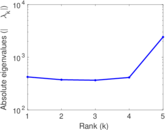
Plots


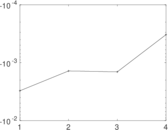
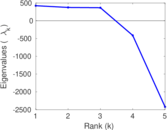
Matrix decompositions plots


Downloads
References
|
[1]
|
Jérôme Kunegis.
KONECT – The Koblenz Network Collection.
In Proc. Int. Conf. on World Wide Web Companion, pages
1343–1350, 2013.
[ http ]
|
|
[2]
|
Augustin Chaintreau, Pan Hui, Jon Crowcroft, Christophe Diot, Richard Gass, and
James Scott.
Impact of human mobility on opportunistic forwarding algorithms.
IEEE Trans. on Mobile Comput., 6(6):606–620, 2007.
|
 KONECT ‣ Networks ‣
Buy Me a Coffee
KONECT ‣ Networks ‣
Buy Me a Coffee