Delicious user–item
This network contains user–URL relations from http://delicious.com/. Left
nodes represent users, right nodes represent URLs and an edge shows that a user
tagged a URL.
Metadata
Statistics
| Size | n = | 34,611,302
|
| Left size | n1 = | 833,081
|
| Right size | n2 = | 33,778,221
|
| Volume | m = | 301,186,579
|
| Unique edge count | m̿ = | 101,798,957
|
| Wedge count | s = | 69,264,303,940
|
| Claw count | z = | 108,117,582,742,195
|
| Cross count | x = | 318,897,354,040,560,704
|
| Maximum degree | dmax = | 143,470
|
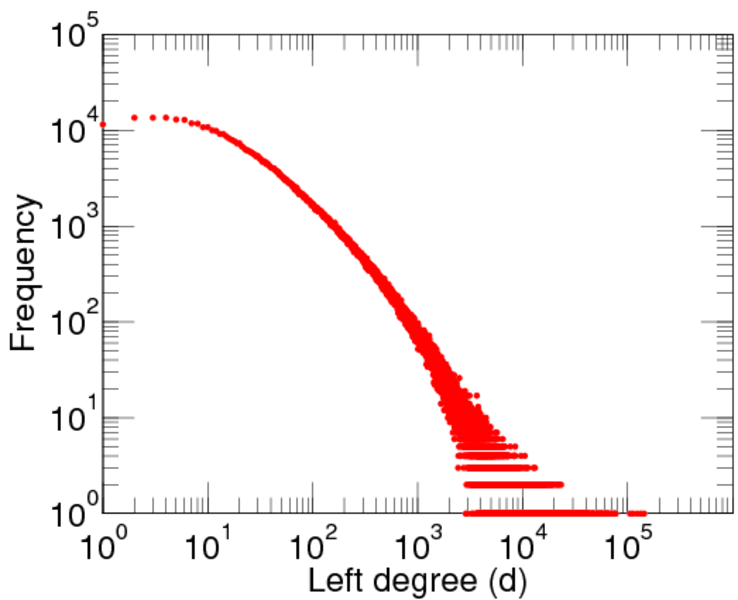
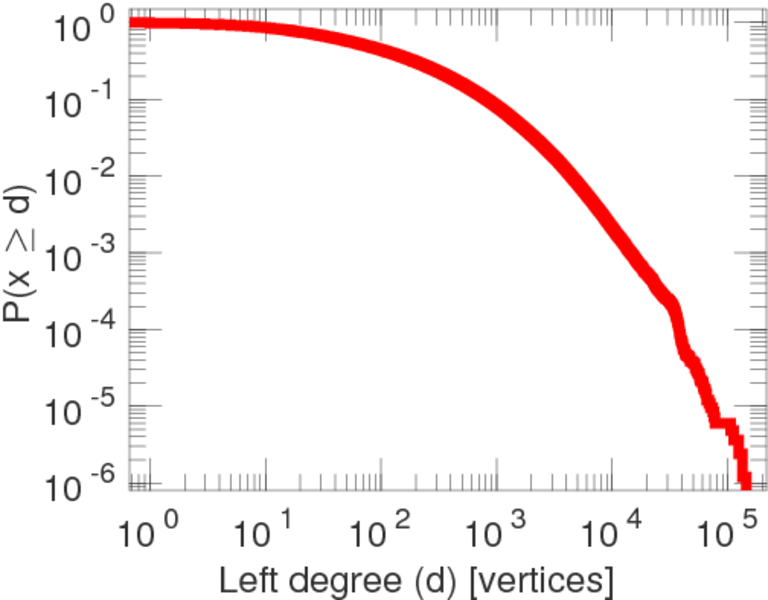
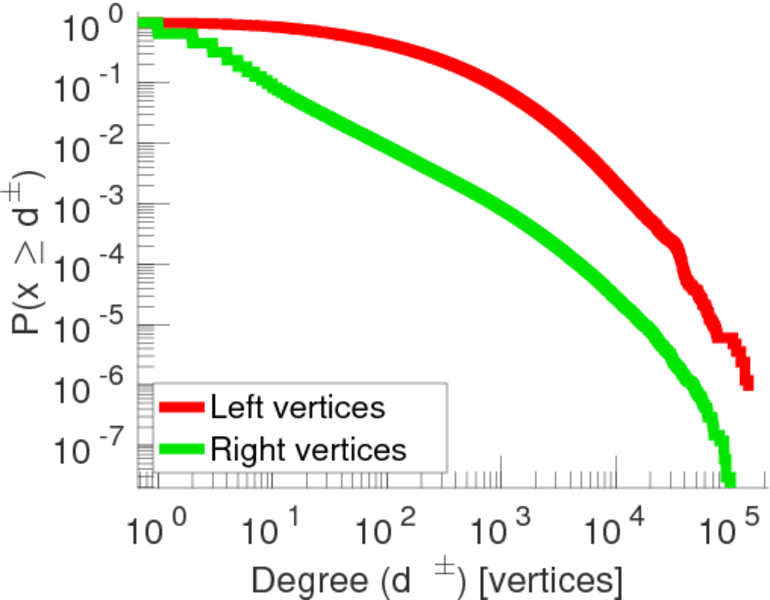
| Maximum left degree | d1max = | 143,470
|
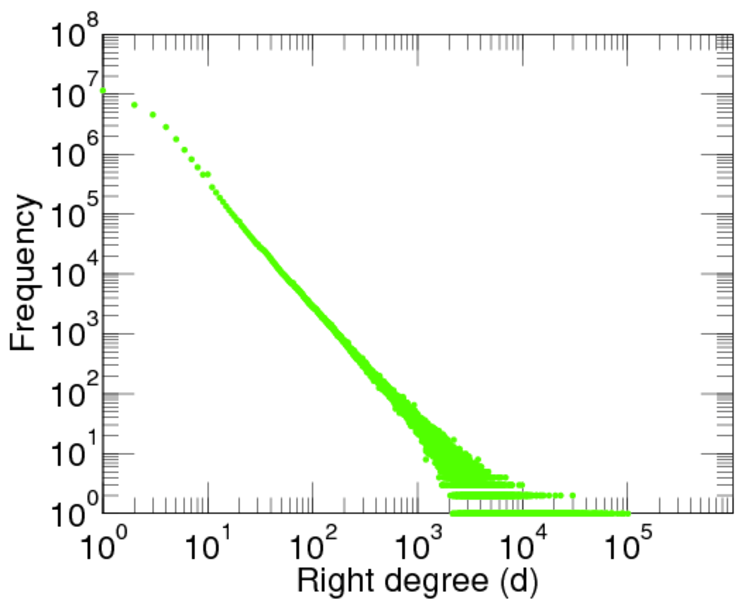
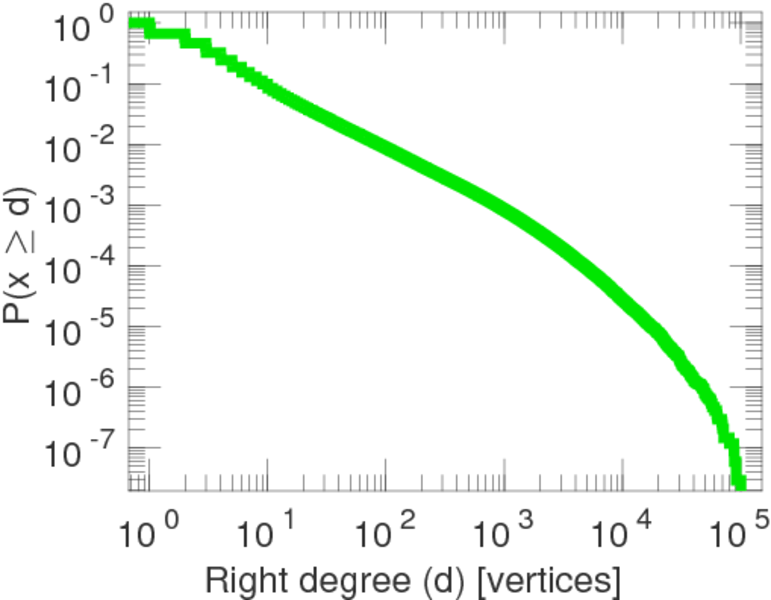
| Maximum right degree | d2max = | 100,625
|
| Average degree | d = | 17.403 9
|
| Average left degree | d1 = | 361.533
|
| Average right degree | d2 = | 8.916 59
|
| Fill | p = | 3.617 59 × 10−6
|
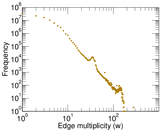
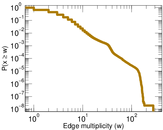
| Average edge multiplicity | m̃ = | 2.958 64
|
| Size of LCC | N = | 34,323,019
|
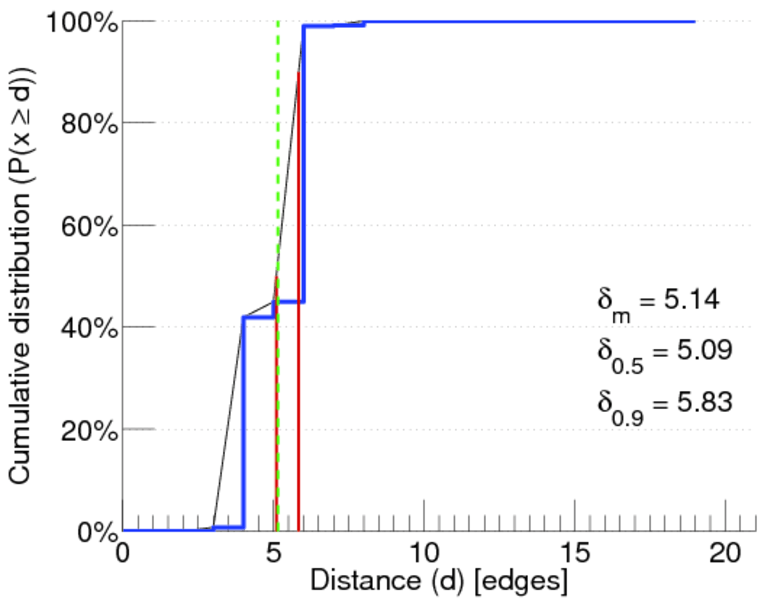
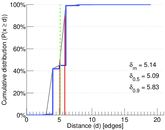
| Diameter | δ = | 29
|
| 50-Percentile effective diameter | δ0.5 = | 5.093 45
|
| 90-Percentile effective diameter | δ0.9 = | 5.833 41
|
| Mean distance | δm = | 5.143 67
|
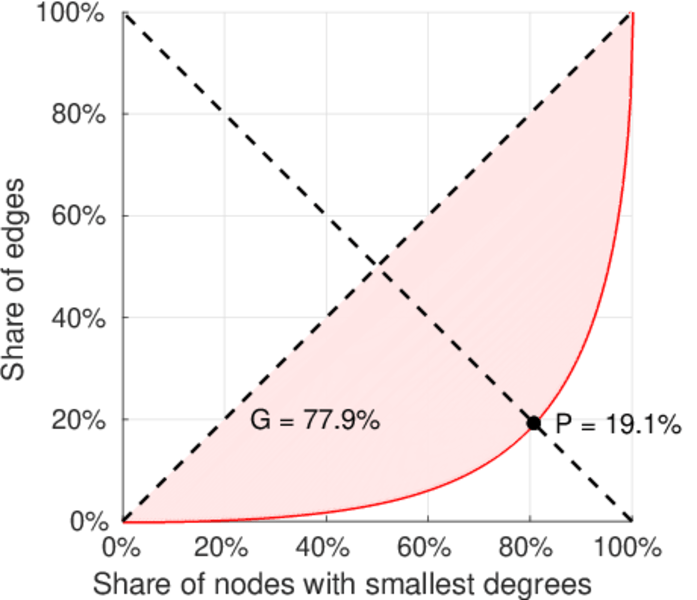
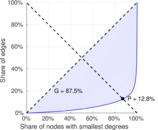
| Gini coefficient | G = | 0.879 437
|
| Balanced inequality ratio | P = | 0.123 302
|
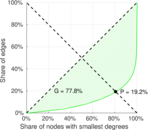
| Left balanced inequality ratio | P1 = | 0.191 035
|
| Right balanced inequality ratio | P2 = | 0.191 701
|
| Relative edge distribution entropy | Her = | 0.842 841
|
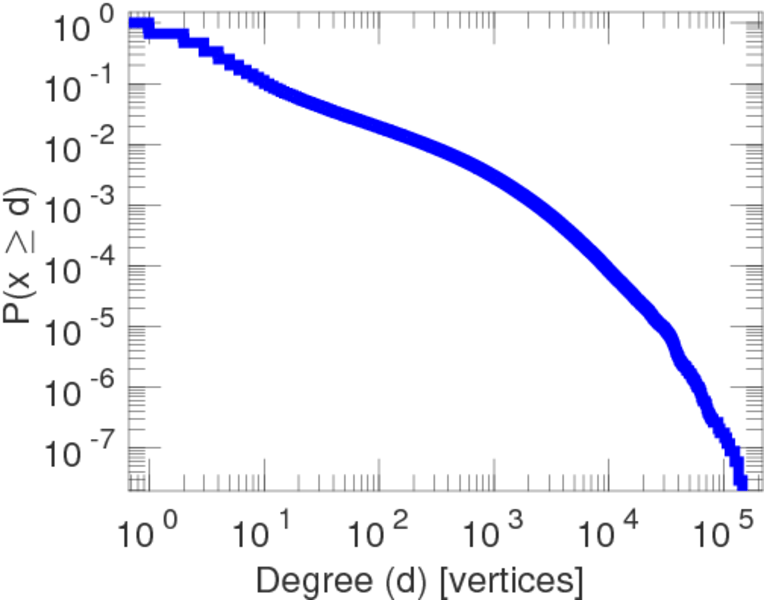
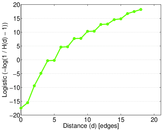
| Power law exponent | γ = | 3.649 70
|
| Tail power law exponent | γt = | 1.761 00
|
| Degree assortativity | ρ = | −0.031 510 6
|
| Degree assortativity p-value | pρ = | 0.000 00
|
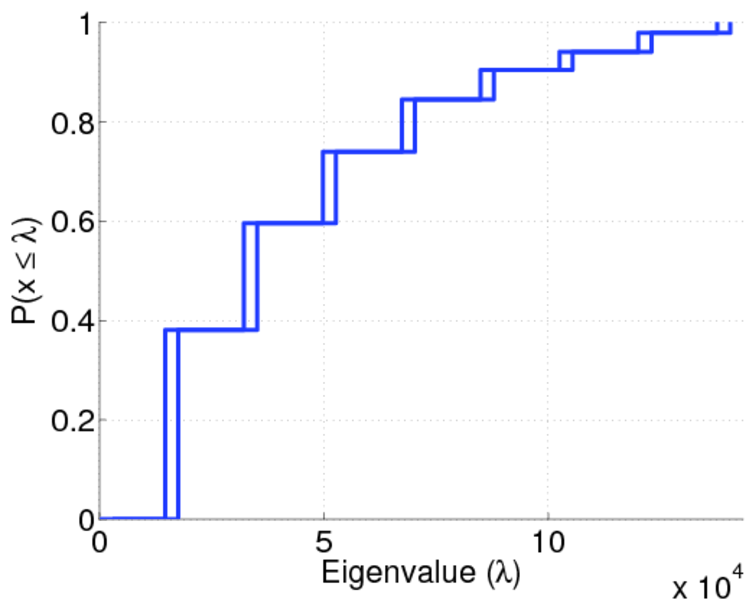
| Spectral norm | α = | 3,694.59
|
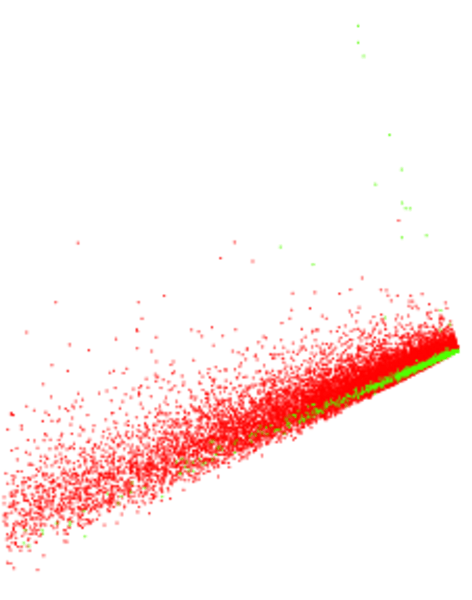
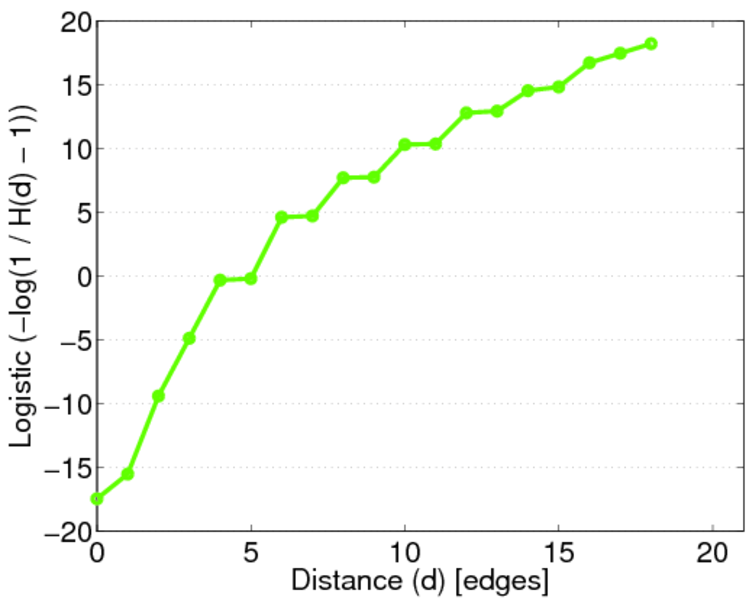
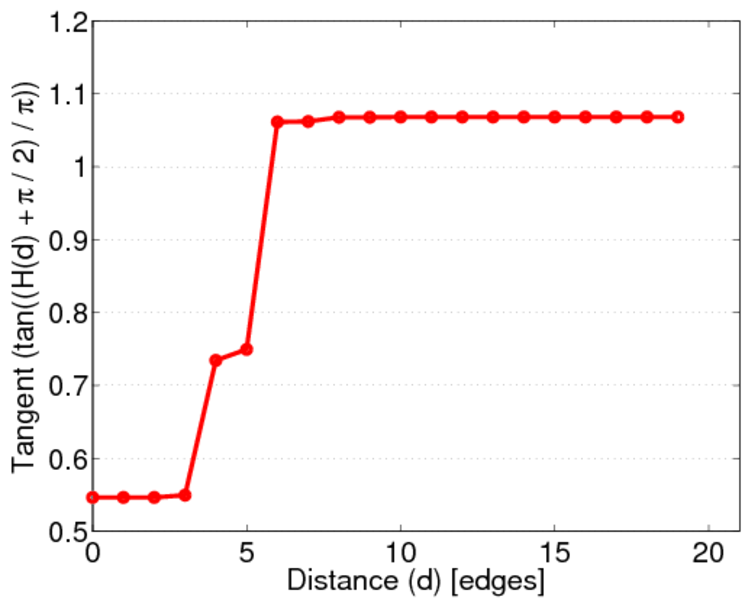
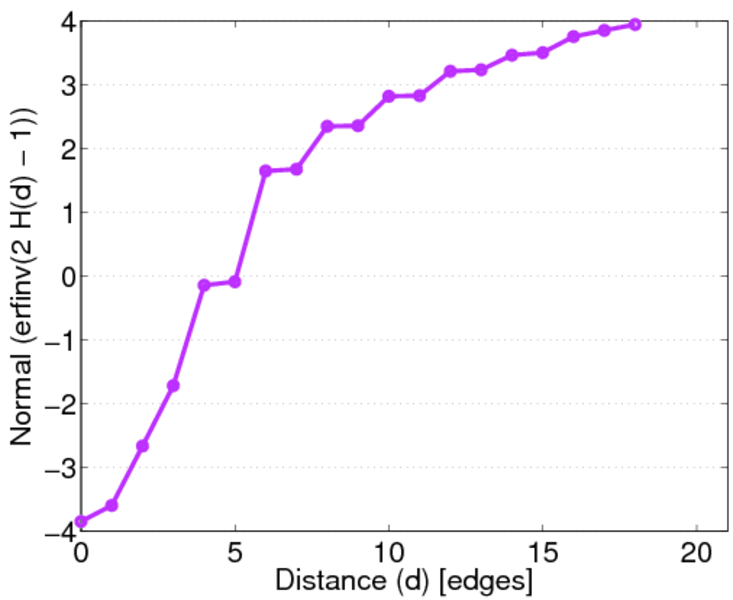
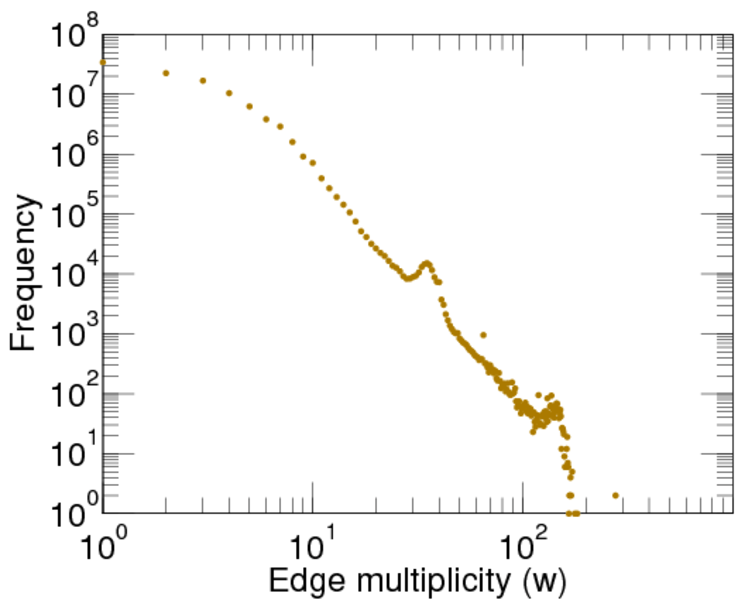
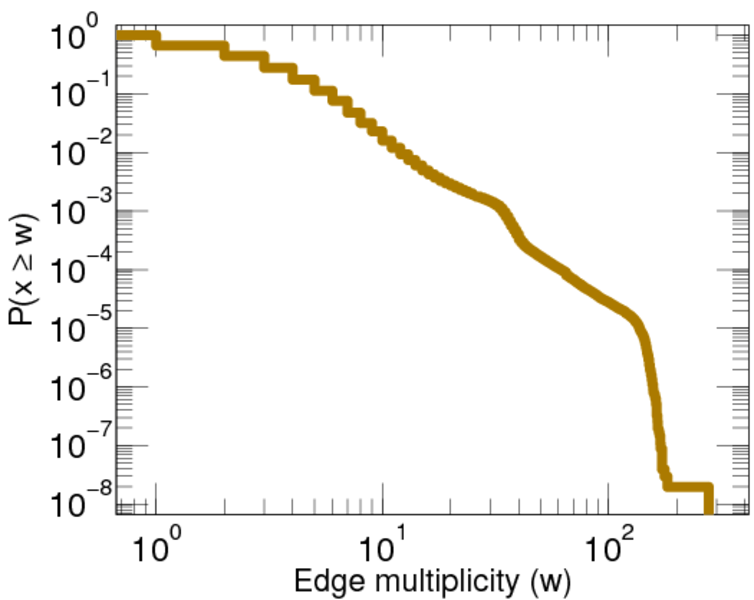
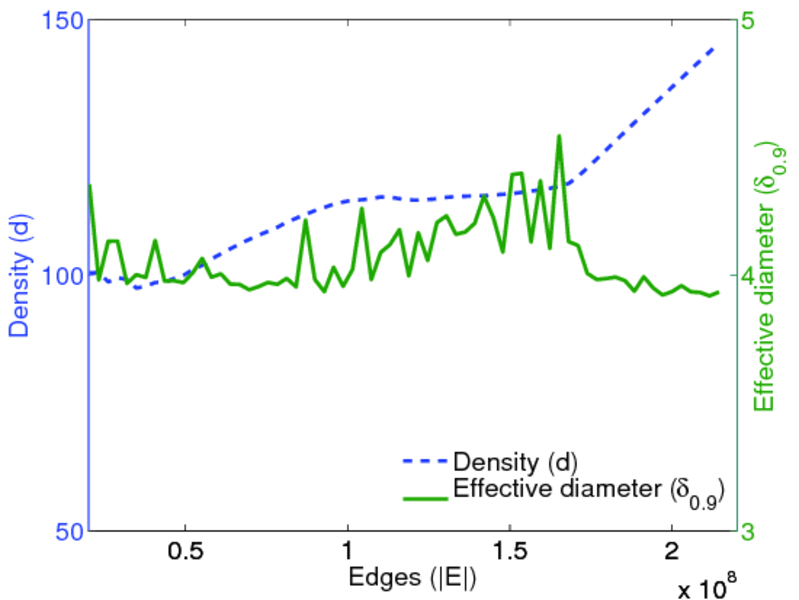
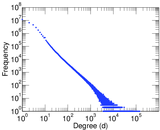
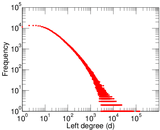
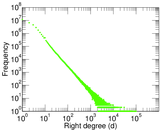
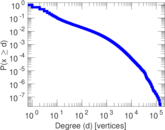
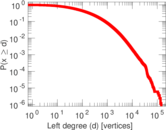
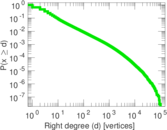
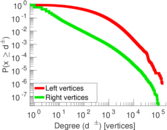
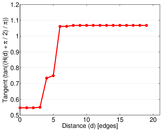
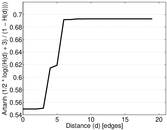
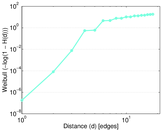
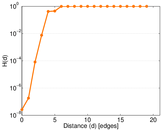
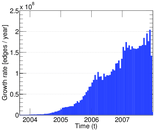
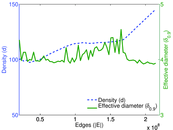
Plots


Downloads
References
|
[1]
|
Jérôme Kunegis.
KONECT – The Koblenz Network Collection.
In Proc. Int. Conf. on World Wide Web Companion, pages
1343–1350, 2013.
[ http ]
|
|
[2]
|
Robert Wetzker, Carsten Zimmermann, and Christian Bauckhage.
Analyzing social bookmarking systems: A del.icio.us cookbook.
In Proc. Mining Soc. Data Workshop, pages 26–30, 2008.
|
 KONECT ‣ Networks ‣
Buy Me a Coffee
KONECT ‣ Networks ‣
Buy Me a Coffee