Delicious user–tag
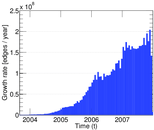
This network contains user–tag relations from http://delicious.com/. Left
nodes represent users, right nodes represent tags and an edge shows that a user
tagged an URL using the tag represented by the right node.
Metadata
Statistics
| Size | n = | 5,345,180
|
| Left size | n1 = | 833,081
|
| Right size | n2 = | 4,512,099
|
| Volume | m = | 301,186,579
|
| Unique edge count | m̿ = | 81,989,133
|
| Wedge count | s = | 1,445,587,961,389
|
| Claw count | z = | 58,243,254,727,040,968
|
| Cross count | x = | 2.489 28 × 1021
|
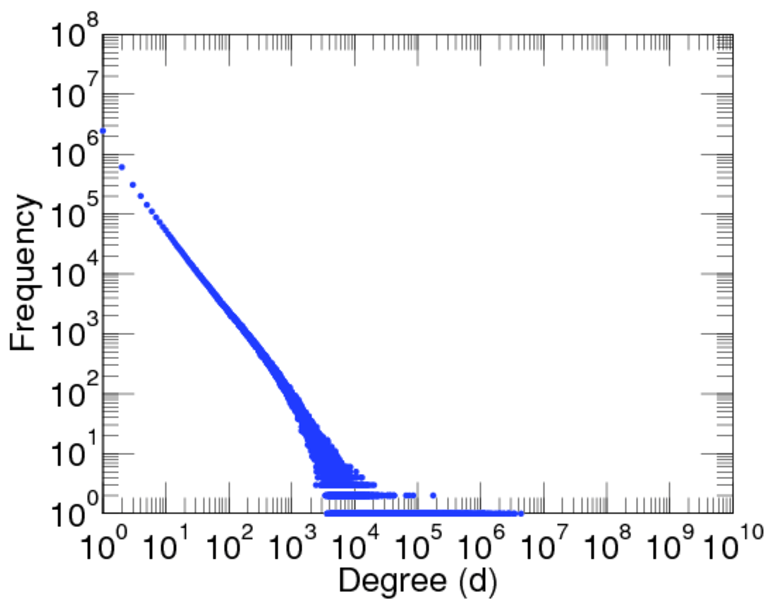
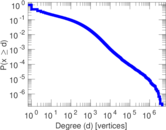
| Maximum degree | dmax = | 4,358,622
|
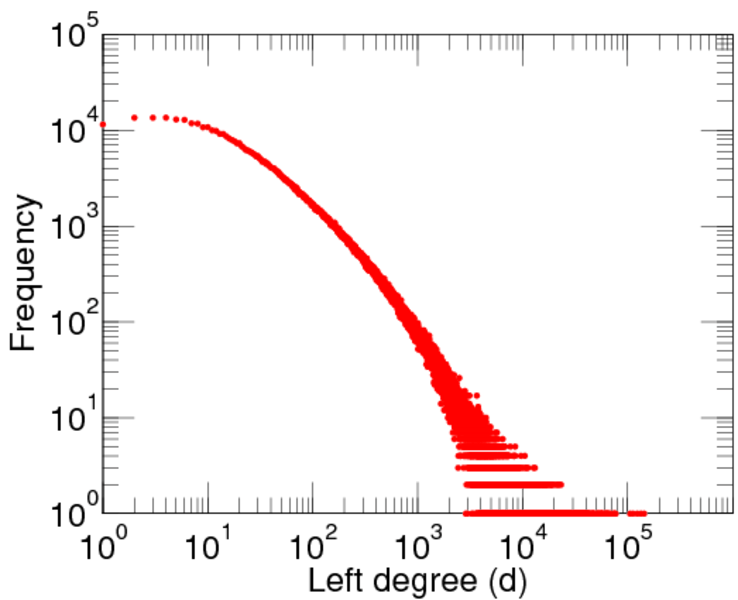
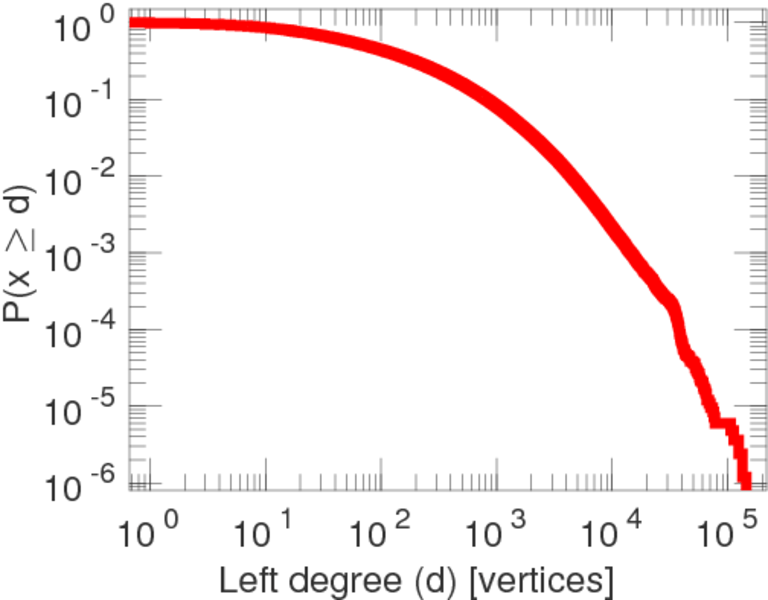
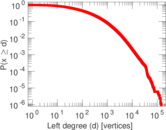
| Maximum left degree | d1max = | 143,470
|
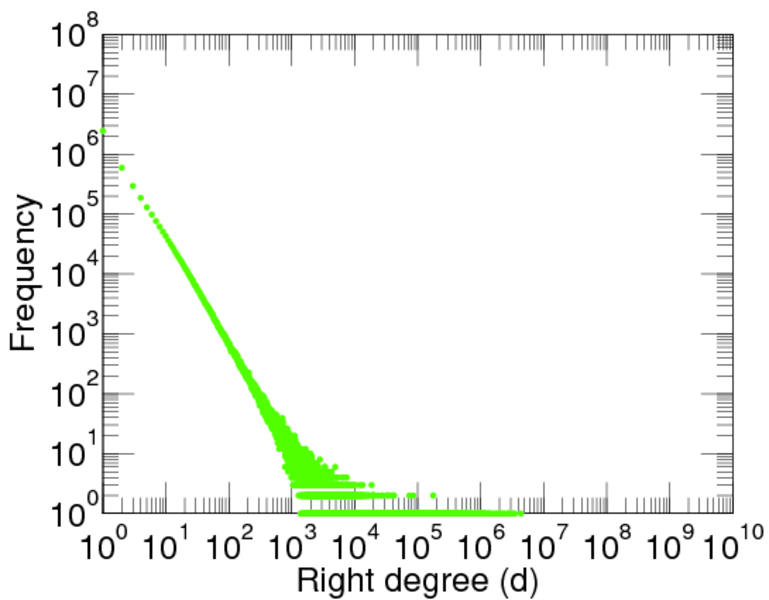
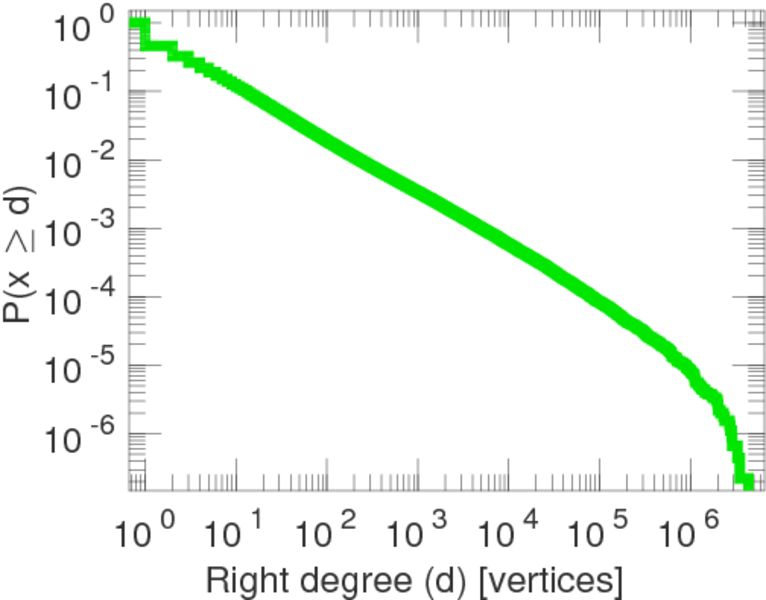
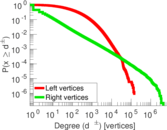
| Maximum right degree | d2max = | 4,358,622
|
| Average degree | d = | 112.695
|
| Average left degree | d1 = | 361.533
|
| Average right degree | d2 = | 66.750 9
|
| Fill | p = | 2.181 17 × 10−5
|
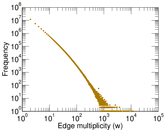
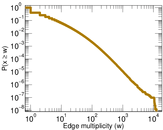
| Average edge multiplicity | m̃ = | 3.673 49
|
| Size of LCC | N = | 5,339,821
|
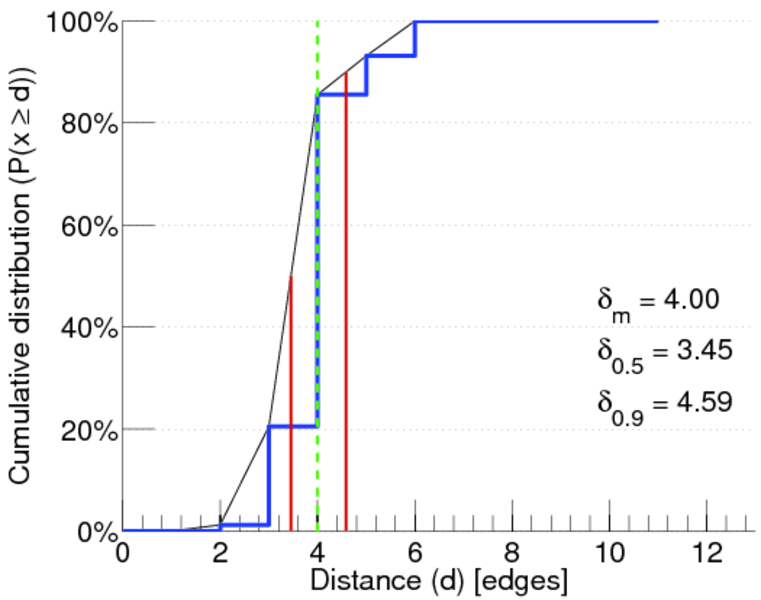
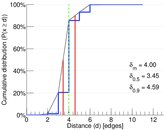
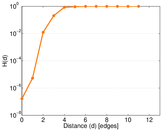
| Diameter | δ = | 14
|
| 50-Percentile effective diameter | δ0.5 = | 3.453 45
|
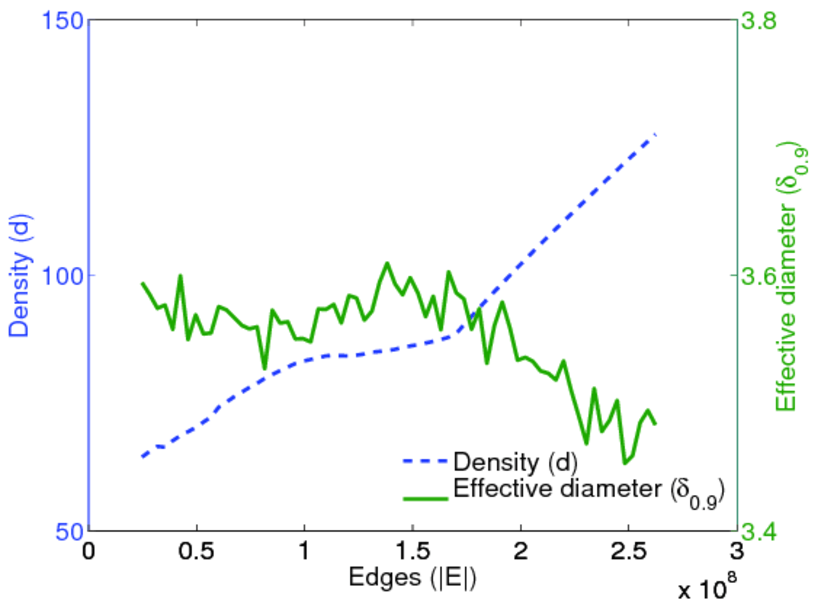
| 90-Percentile effective diameter | δ0.9 = | 4.588 55
|
| Mean distance | δm = | 3.996 38
|
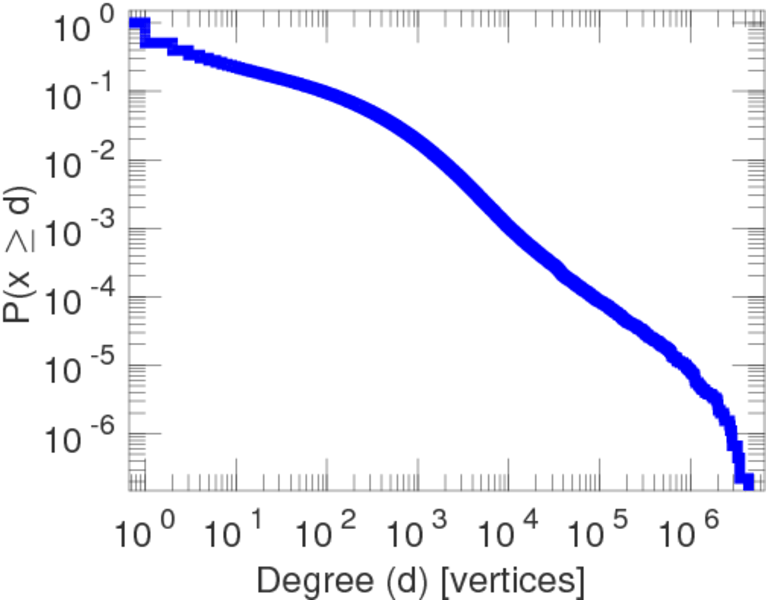
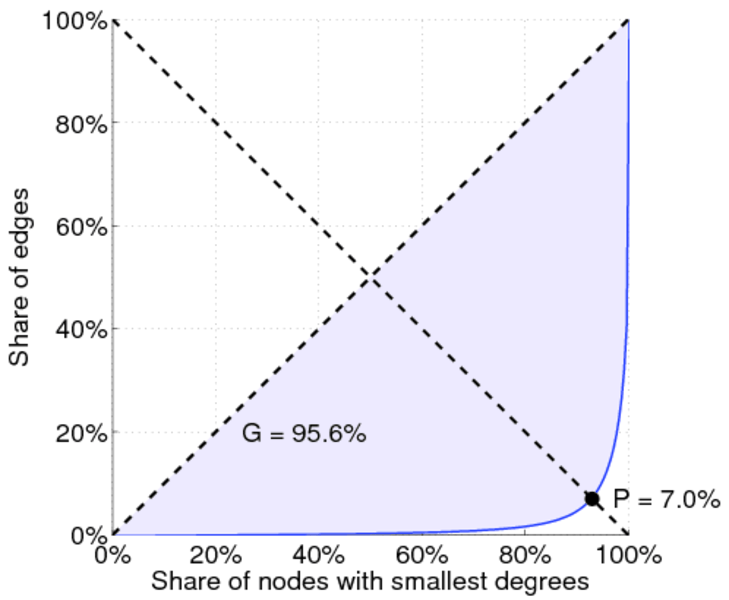
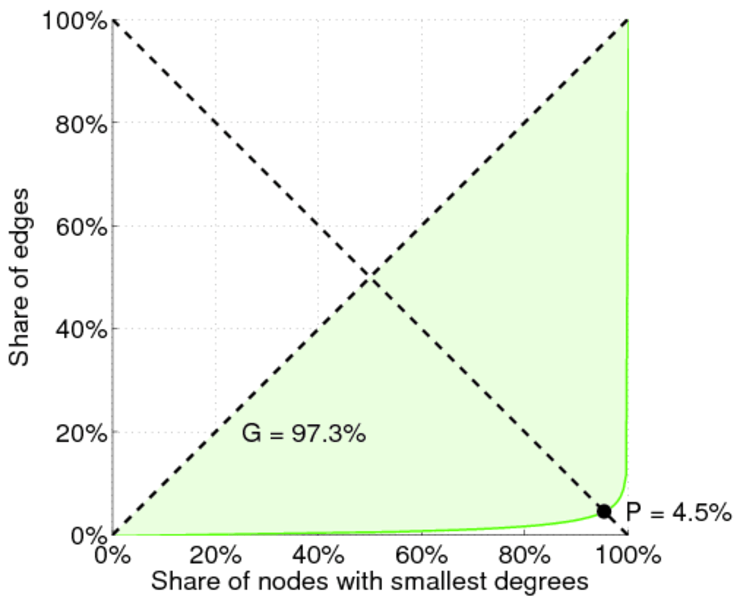
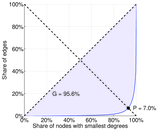
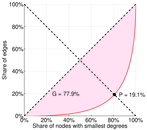
| Gini coefficient | G = | 0.958 877
|
| Balanced inequality ratio | P = | 0.064 980 4
|
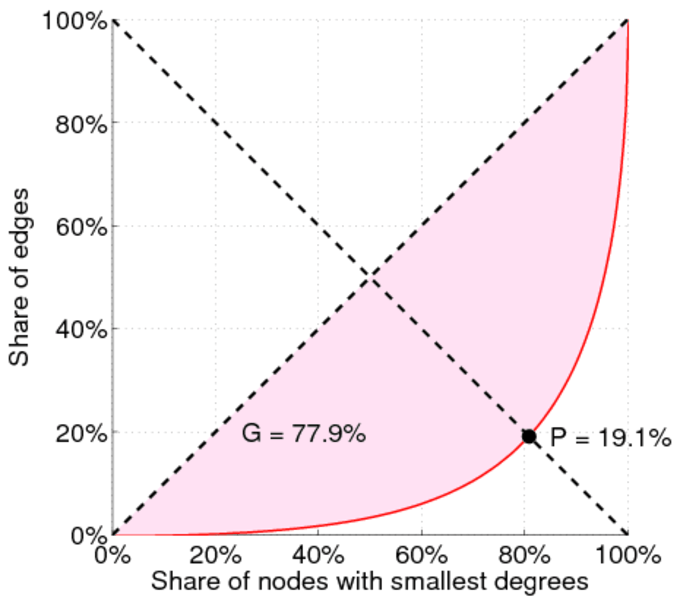
| Left balanced inequality ratio | P1 = | 0.191 035
|
| Right balanced inequality ratio | P2 = | 0.045 447 5
|
| Relative edge distribution entropy | Her = | 0.777 832
|
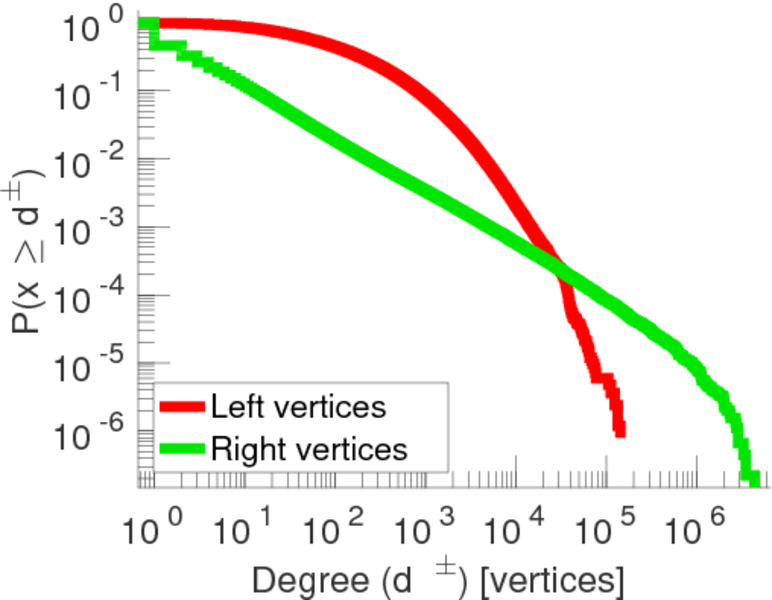
| Power law exponent | γ = | 2.101 20
|
| Tail power law exponent | γt = | 1.471 00
|
| Degree assortativity | ρ = | −0.129 906
|
| Degree assortativity p-value | pρ = | 0.000 00
|
| Spectral norm | α = | 55,753.5
|
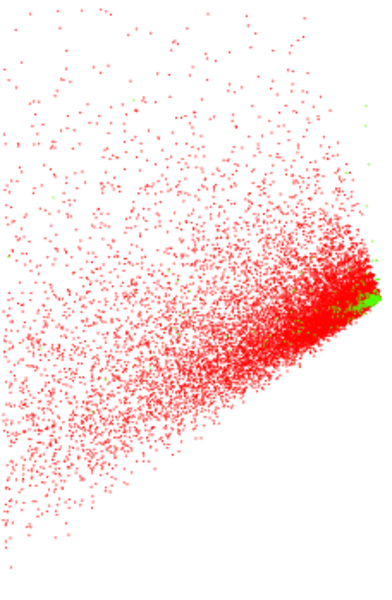
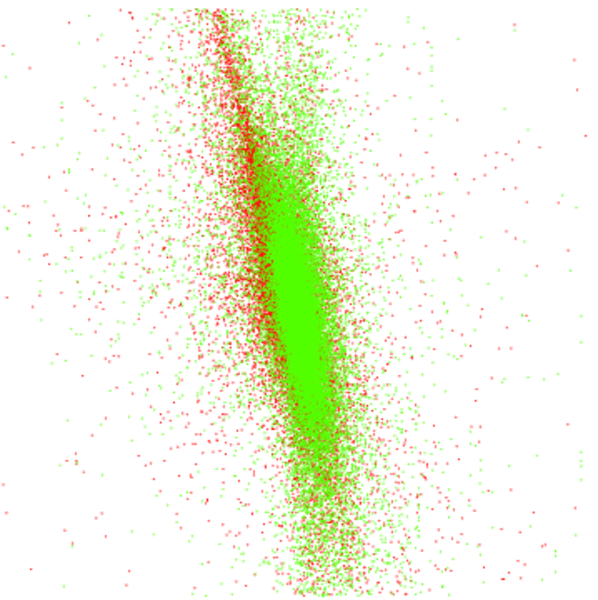
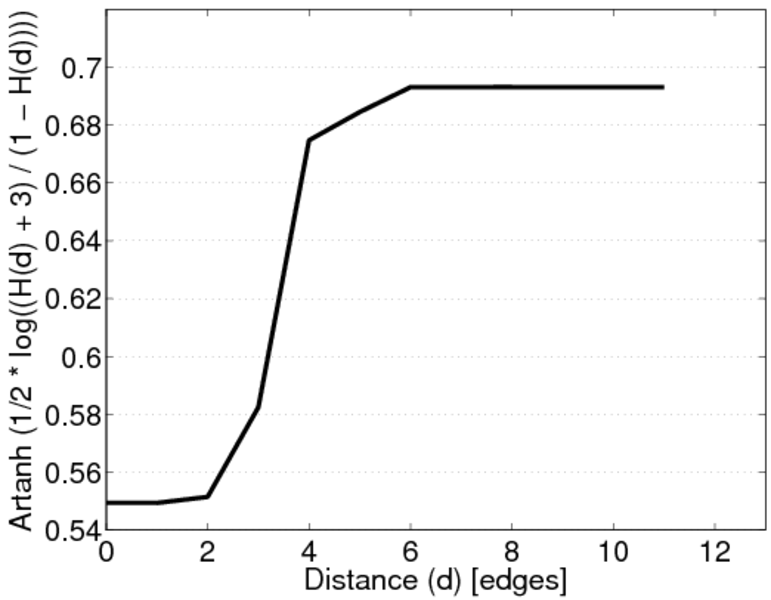
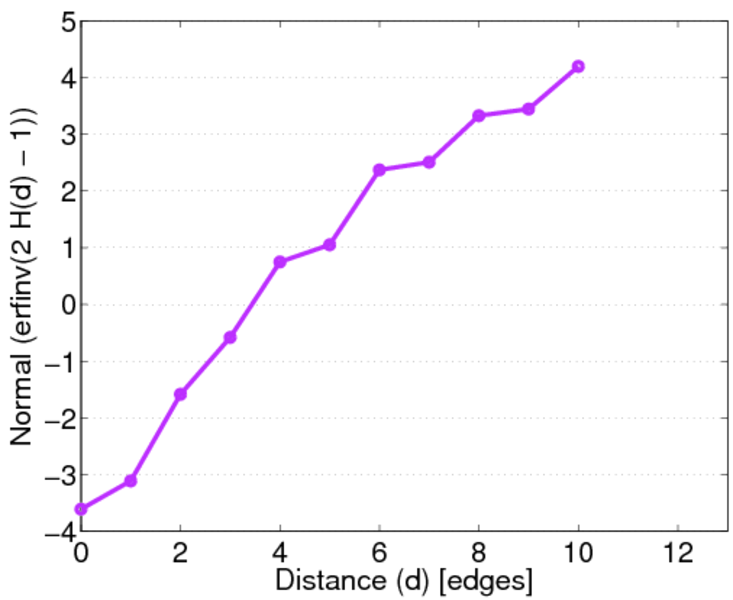
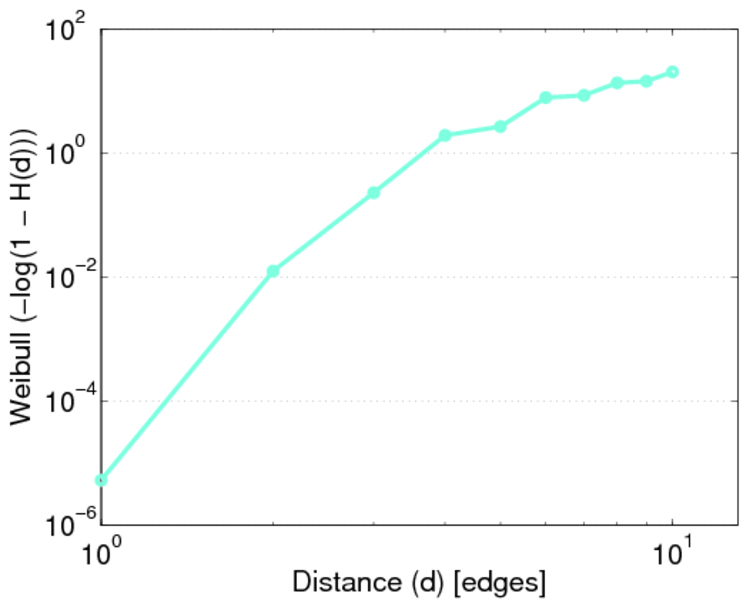
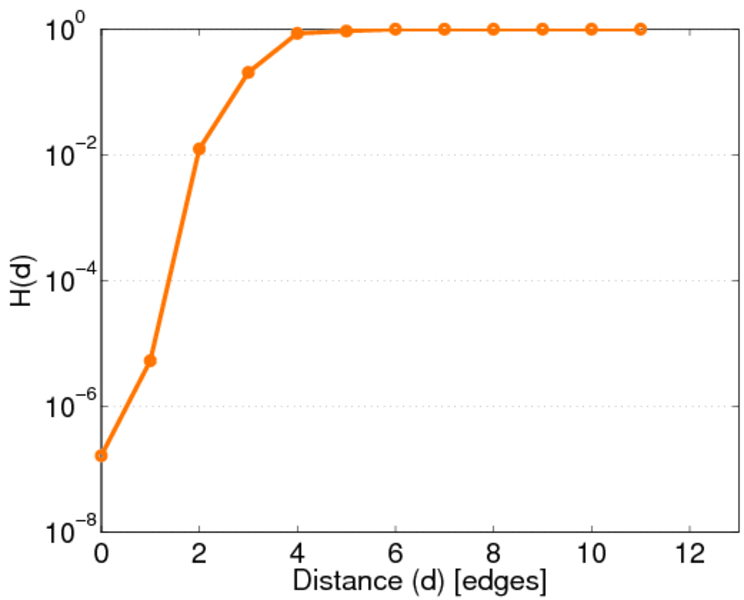
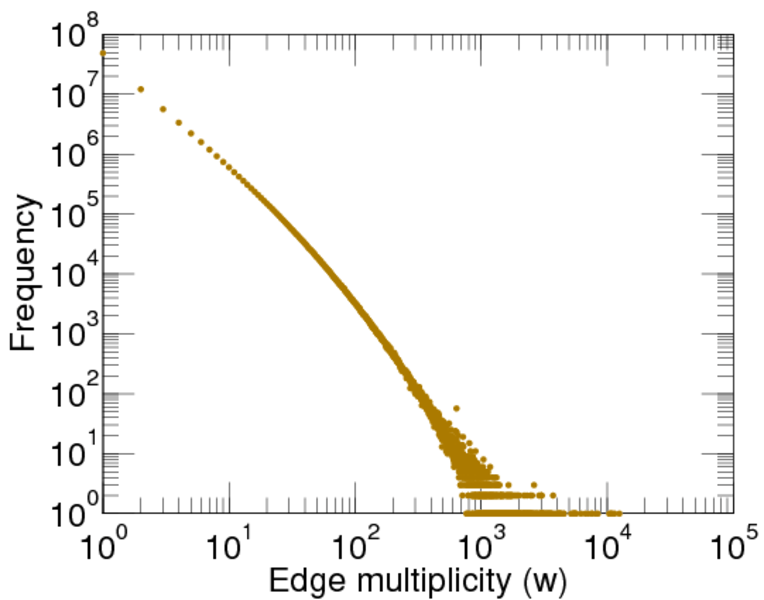
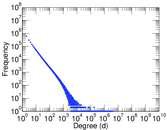
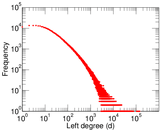
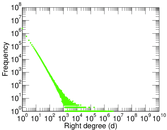
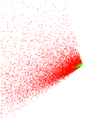
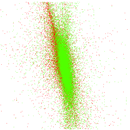
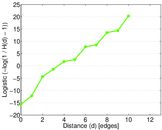
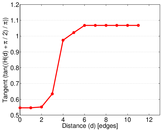
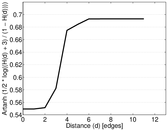
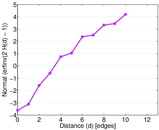
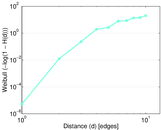
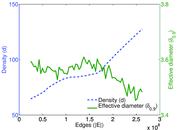
Plots


Downloads
References
|
[1]
|
Jérôme Kunegis.
KONECT – The Koblenz Network Collection.
In Proc. Int. Conf. on World Wide Web Companion, pages
1343–1350, 2013.
[ http ]
|
|
[2]
|
Robert Wetzker, Carsten Zimmermann, and Christian Bauckhage.
Analyzing social bookmarking systems: A del.icio.us cookbook.
In Proc. Mining Soc. Data Workshop, pages 26–30, 2008.
|
 KONECT ‣ Networks ‣
Buy Me a Coffee
KONECT ‣ Networks ‣
Buy Me a Coffee