Wikipedia edits (ace)
This is the bipartite edit network of the Achinese Wikipedia. It contains users
and pages from the Achinese Wikipedia, connected by edit events. Each edge
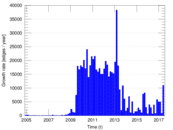
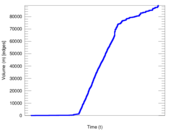
represents an edit. The dataset includes the timestamp of each edit.
Metadata
Statistics
| Size | n = | 12,844
|
| Left size | n1 = | 1,321
|
| Right size | n2 = | 11,523
|
| Volume | m = | 89,021
|
| Unique edge count | m̿ = | 47,547
|
| Wedge count | s = | 30,342,600
|
| Claw count | z = | 29,224,816,319
|
| Cross count | x = | 30,512,214,738,882
|
| Square count | q = | 52,965,523
|
| 4-Tour count | T4 = | 545,279,202
|
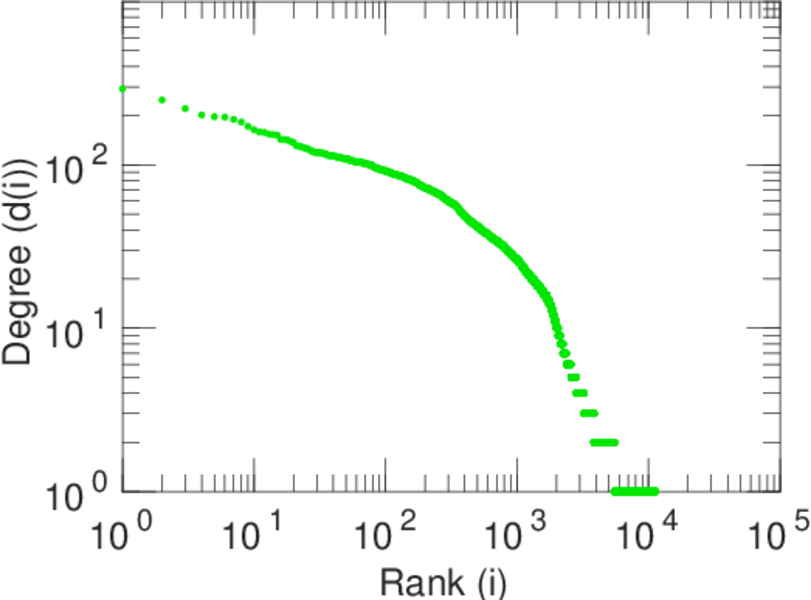
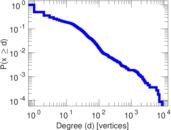
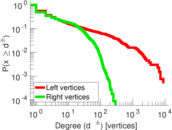
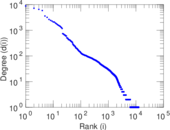
| Maximum degree | dmax = | 8,801
|
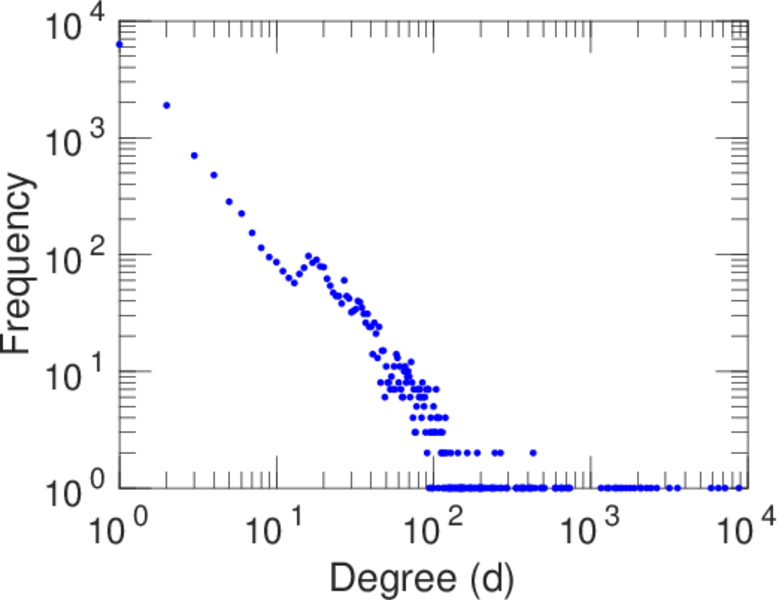
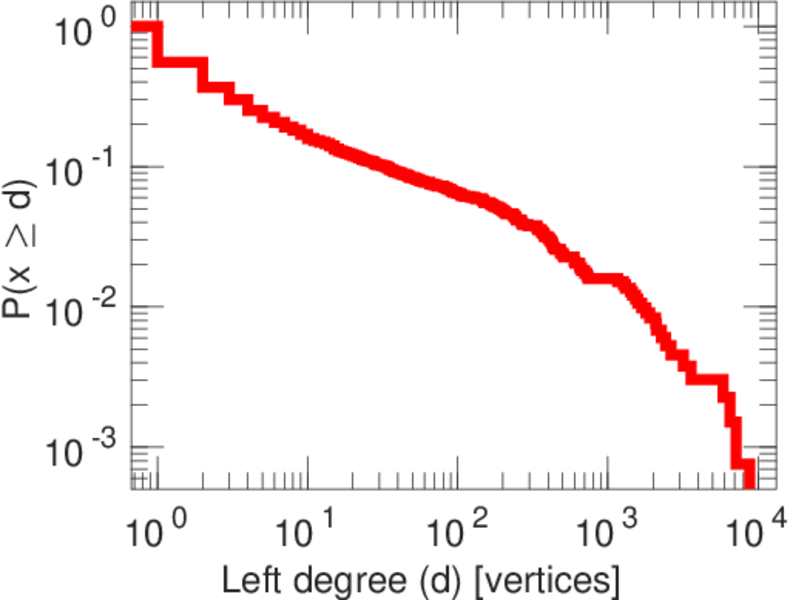
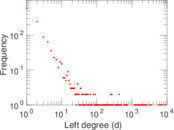
| Maximum left degree | d1max = | 8,801
|
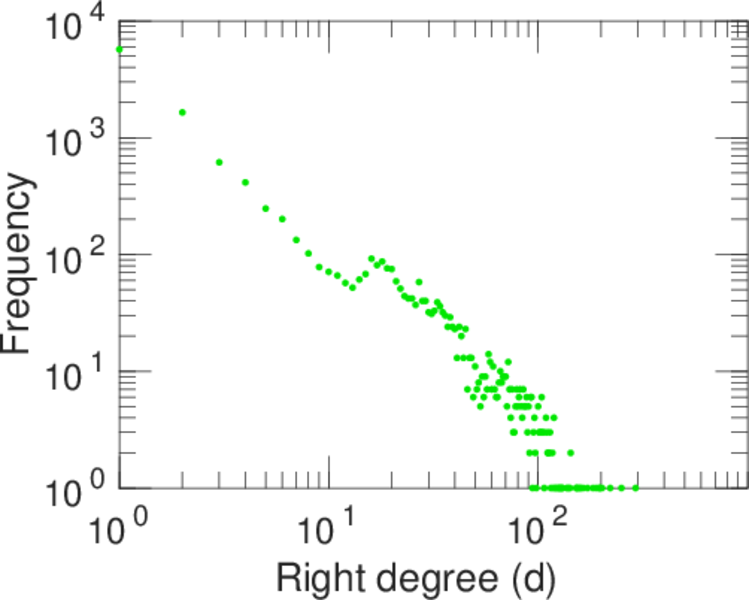
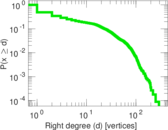
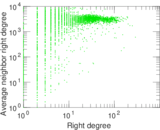
| Maximum right degree | d2max = | 292
|
| Average degree | d = | 13.861 9
|
| Average left degree | d1 = | 67.389 1
|
| Average right degree | d2 = | 7.725 51
|
| Fill | p = | 0.003 123 60
|
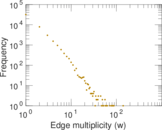
| Average edge multiplicity | m̃ = | 1.872 27
|
| Size of LCC | N = | 11,903
|
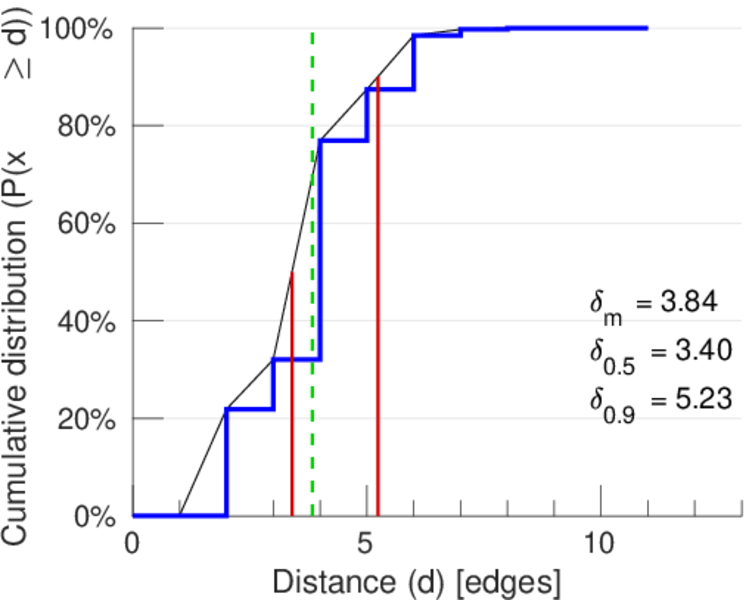
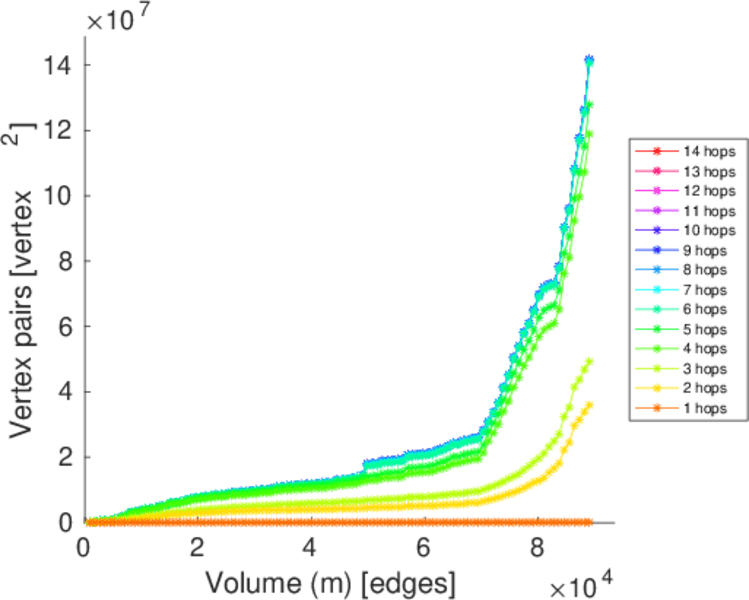
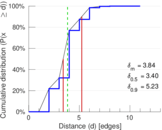
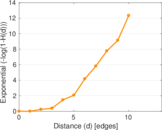
| Diameter | δ = | 13
|
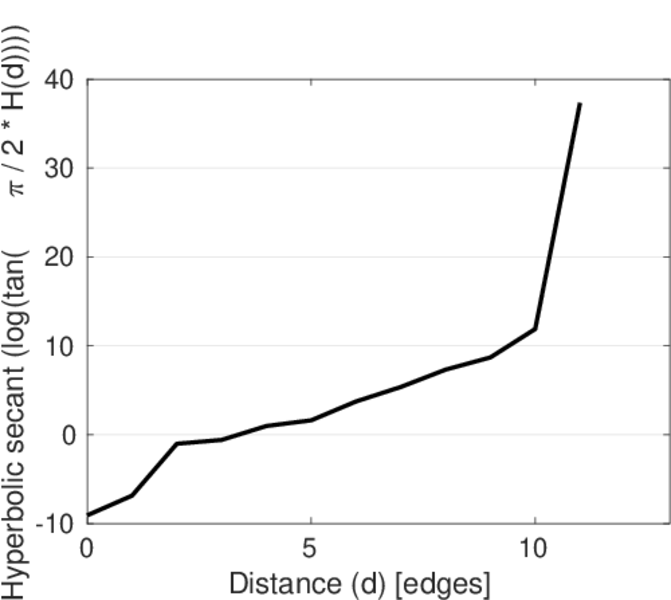
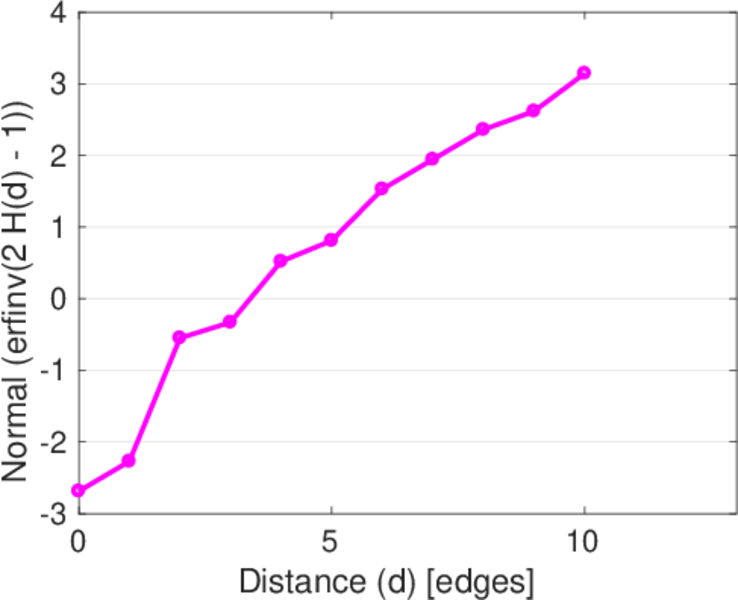
| 50-Percentile effective diameter | δ0.5 = | 3.400 40
|
| 90-Percentile effective diameter | δ0.9 = | 5.233 03
|
| Median distance | δM = | 4
|
| Mean distance | δm = | 3.835 77
|
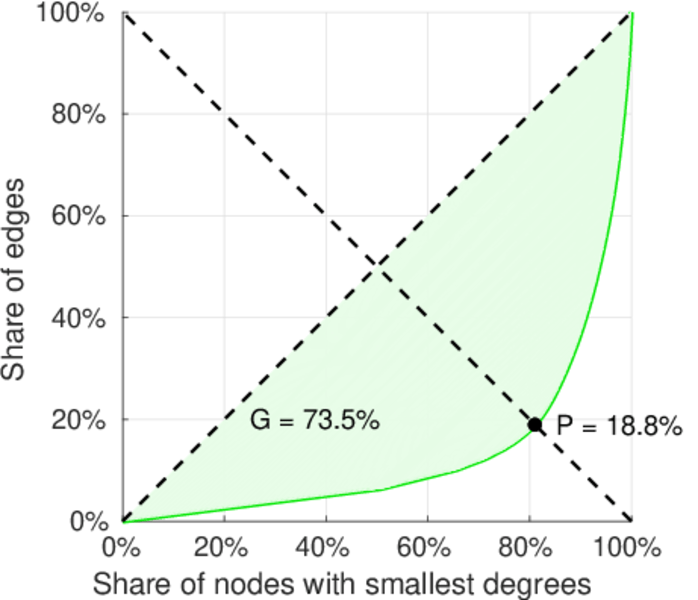
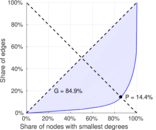
| Gini coefficient | G = | 0.857 540
|
| Balanced inequality ratio | P = | 0.138 377
|
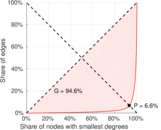
| Left balanced inequality ratio | P1 = | 0.065 883 3
|
| Right balanced inequality ratio | P2 = | 0.188 147
|
| Relative edge distribution entropy | Her = | 0.758 068
|
| Power law exponent | γ = | 2.452 64
|
| Tail power law exponent | γt = | 2.601 00
|
| Tail power law exponent with p | γ3 = | 2.601 00
|
| p-value | p = | 0.000 00
|
| Left tail power law exponent with p | γ3,1 = | 1.511 00
|
| Left p-value | p1 = | 0.000 00
|
| Right tail power law exponent with p | γ3,2 = | 7.651 00
|
| Right p-value | p2 = | 0.211 000
|
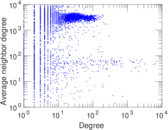
| Degree assortativity | ρ = | −0.328 453
|
| Degree assortativity p-value | pρ = | 0.000 00
|
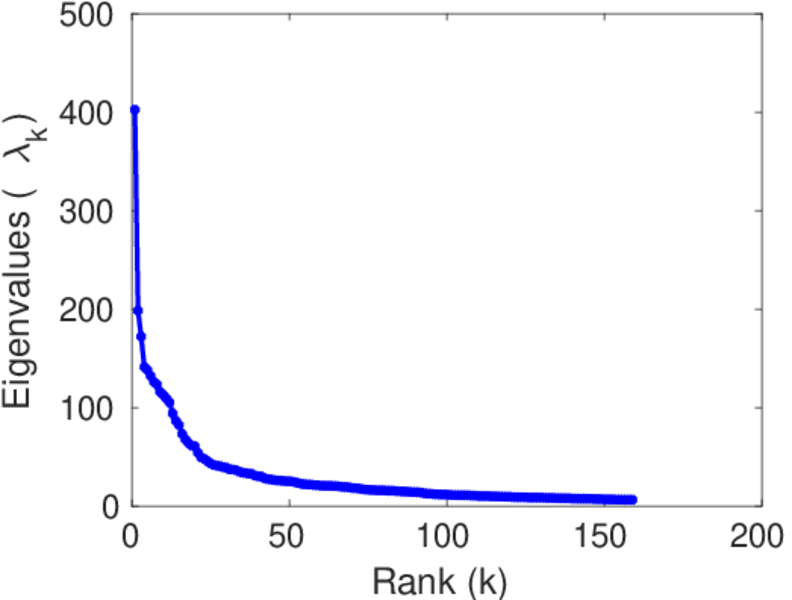
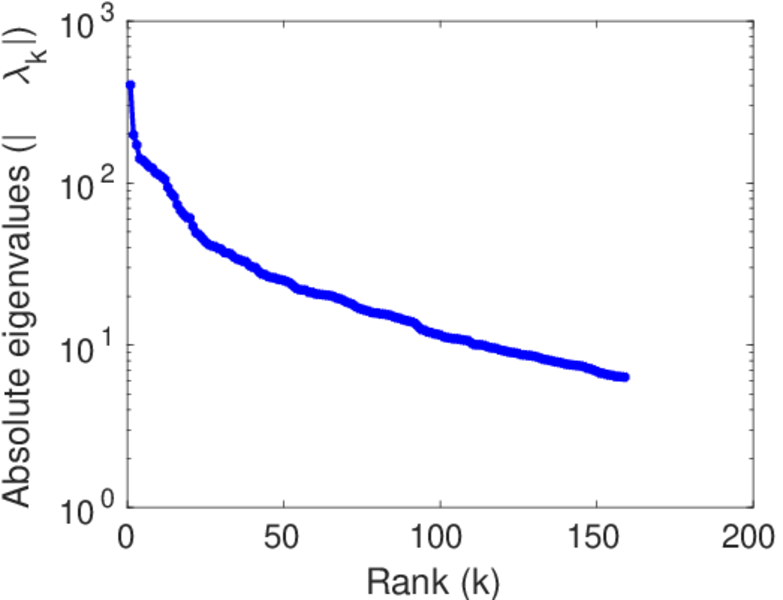
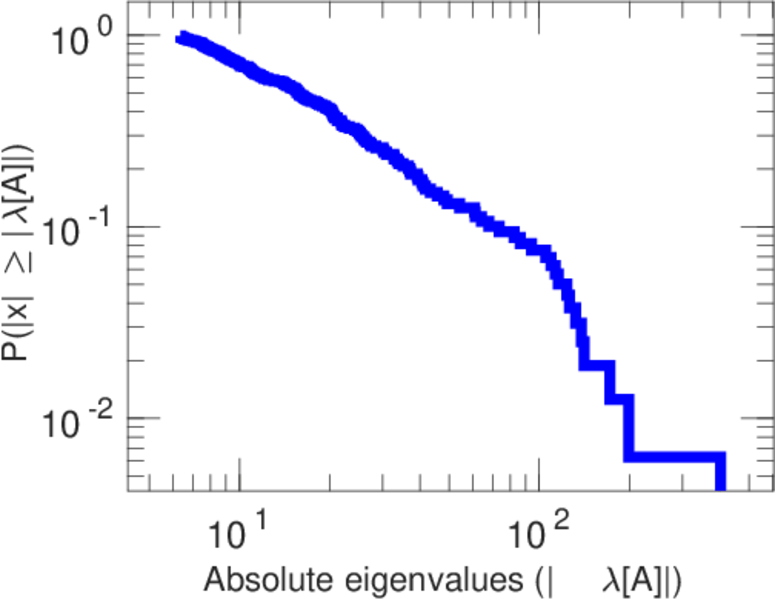
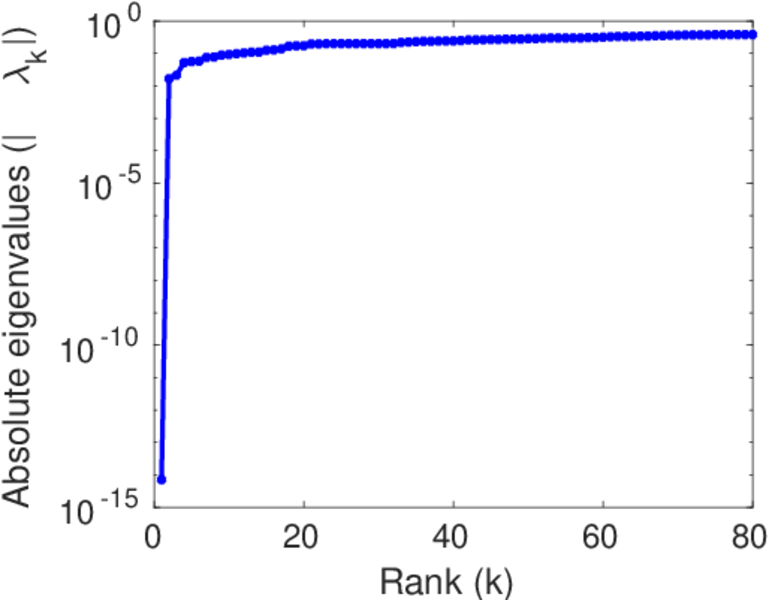
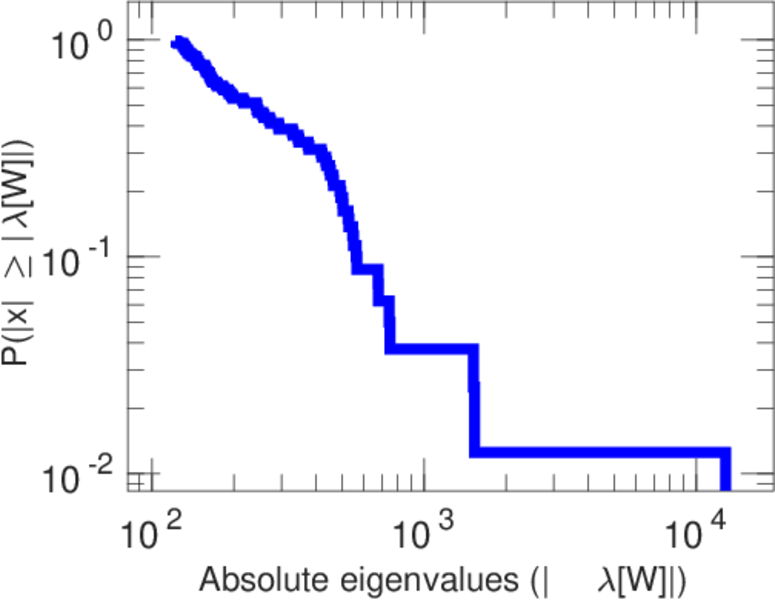
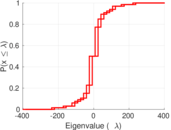
| Spectral norm | α = | 402.541
|
| Algebraic connectivity | a = | 0.016 597 5
|
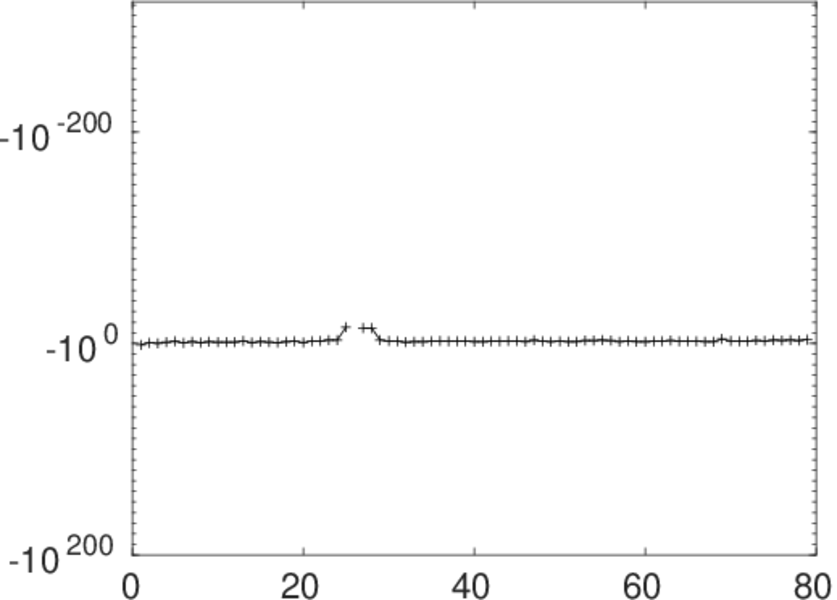
| Spectral separation | |λ1[A] / λ2[A]| = | 2.028 99
|
| Controllability | C = | 10,247
|
| Relative controllability | Cr = | 0.818 450
|
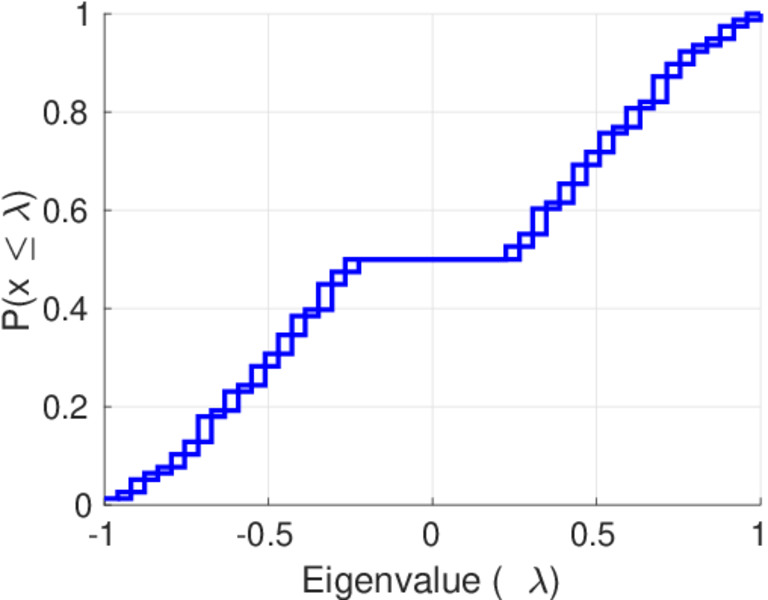
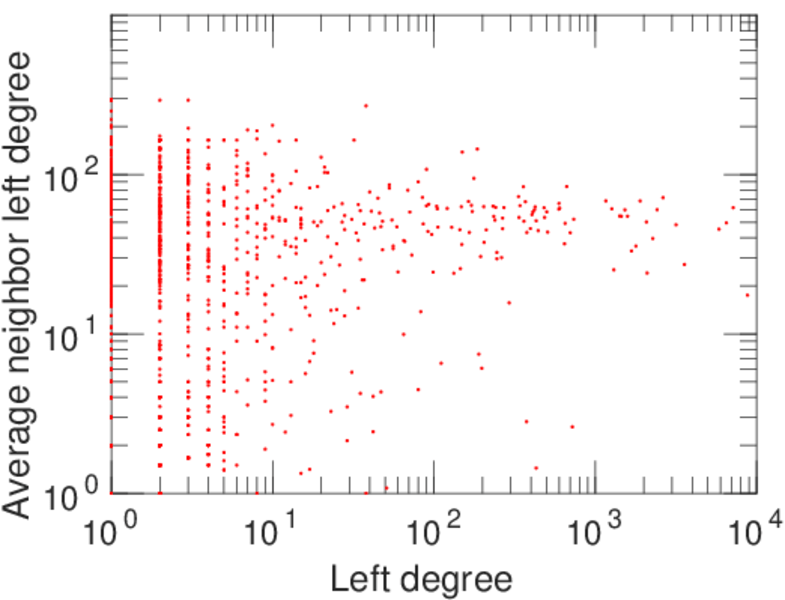
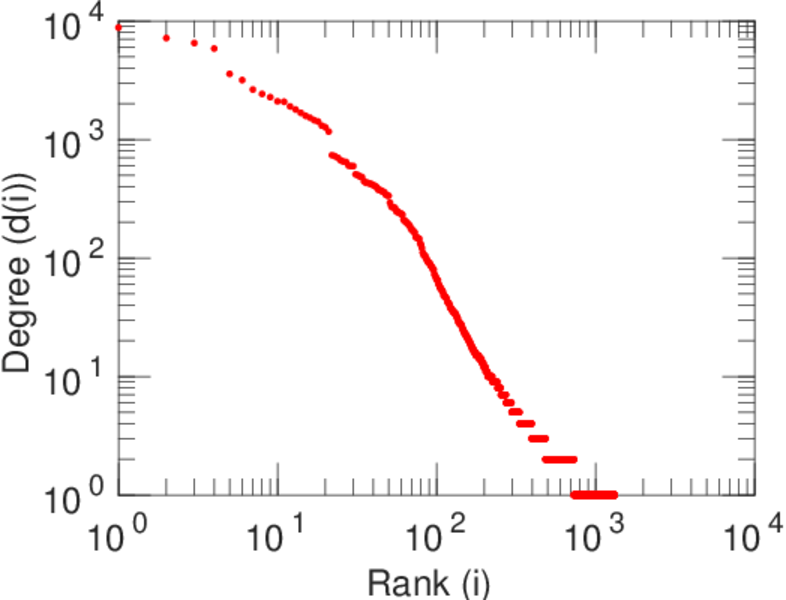
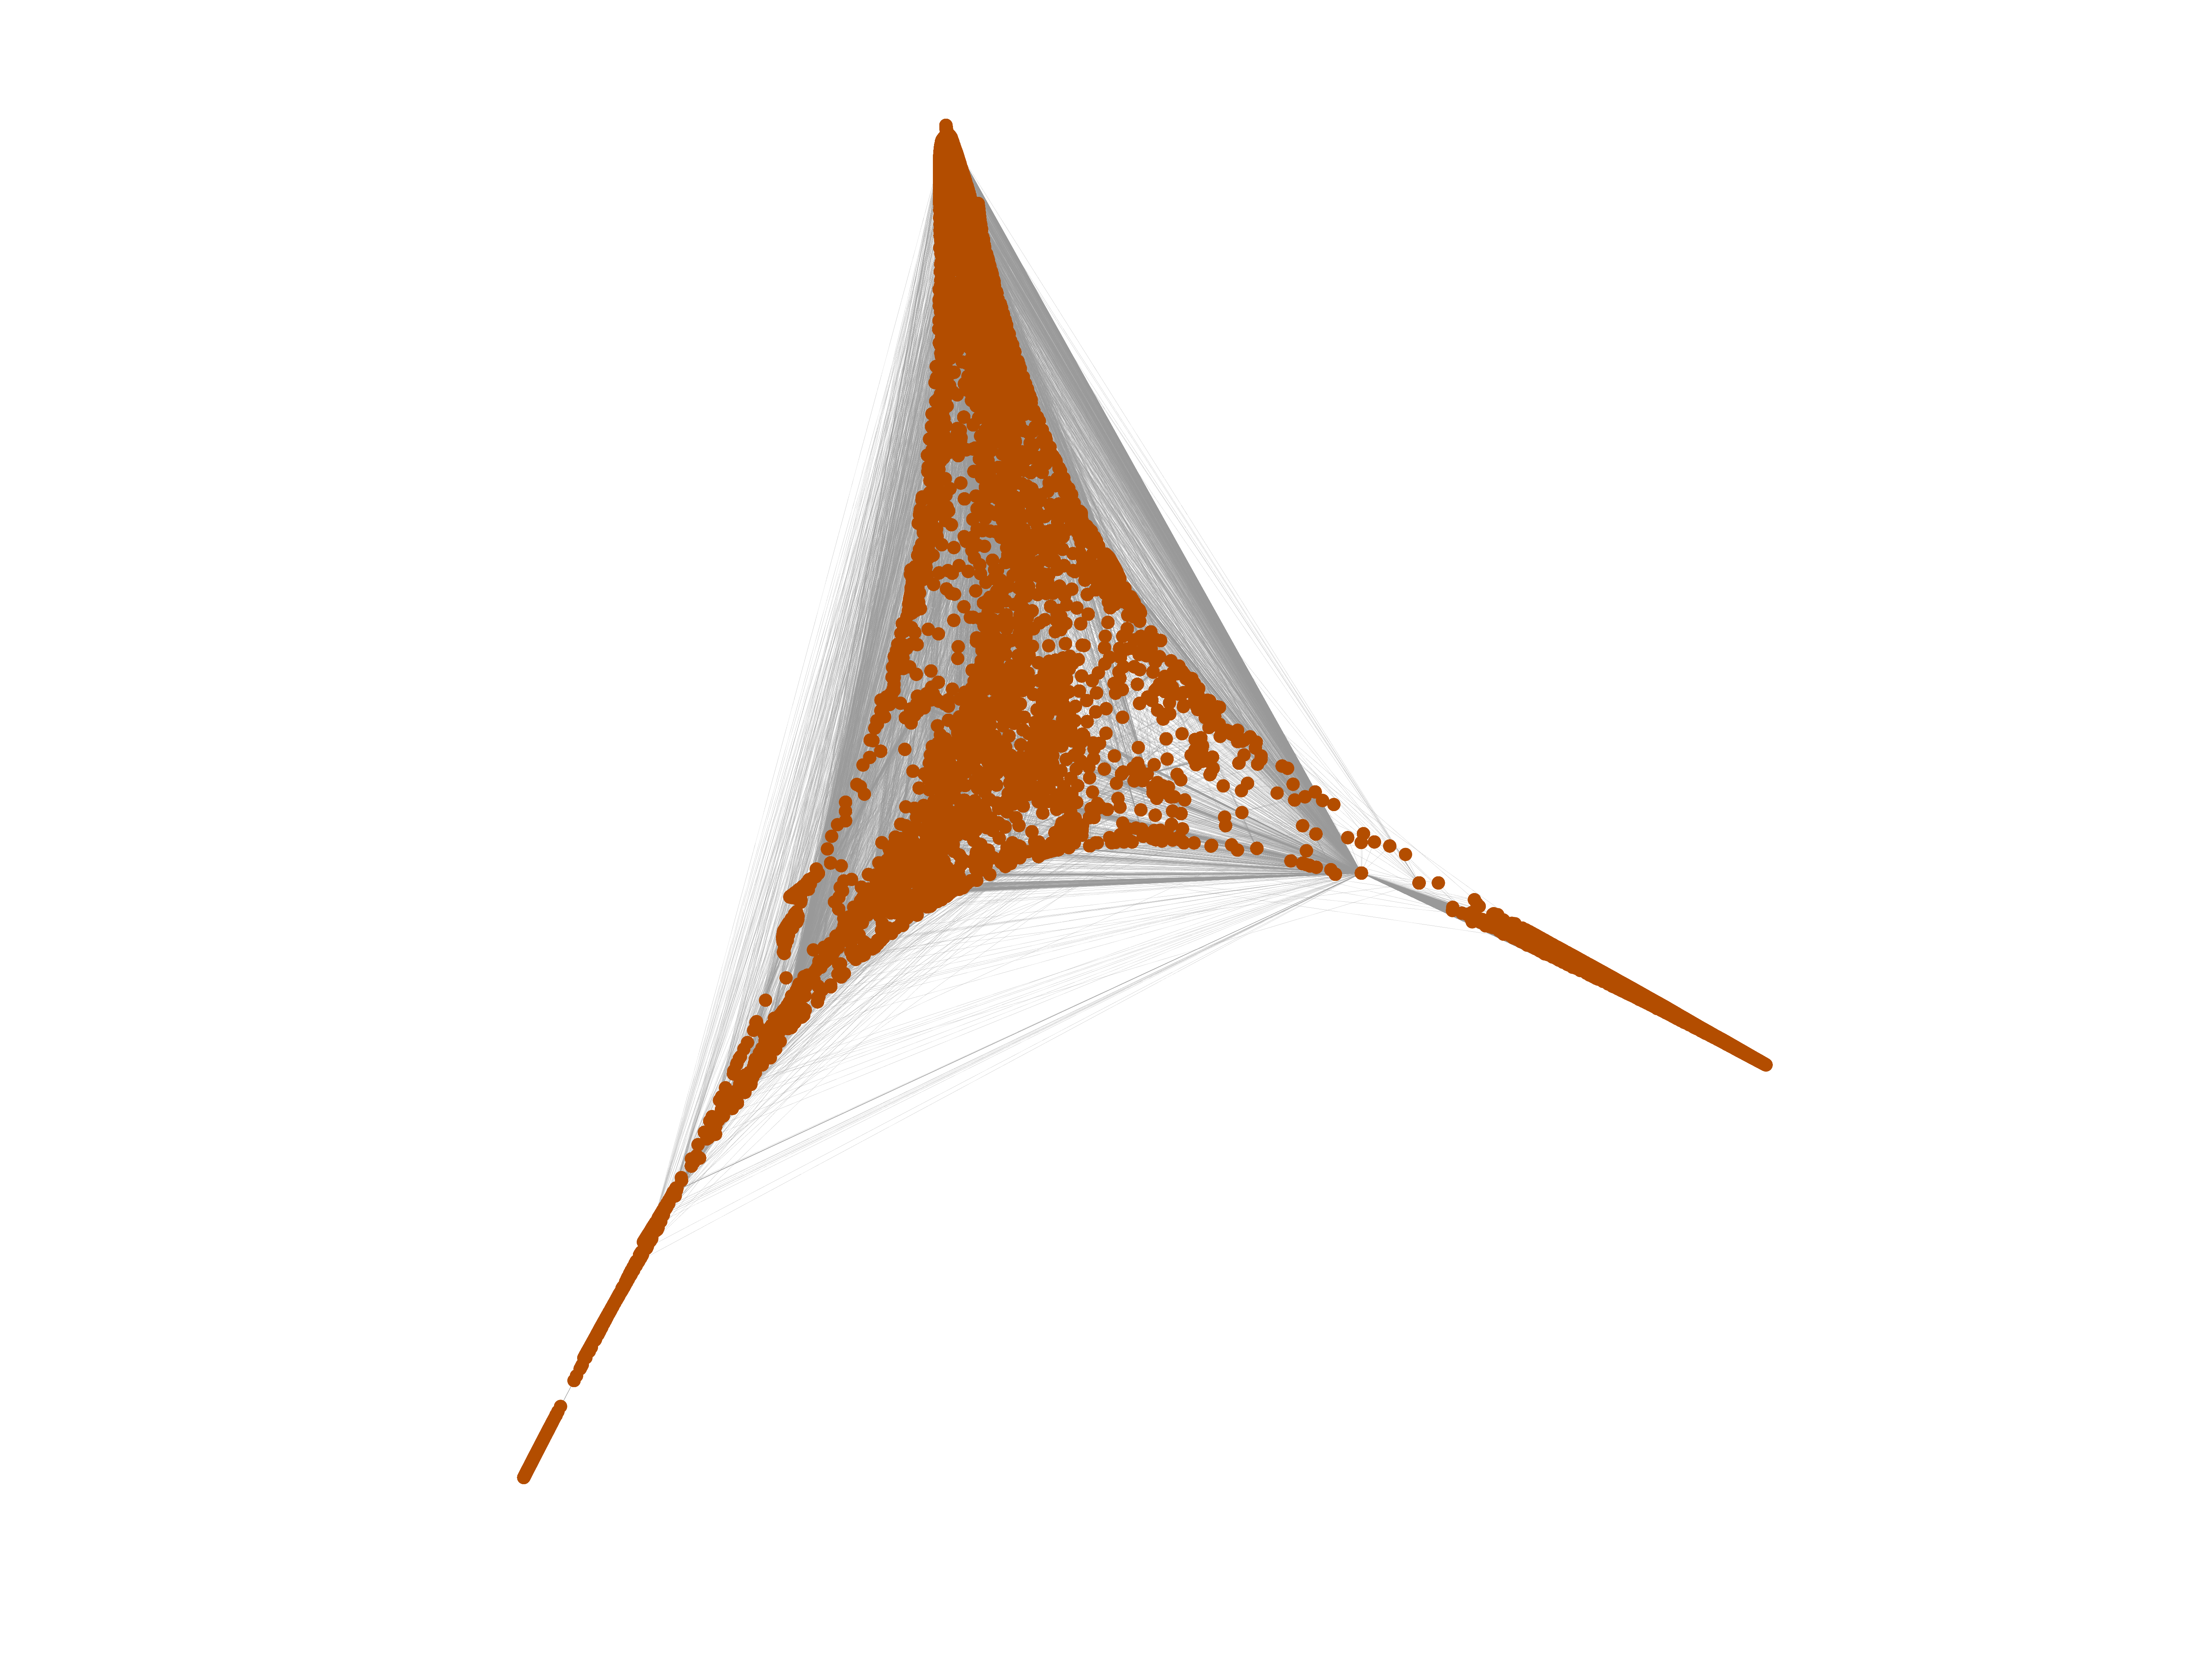
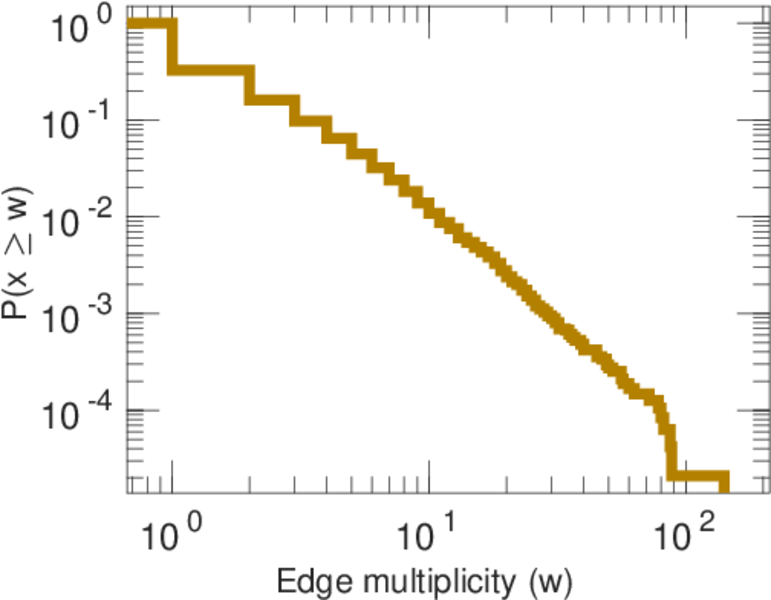
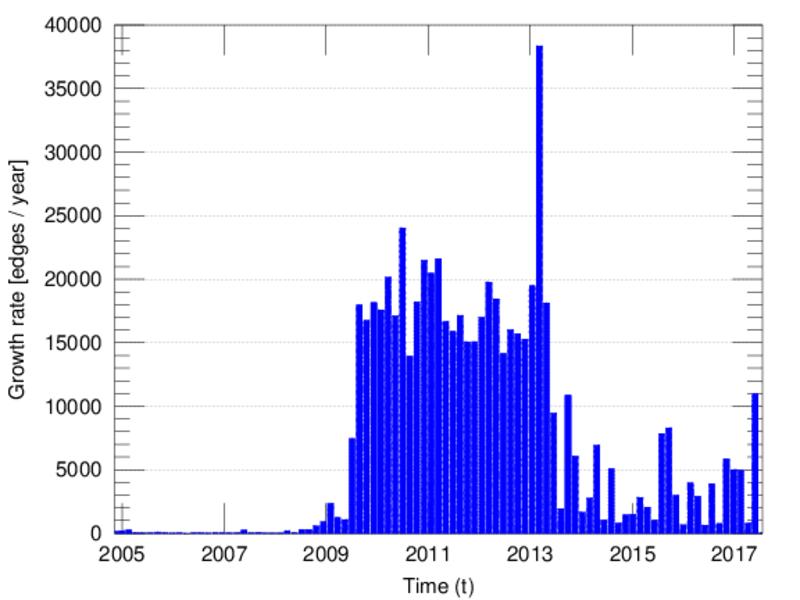
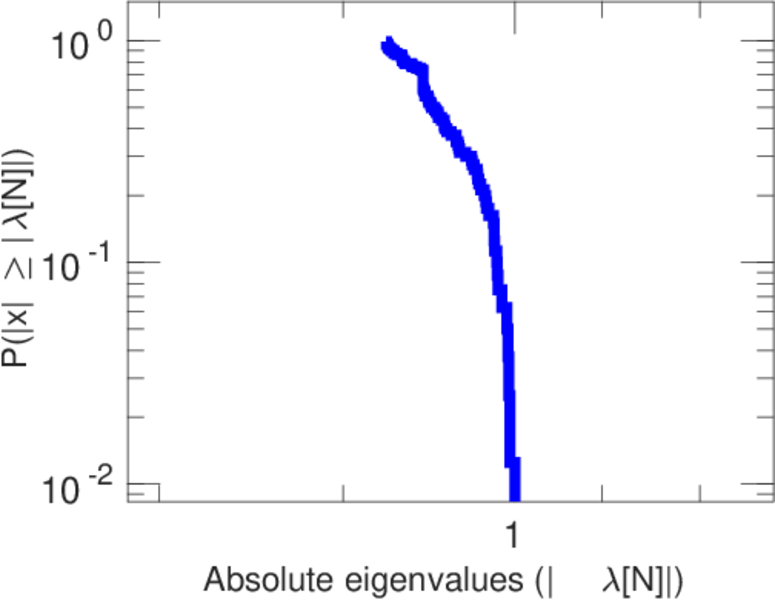
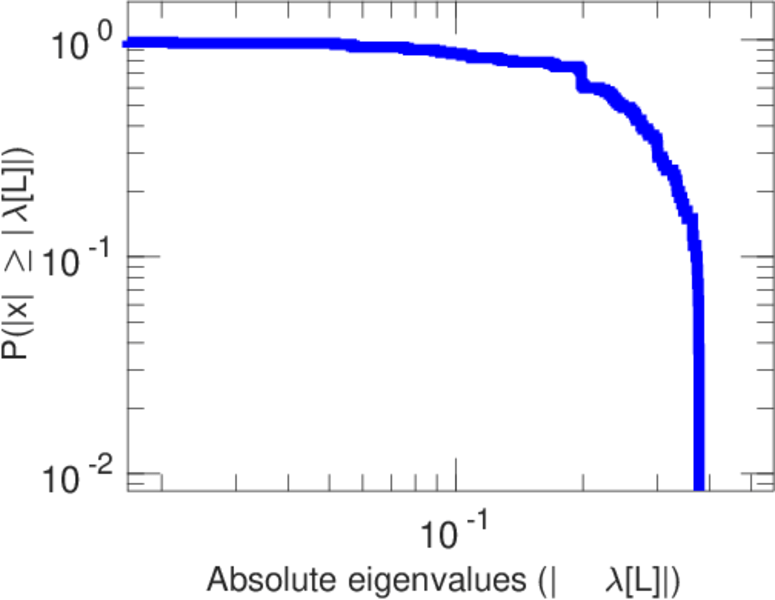
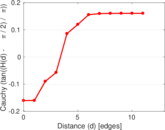
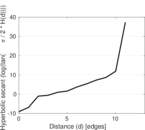
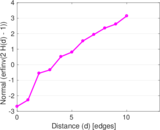
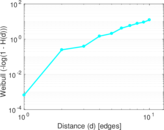
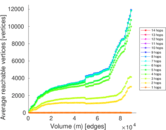
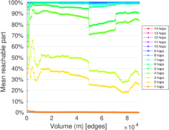
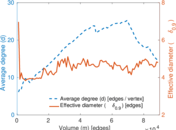
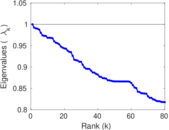
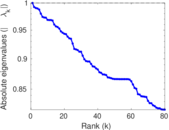
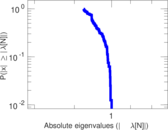
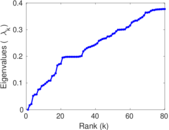
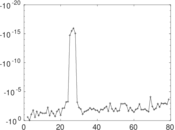
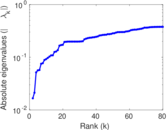
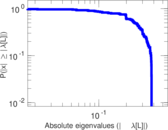
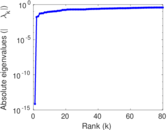
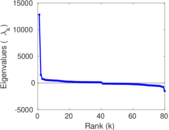
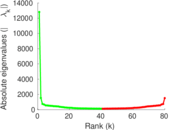
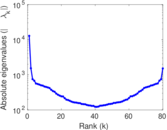
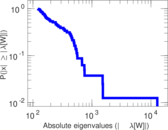
Plots


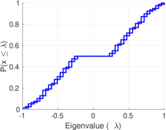
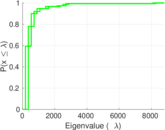
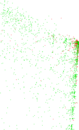

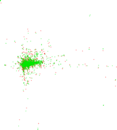


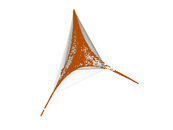


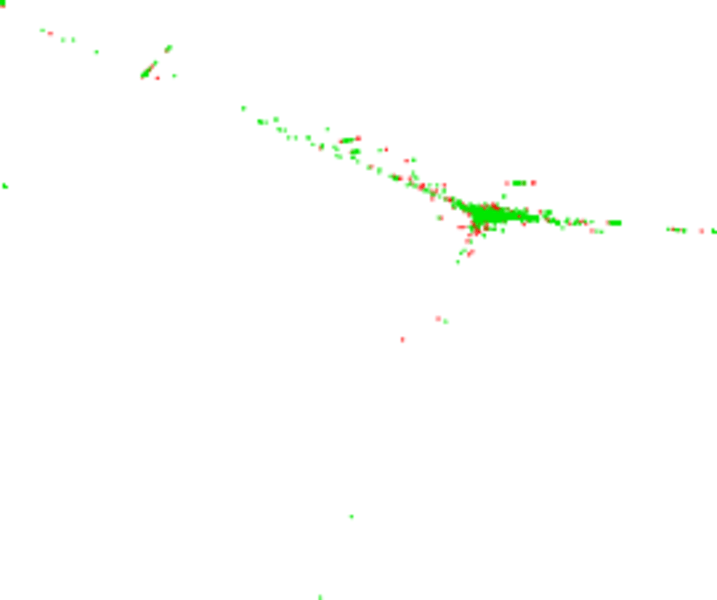
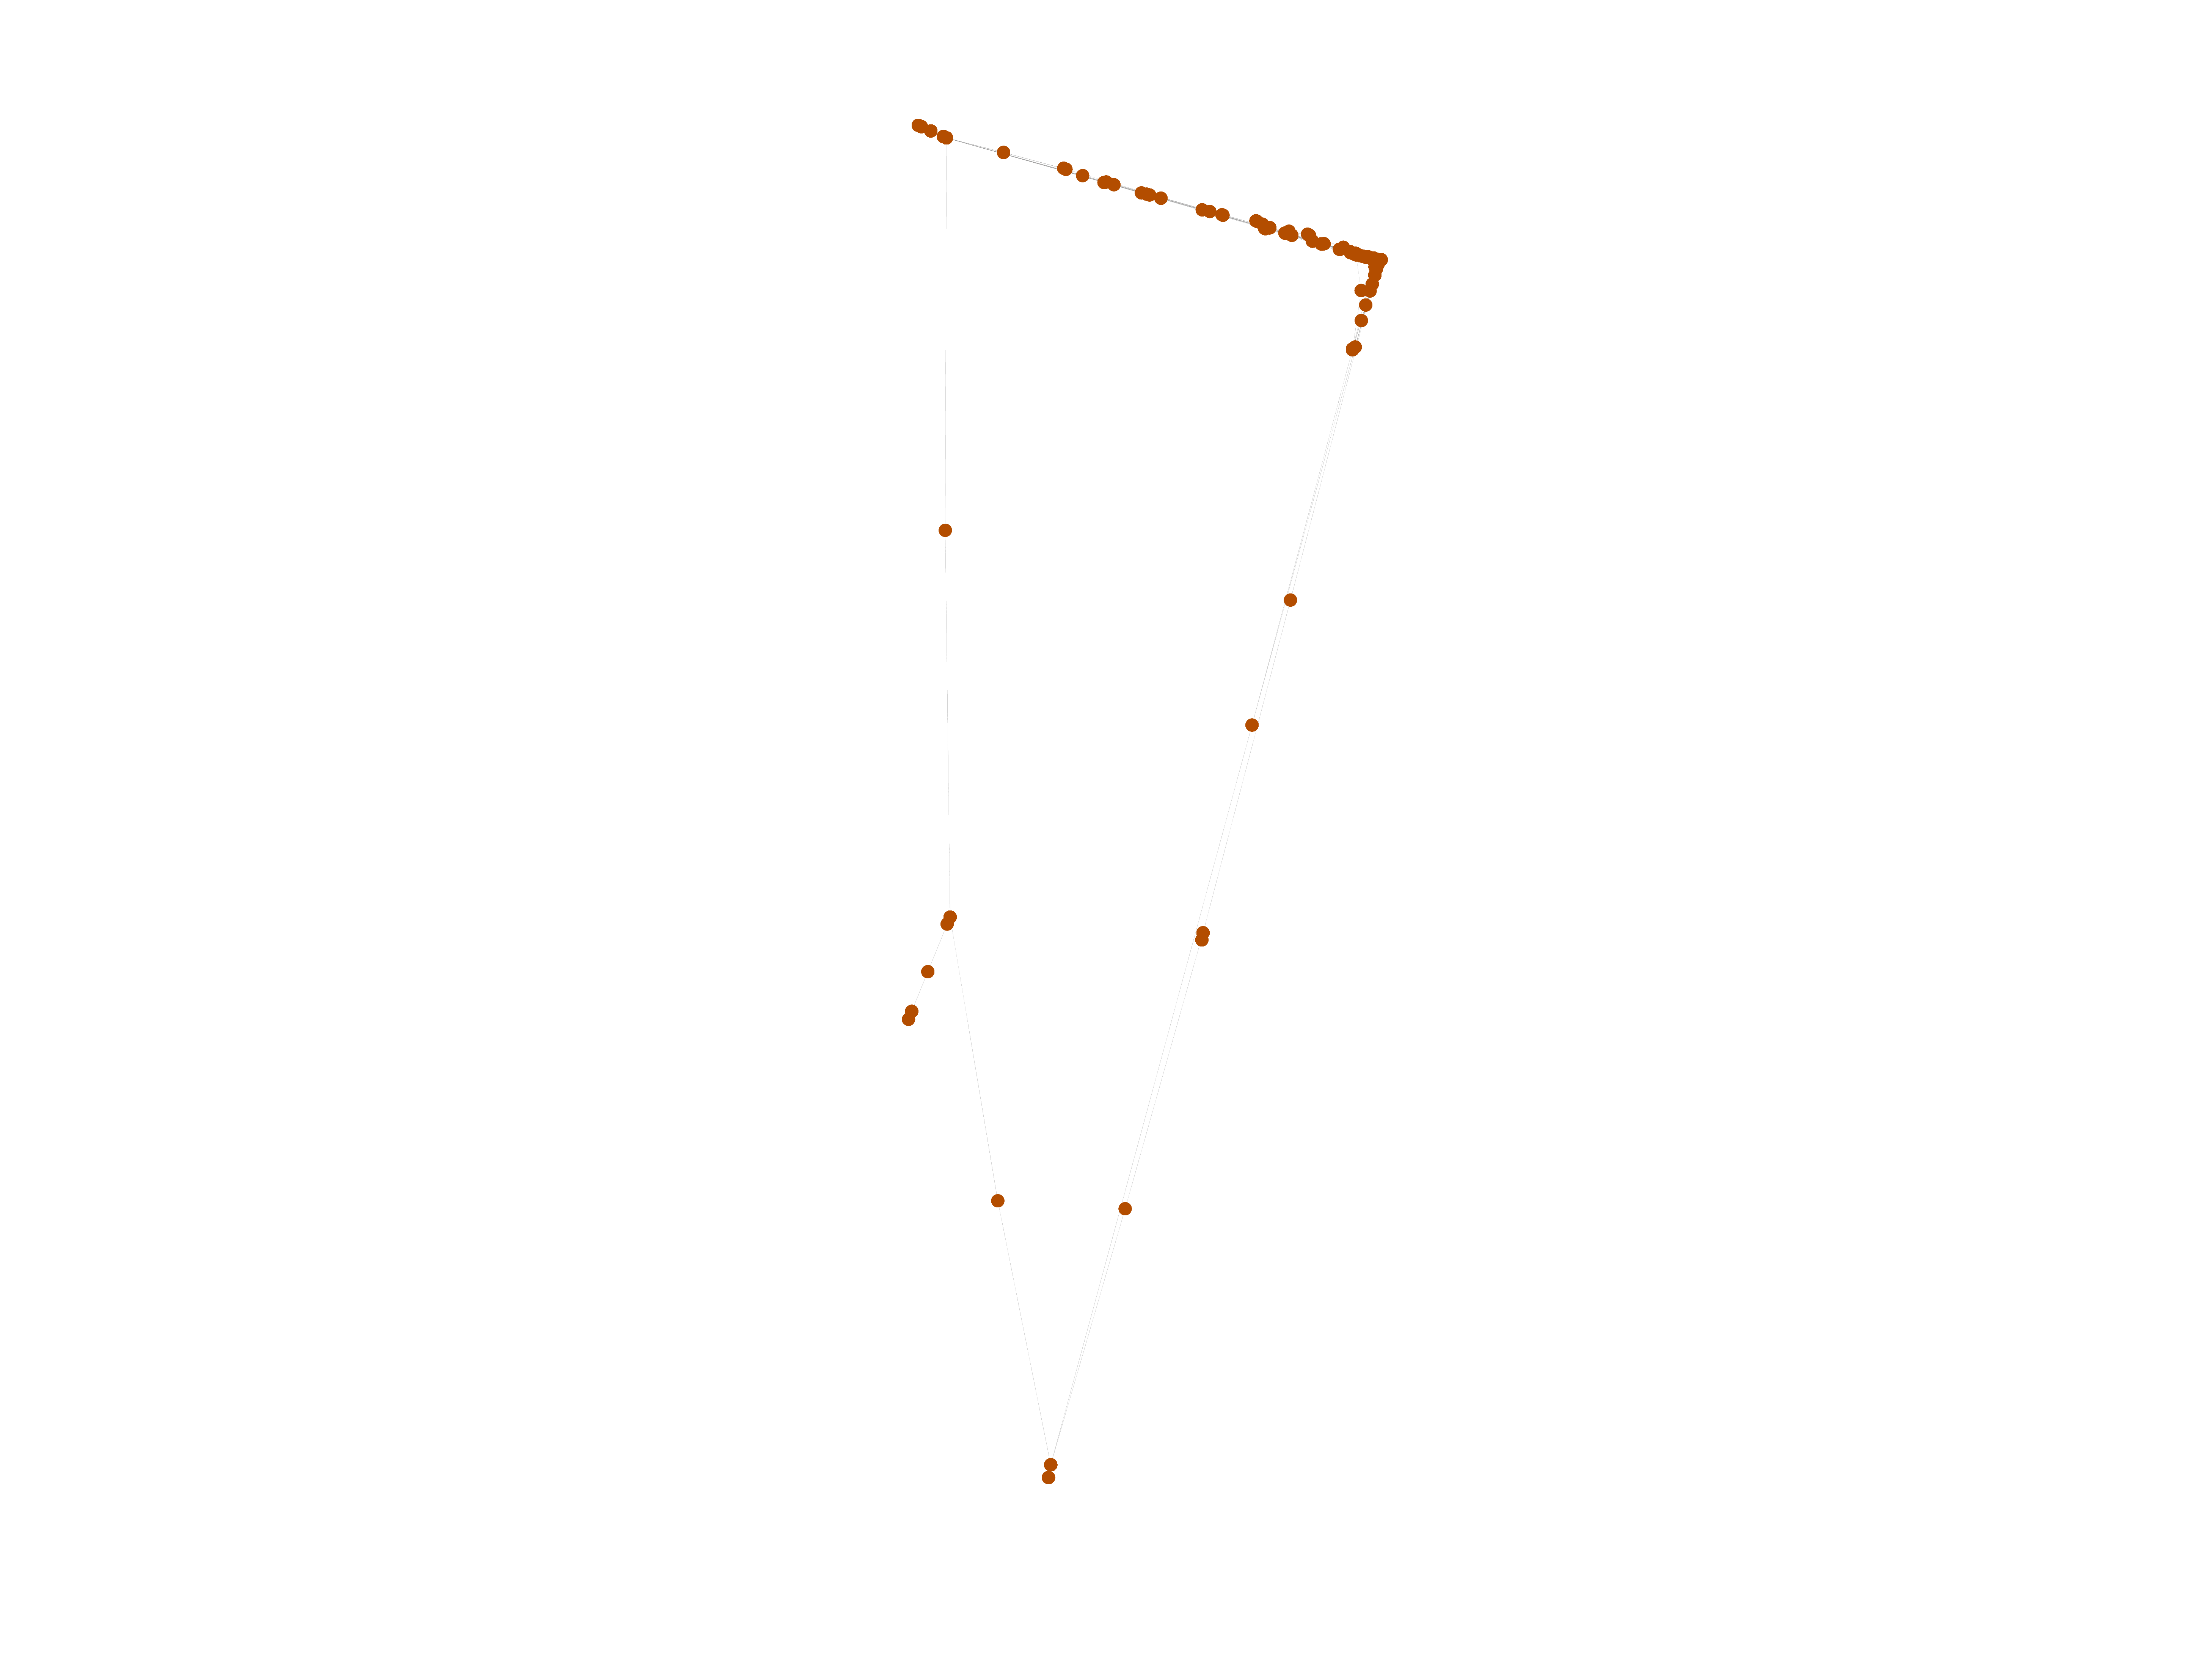
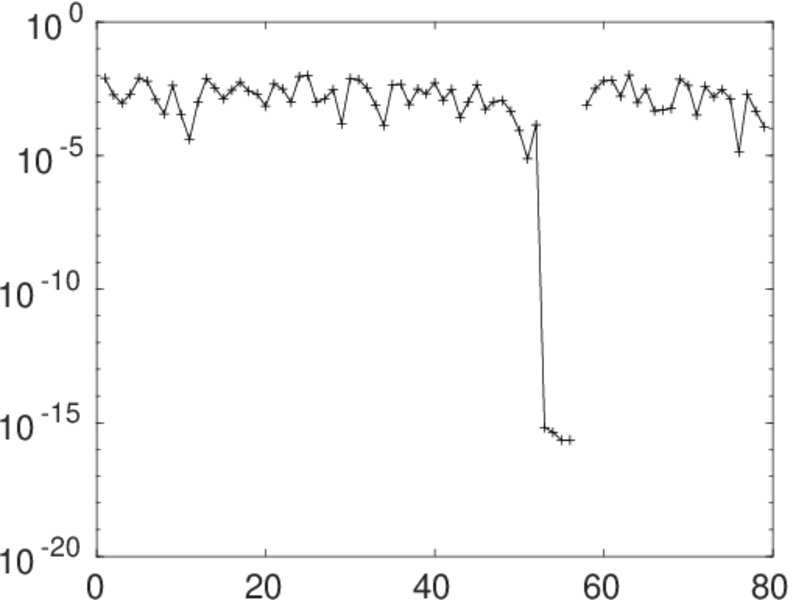
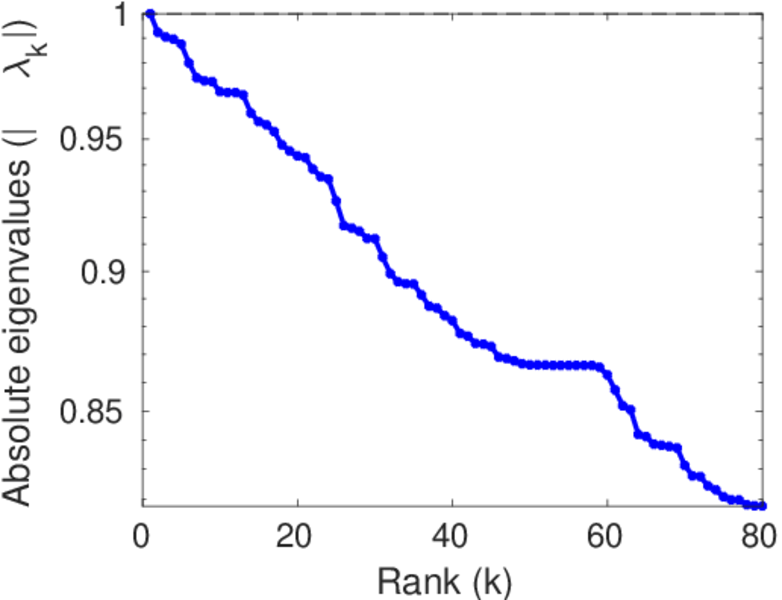
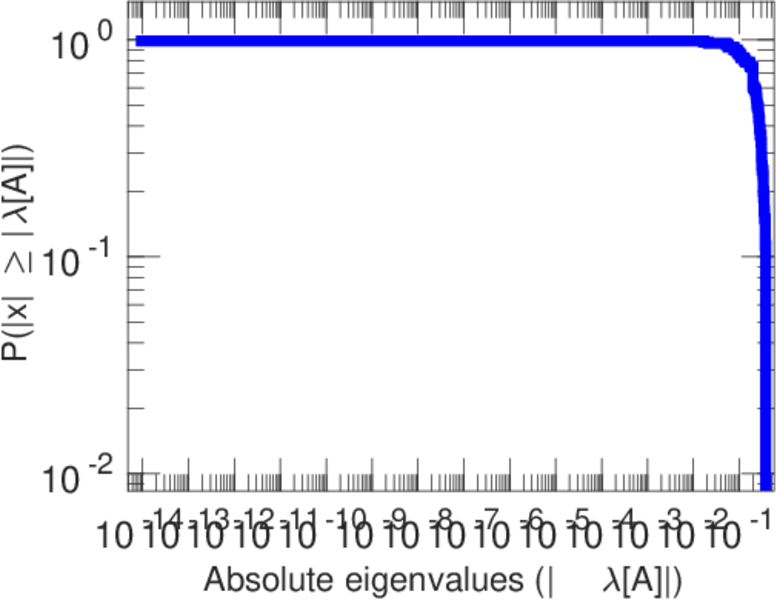
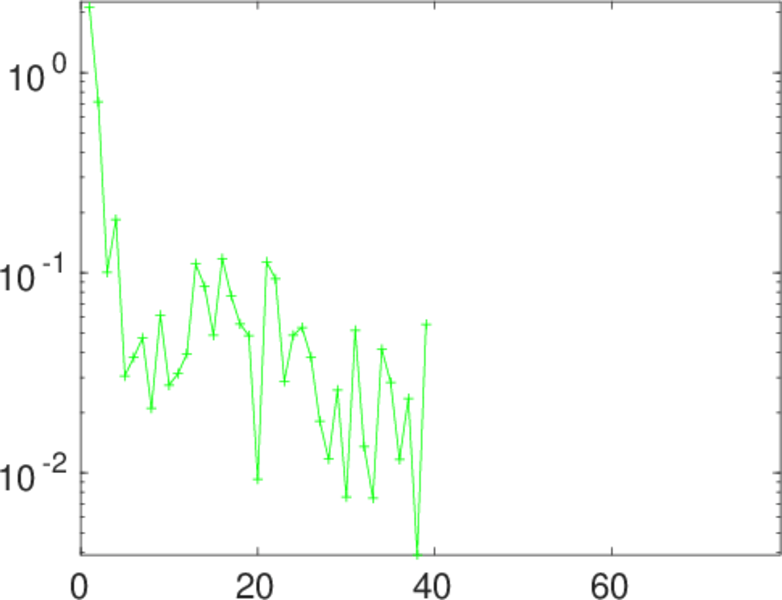
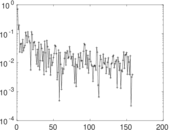
Matrix decompositions plots


Downloads
References
|
[1]
|
Jérôme Kunegis.
KONECT – The Koblenz Network Collection.
In Proc. Int. Conf. on World Wide Web Companion, pages
1343–1350, 2013.
[ http ]
|
|
[2]
|
Wikimedia Foundation.
Wikimedia downloads.
http://dumps.wikimedia.org/, January 2010.
|
 KONECT ‣ Networks ‣
Buy Me a Coffee
KONECT ‣ Networks ‣
Buy Me a Coffee