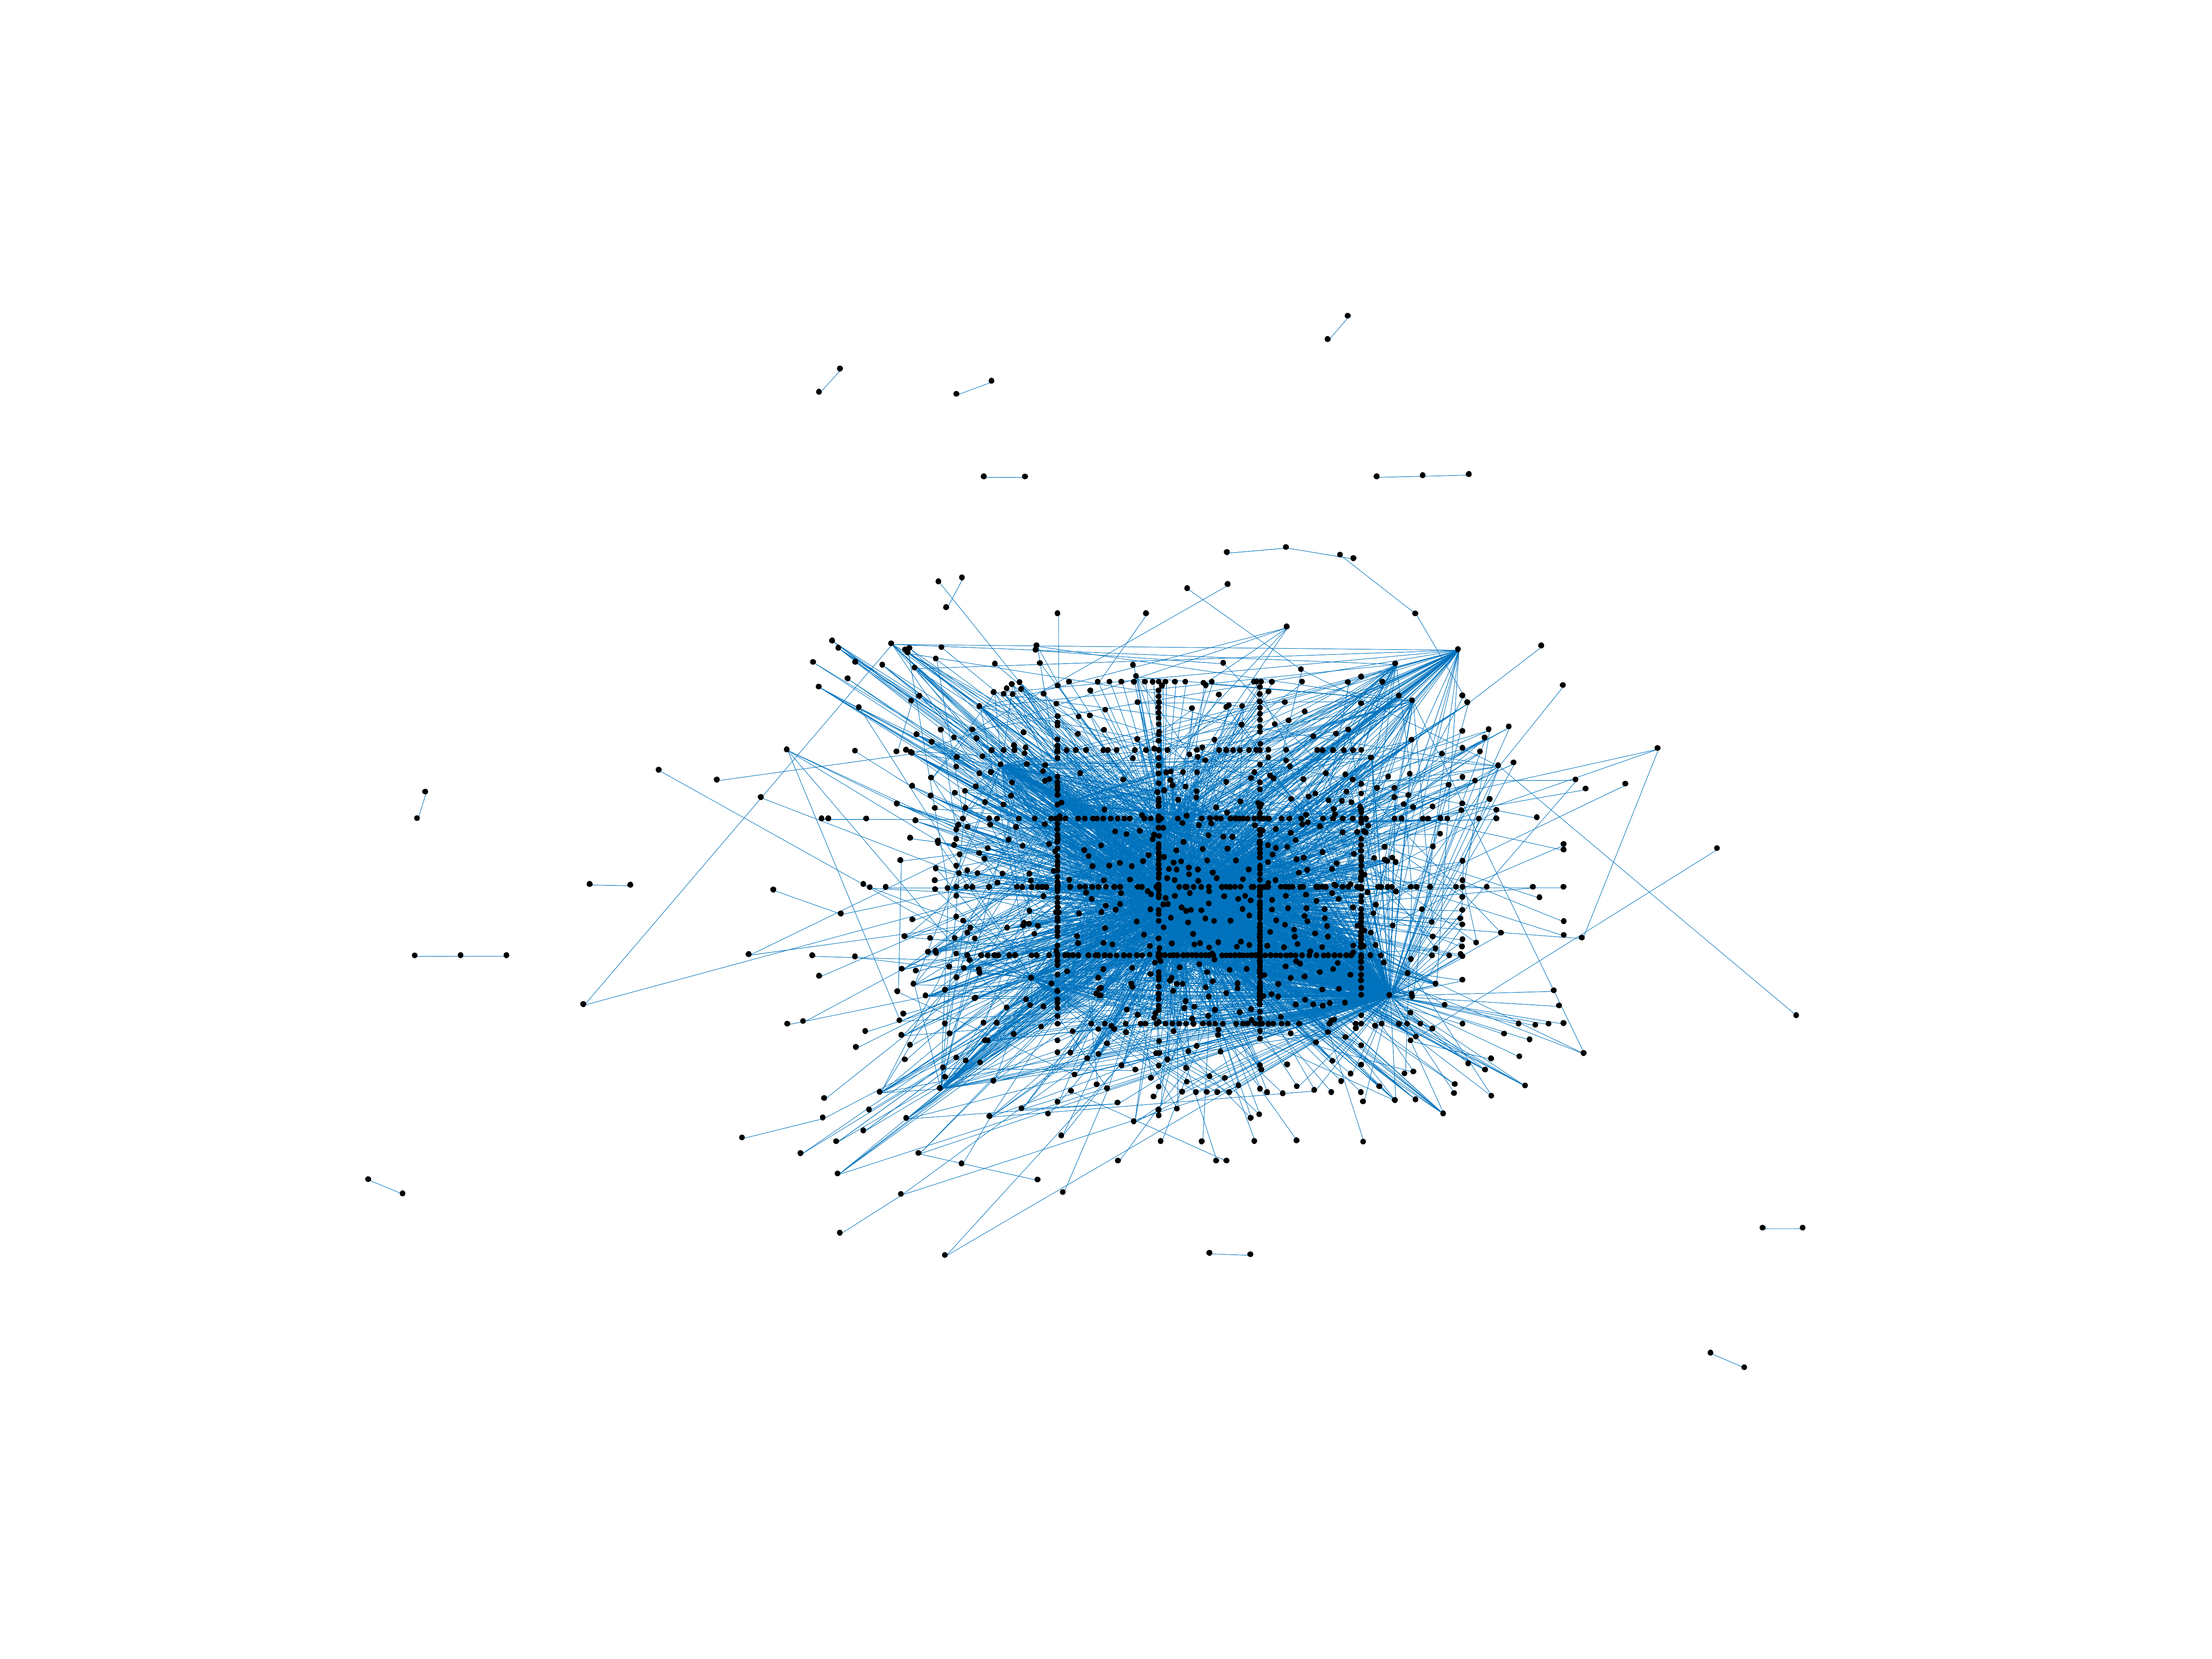
Wikipedia edits (ady)
This is the bipartite edit network of the Adyghe Wikipedia. It contains users
and pages from the Adyghe Wikipedia, connected by edit events. Each edge
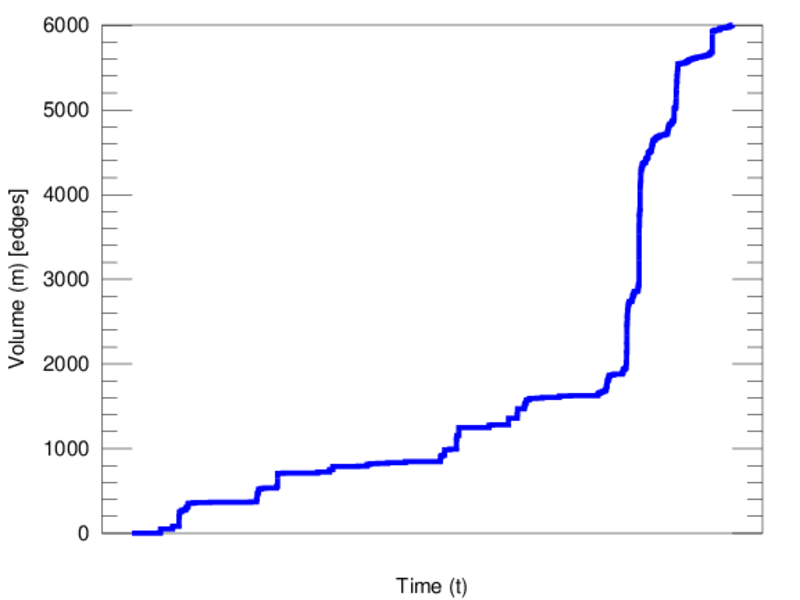
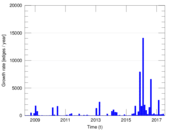
represents an edit. The dataset includes the timestamp of each edit.
Metadata
Statistics
| Size | n = | 1,254
|
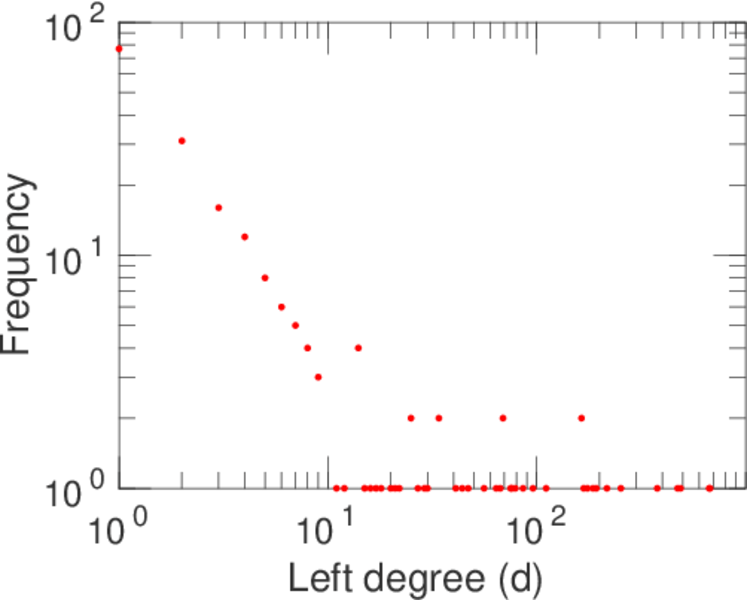
| Left size | n1 = | 209
|
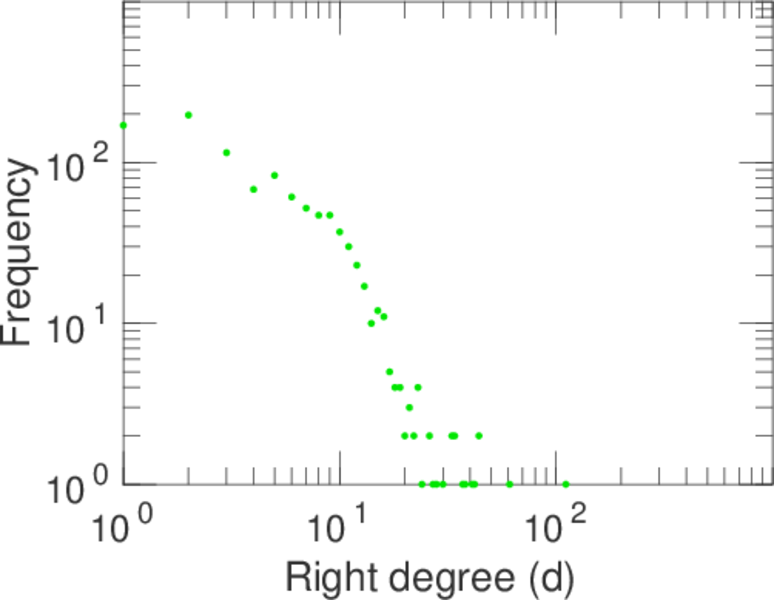
| Right size | n2 = | 1,045
|
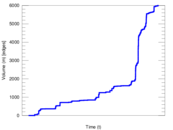
| Volume | m = | 6,003
|
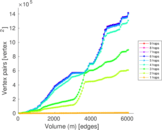
| Unique edge count | m̿ = | 3,969
|
| Wedge count | s = | 515,670
|
| Claw count | z = | 79,797,409
|
| Cross count | x = | 11,228,797,952
|
| Square count | q = | 337,370
|
| 4-Tour count | T4 = | 4,776,850
|
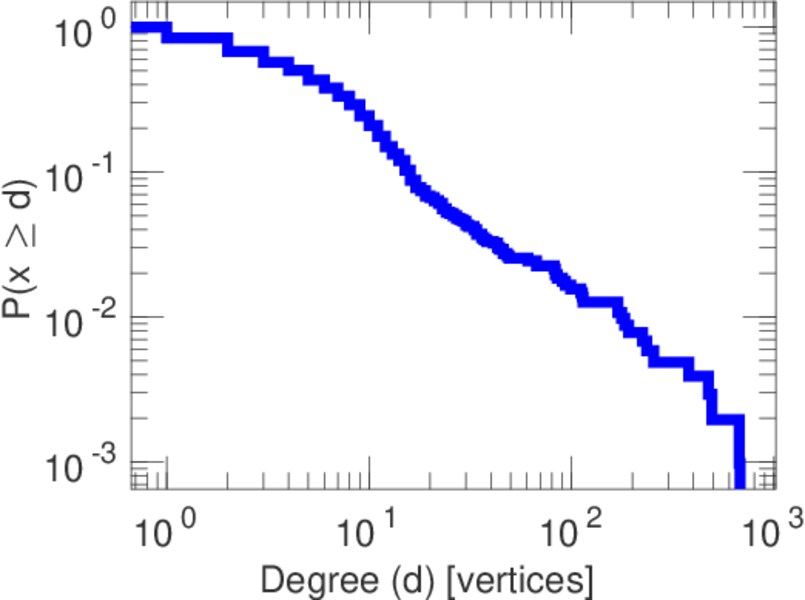
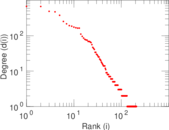
| Maximum degree | dmax = | 676
|
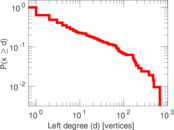
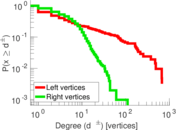
| Maximum left degree | d1max = | 676
|
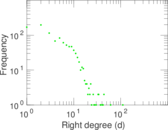
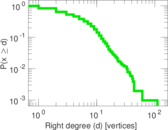
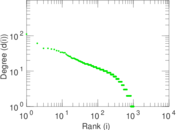
| Maximum right degree | d2max = | 111
|
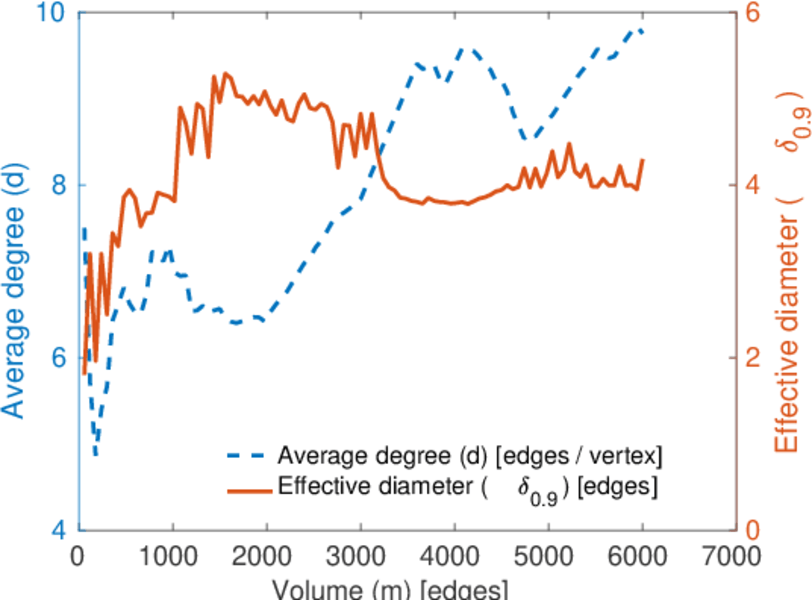
| Average degree | d = | 9.574 16
|
| Average left degree | d1 = | 28.722 5
|
| Average right degree | d2 = | 5.744 50
|
| Fill | p = | 0.018 172 7
|
| Average edge multiplicity | m̃ = | 1.512 47
|
| Size of LCC | N = | 1,190
|
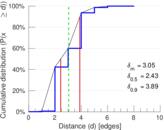
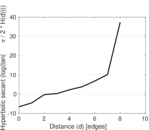
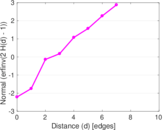
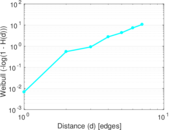
| Diameter | δ = | 8
|
| 50-Percentile effective diameter | δ0.5 = | 2.434 22
|
| 90-Percentile effective diameter | δ0.9 = | 3.892 18
|
| Median distance | δM = | 3
|
| Mean distance | δm = | 3.046 81
|
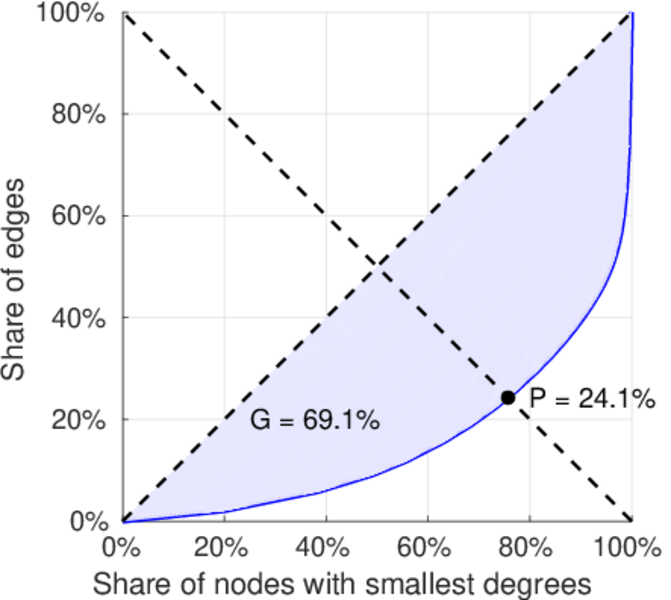
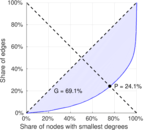
| Gini coefficient | G = | 0.694 123
|
| Balanced inequality ratio | P = | 0.239 963
|
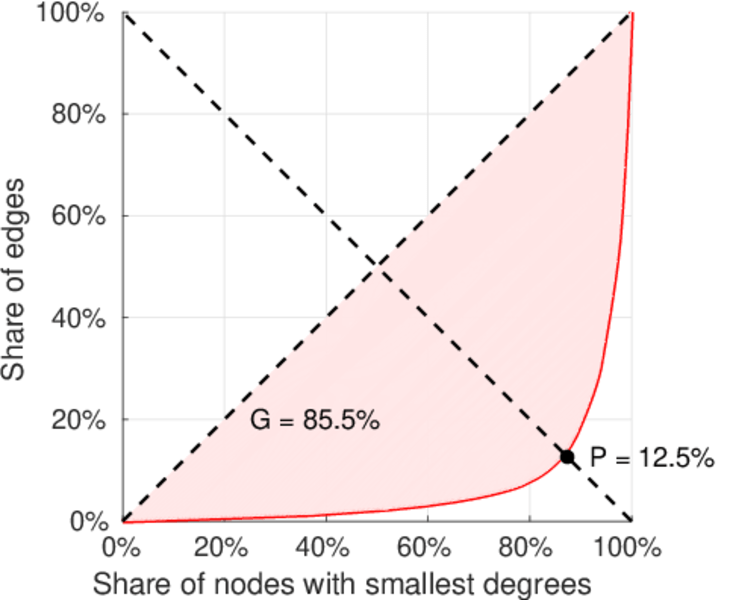
| Left balanced inequality ratio | P1 = | 0.124 771
|
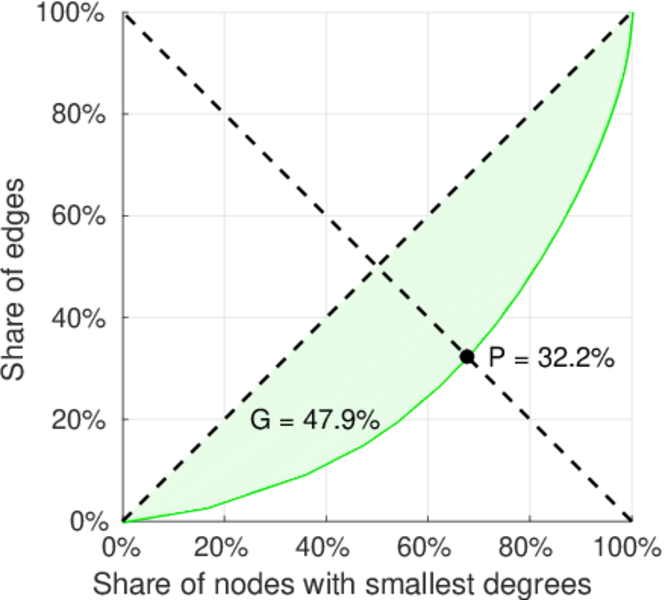
| Right balanced inequality ratio | P2 = | 0.321 839
|
| Relative edge distribution entropy | Her = | 0.812 040
|
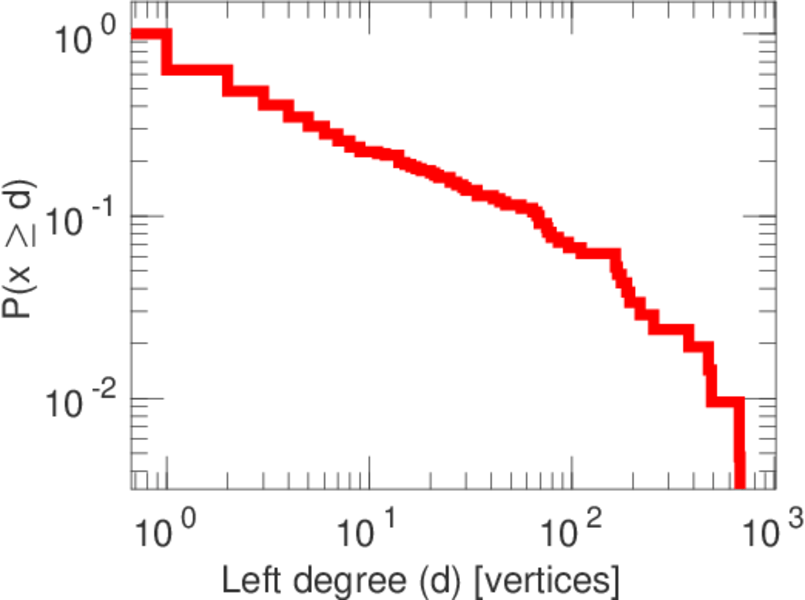
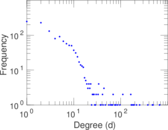
| Power law exponent | γ = | 1.913 96
|
| Tail power law exponent | γt = | 2.701 00
|
| Tail power law exponent with p | γ3 = | 2.701 00
|
| p-value | p = | 0.000 00
|
| Left tail power law exponent with p | γ3,1 = | 1.621 00
|
| Left p-value | p1 = | 0.221 000
|
| Right tail power law exponent with p | γ3,2 = | 3.901 00
|
| Right p-value | p2 = | 0.067 000 0
|
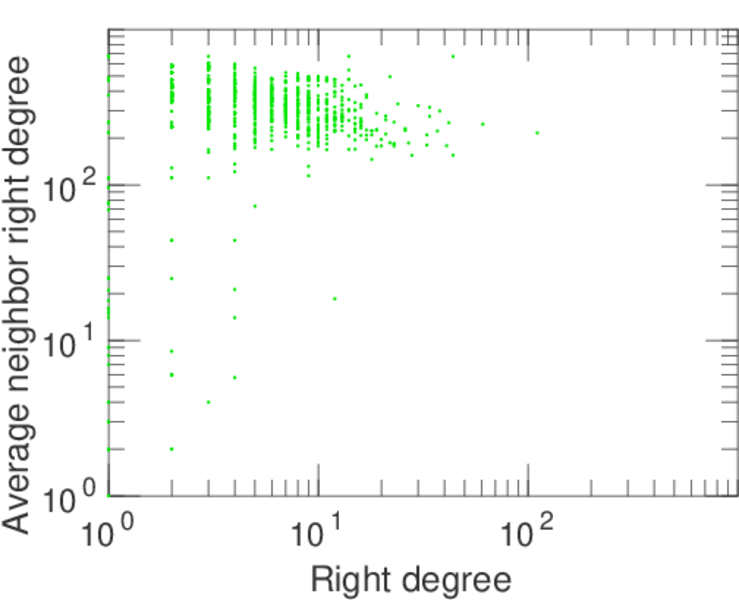
| Degree assortativity | ρ = | −0.174 358
|
| Degree assortativity p-value | pρ = | 1.834 63 × 10−28
|
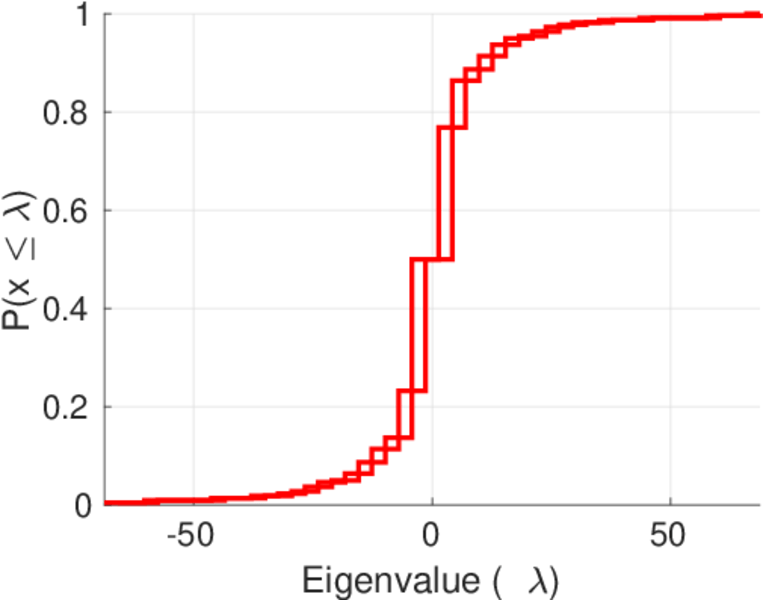
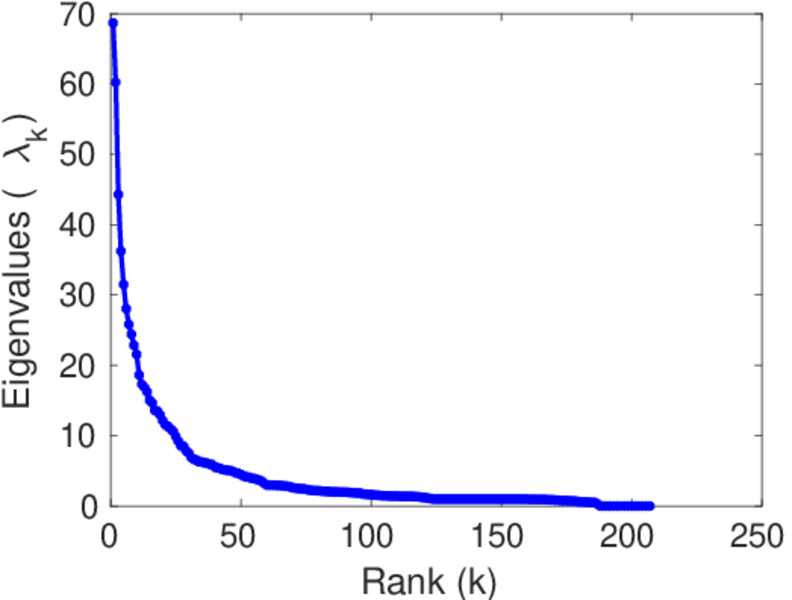
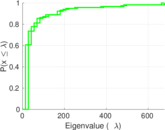
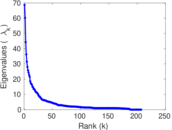
| Spectral norm | α = | 68.678 7
|
| Algebraic connectivity | a = | 0.312 324
|
| Spectral separation | |λ1[A] / λ2[A]| = | 1.140 08
|
| Controllability | C = | 857
|
| Relative controllability | Cr = | 0.696 182
|
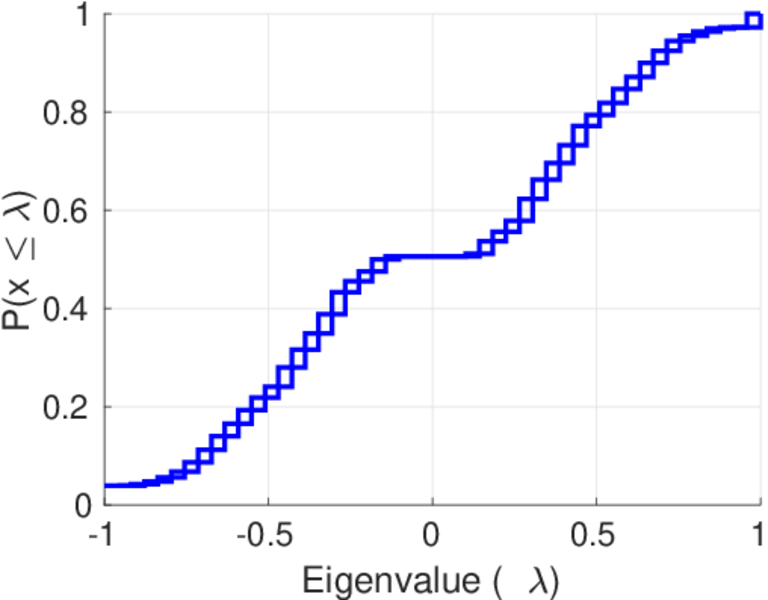
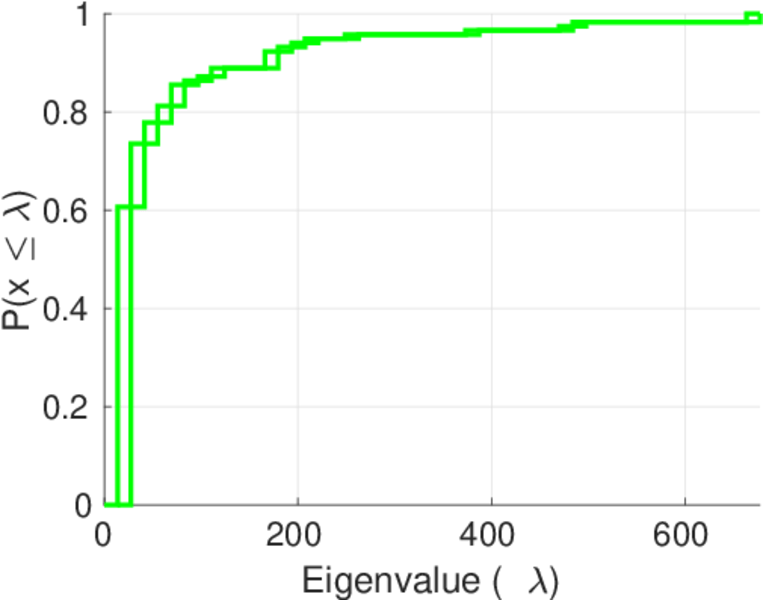
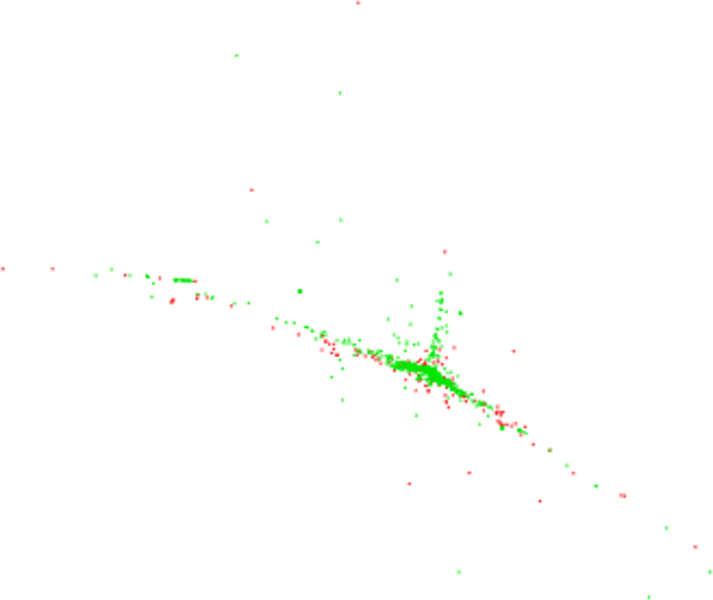
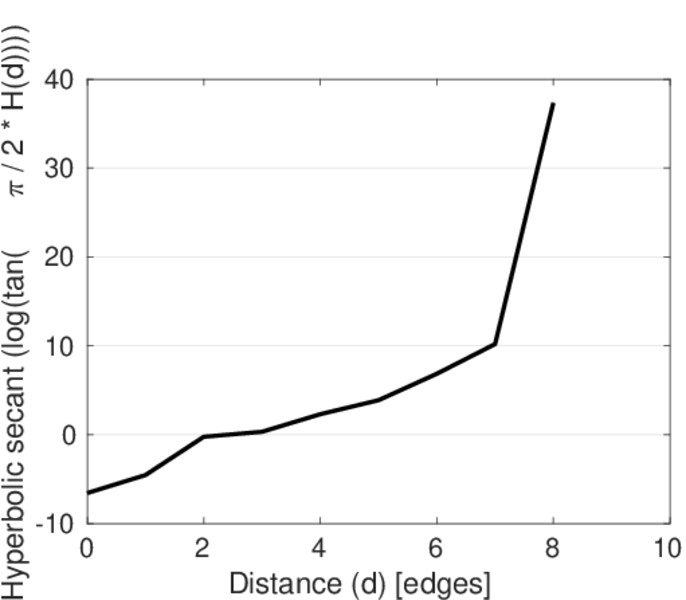
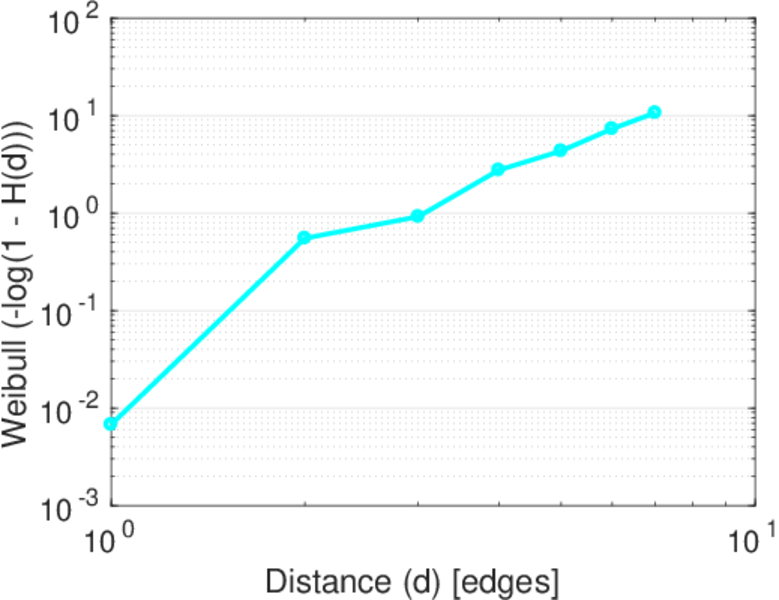
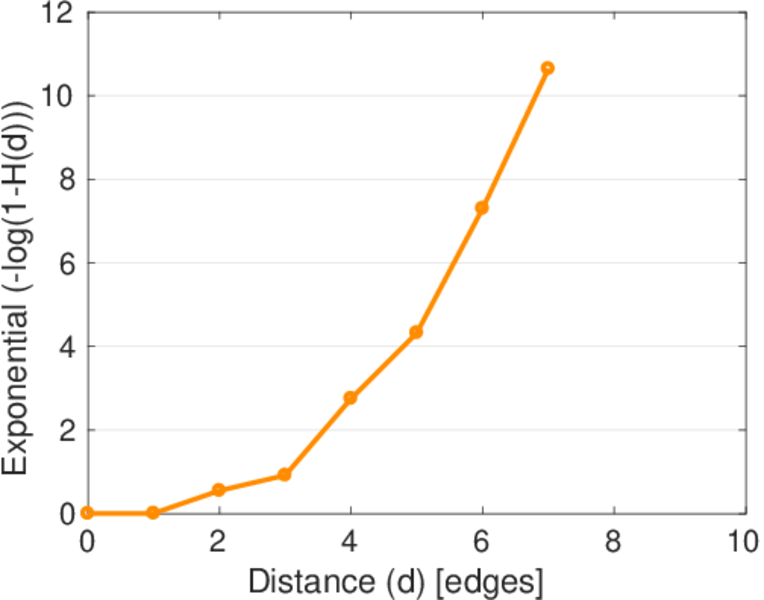
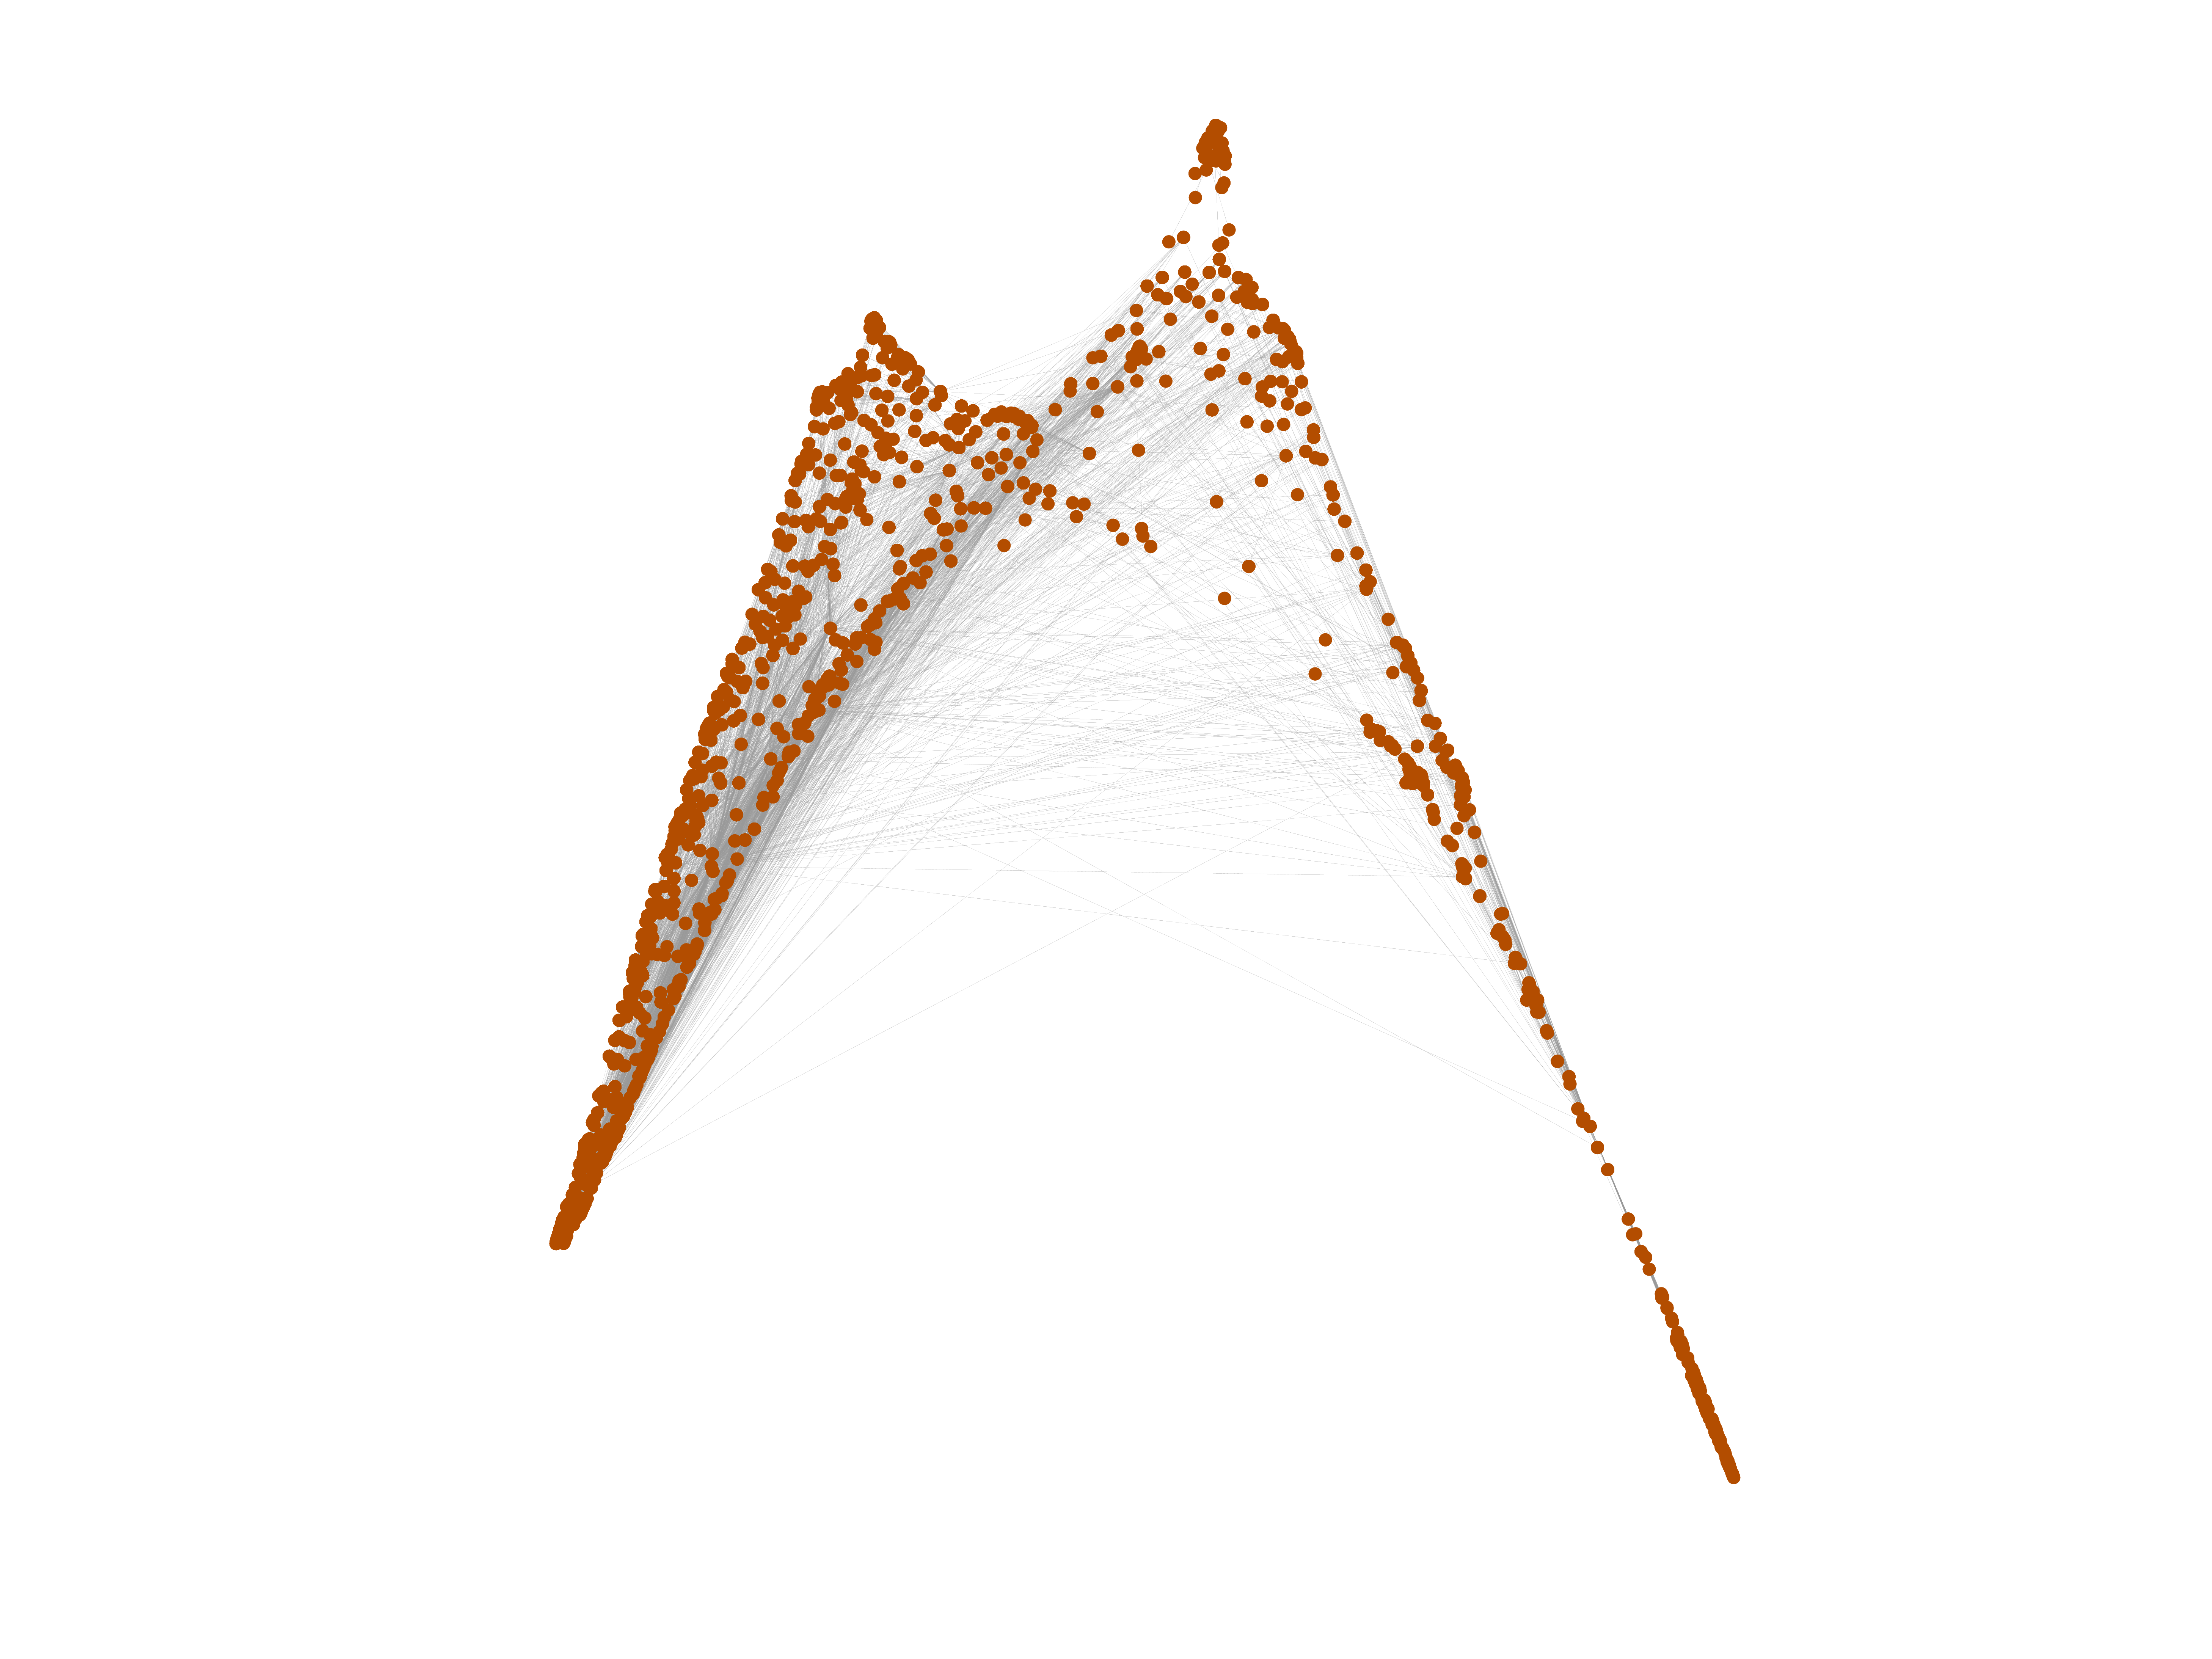
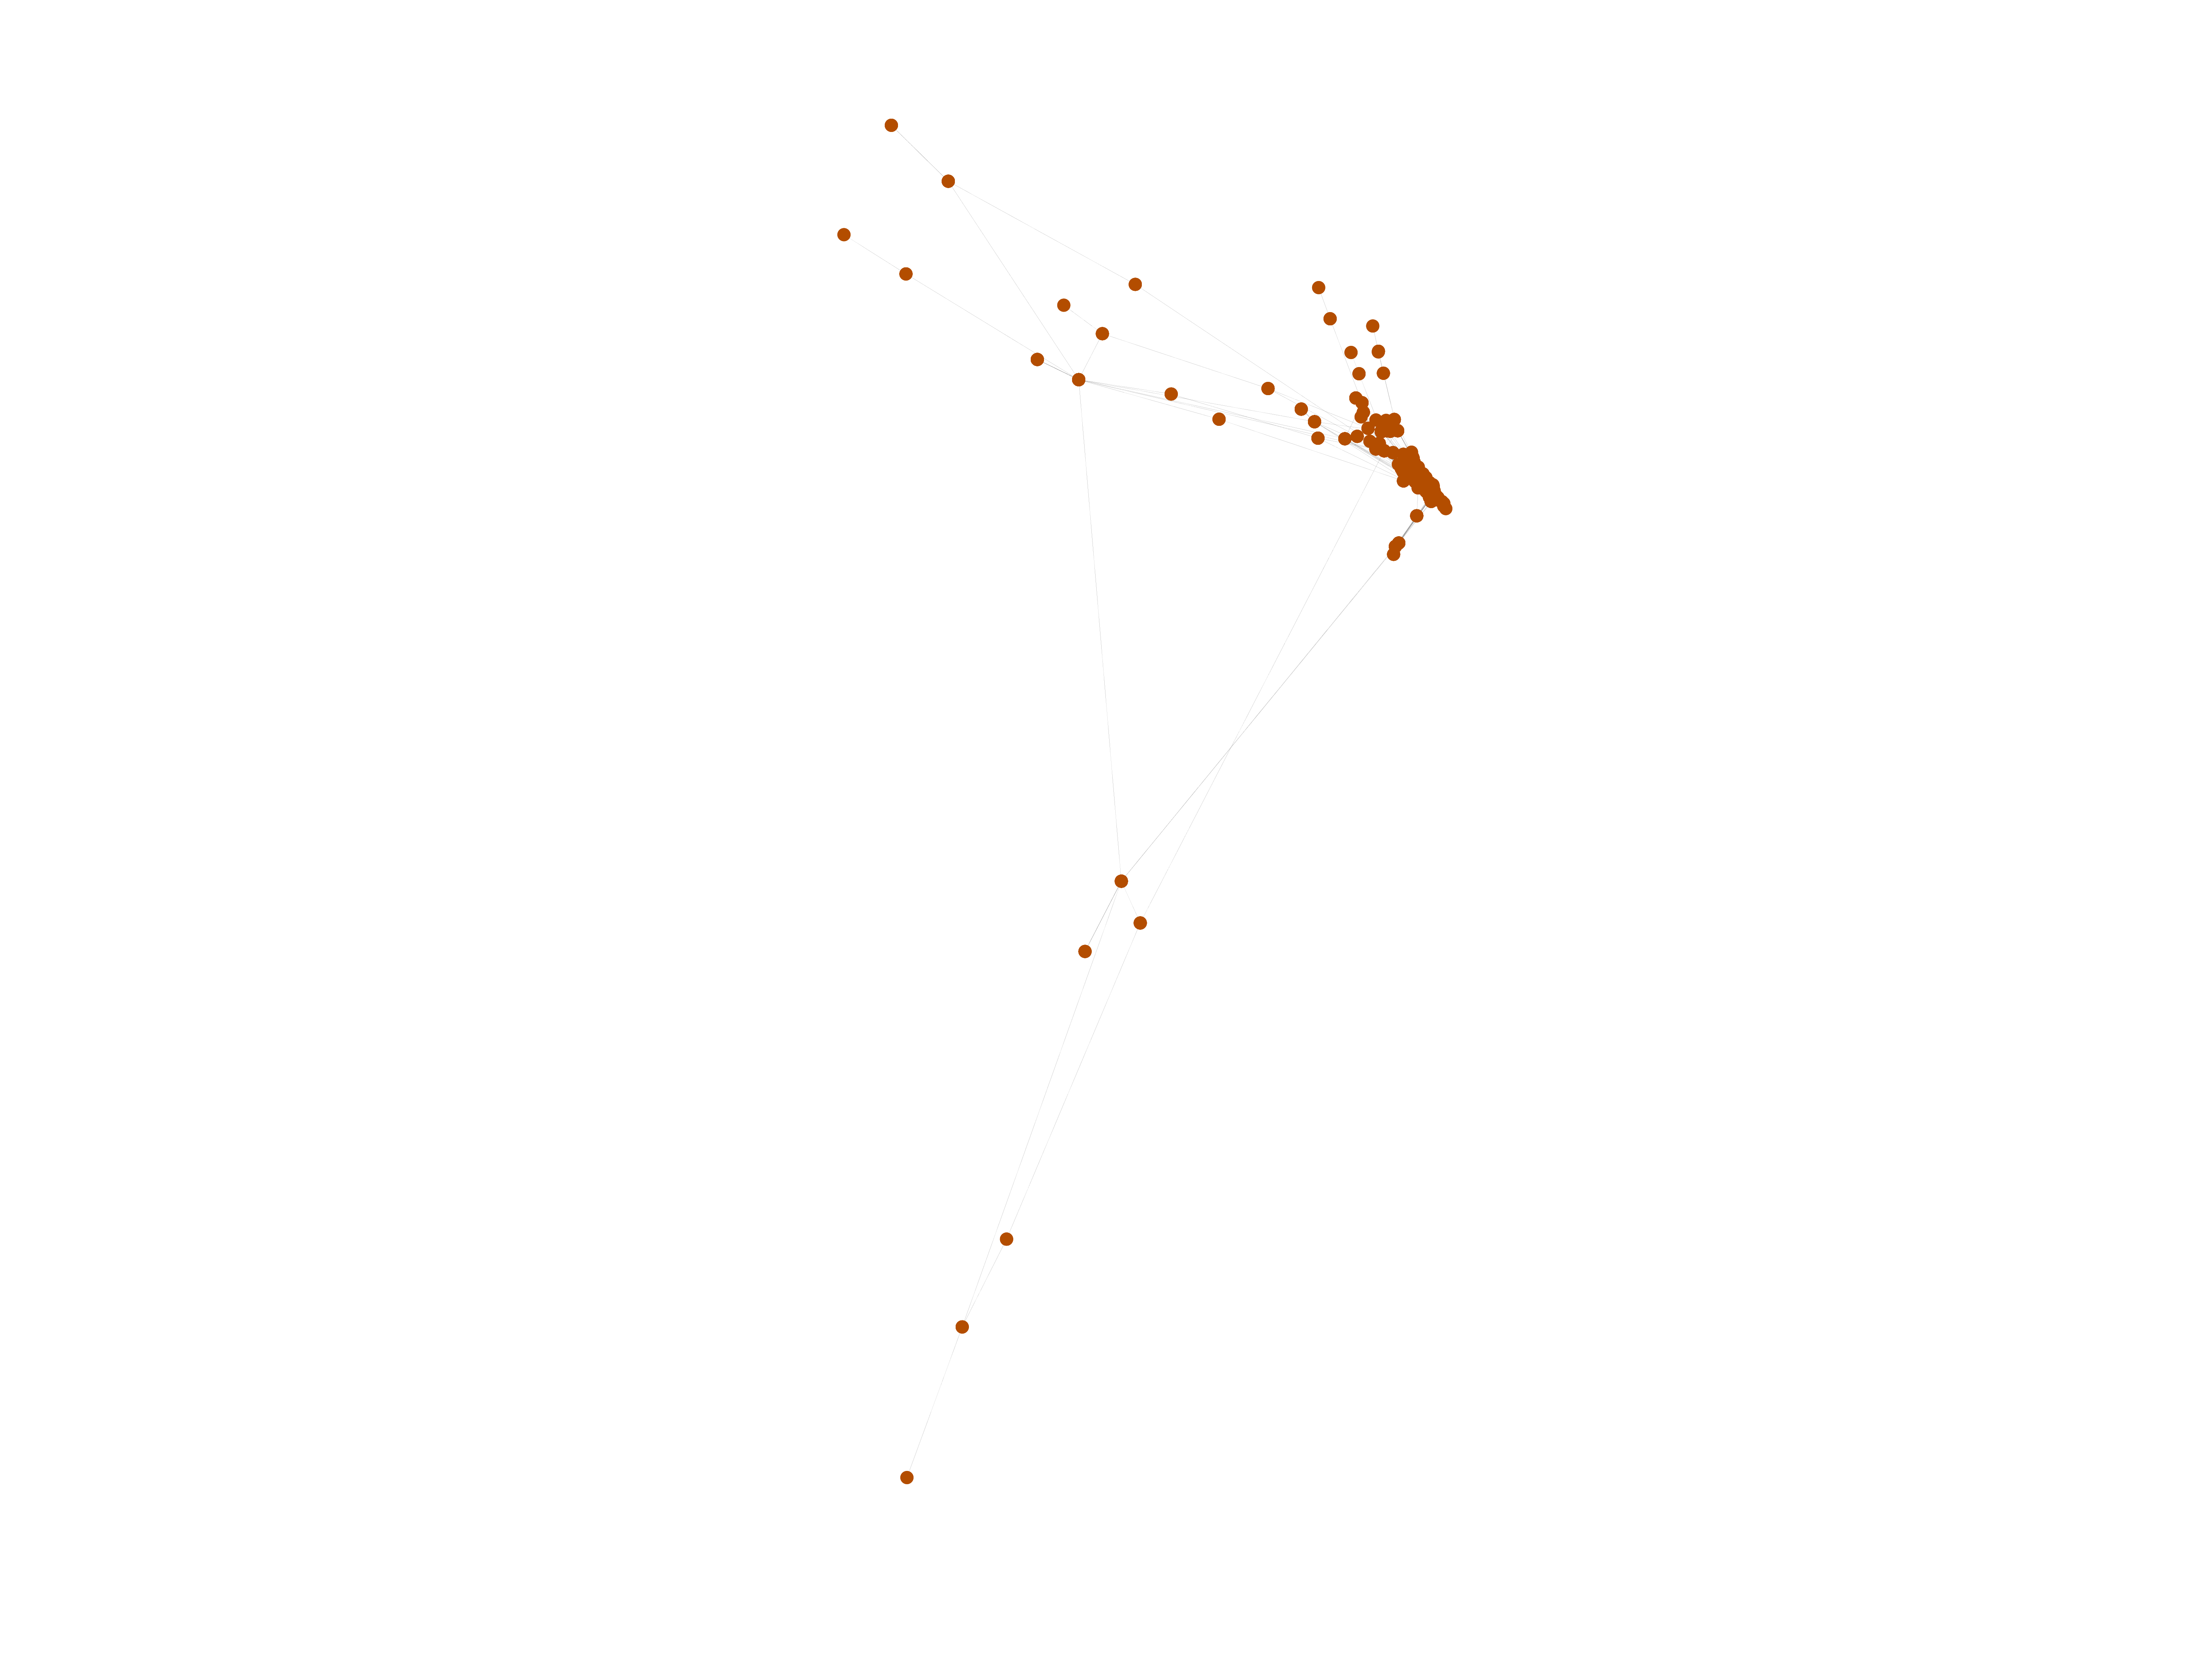
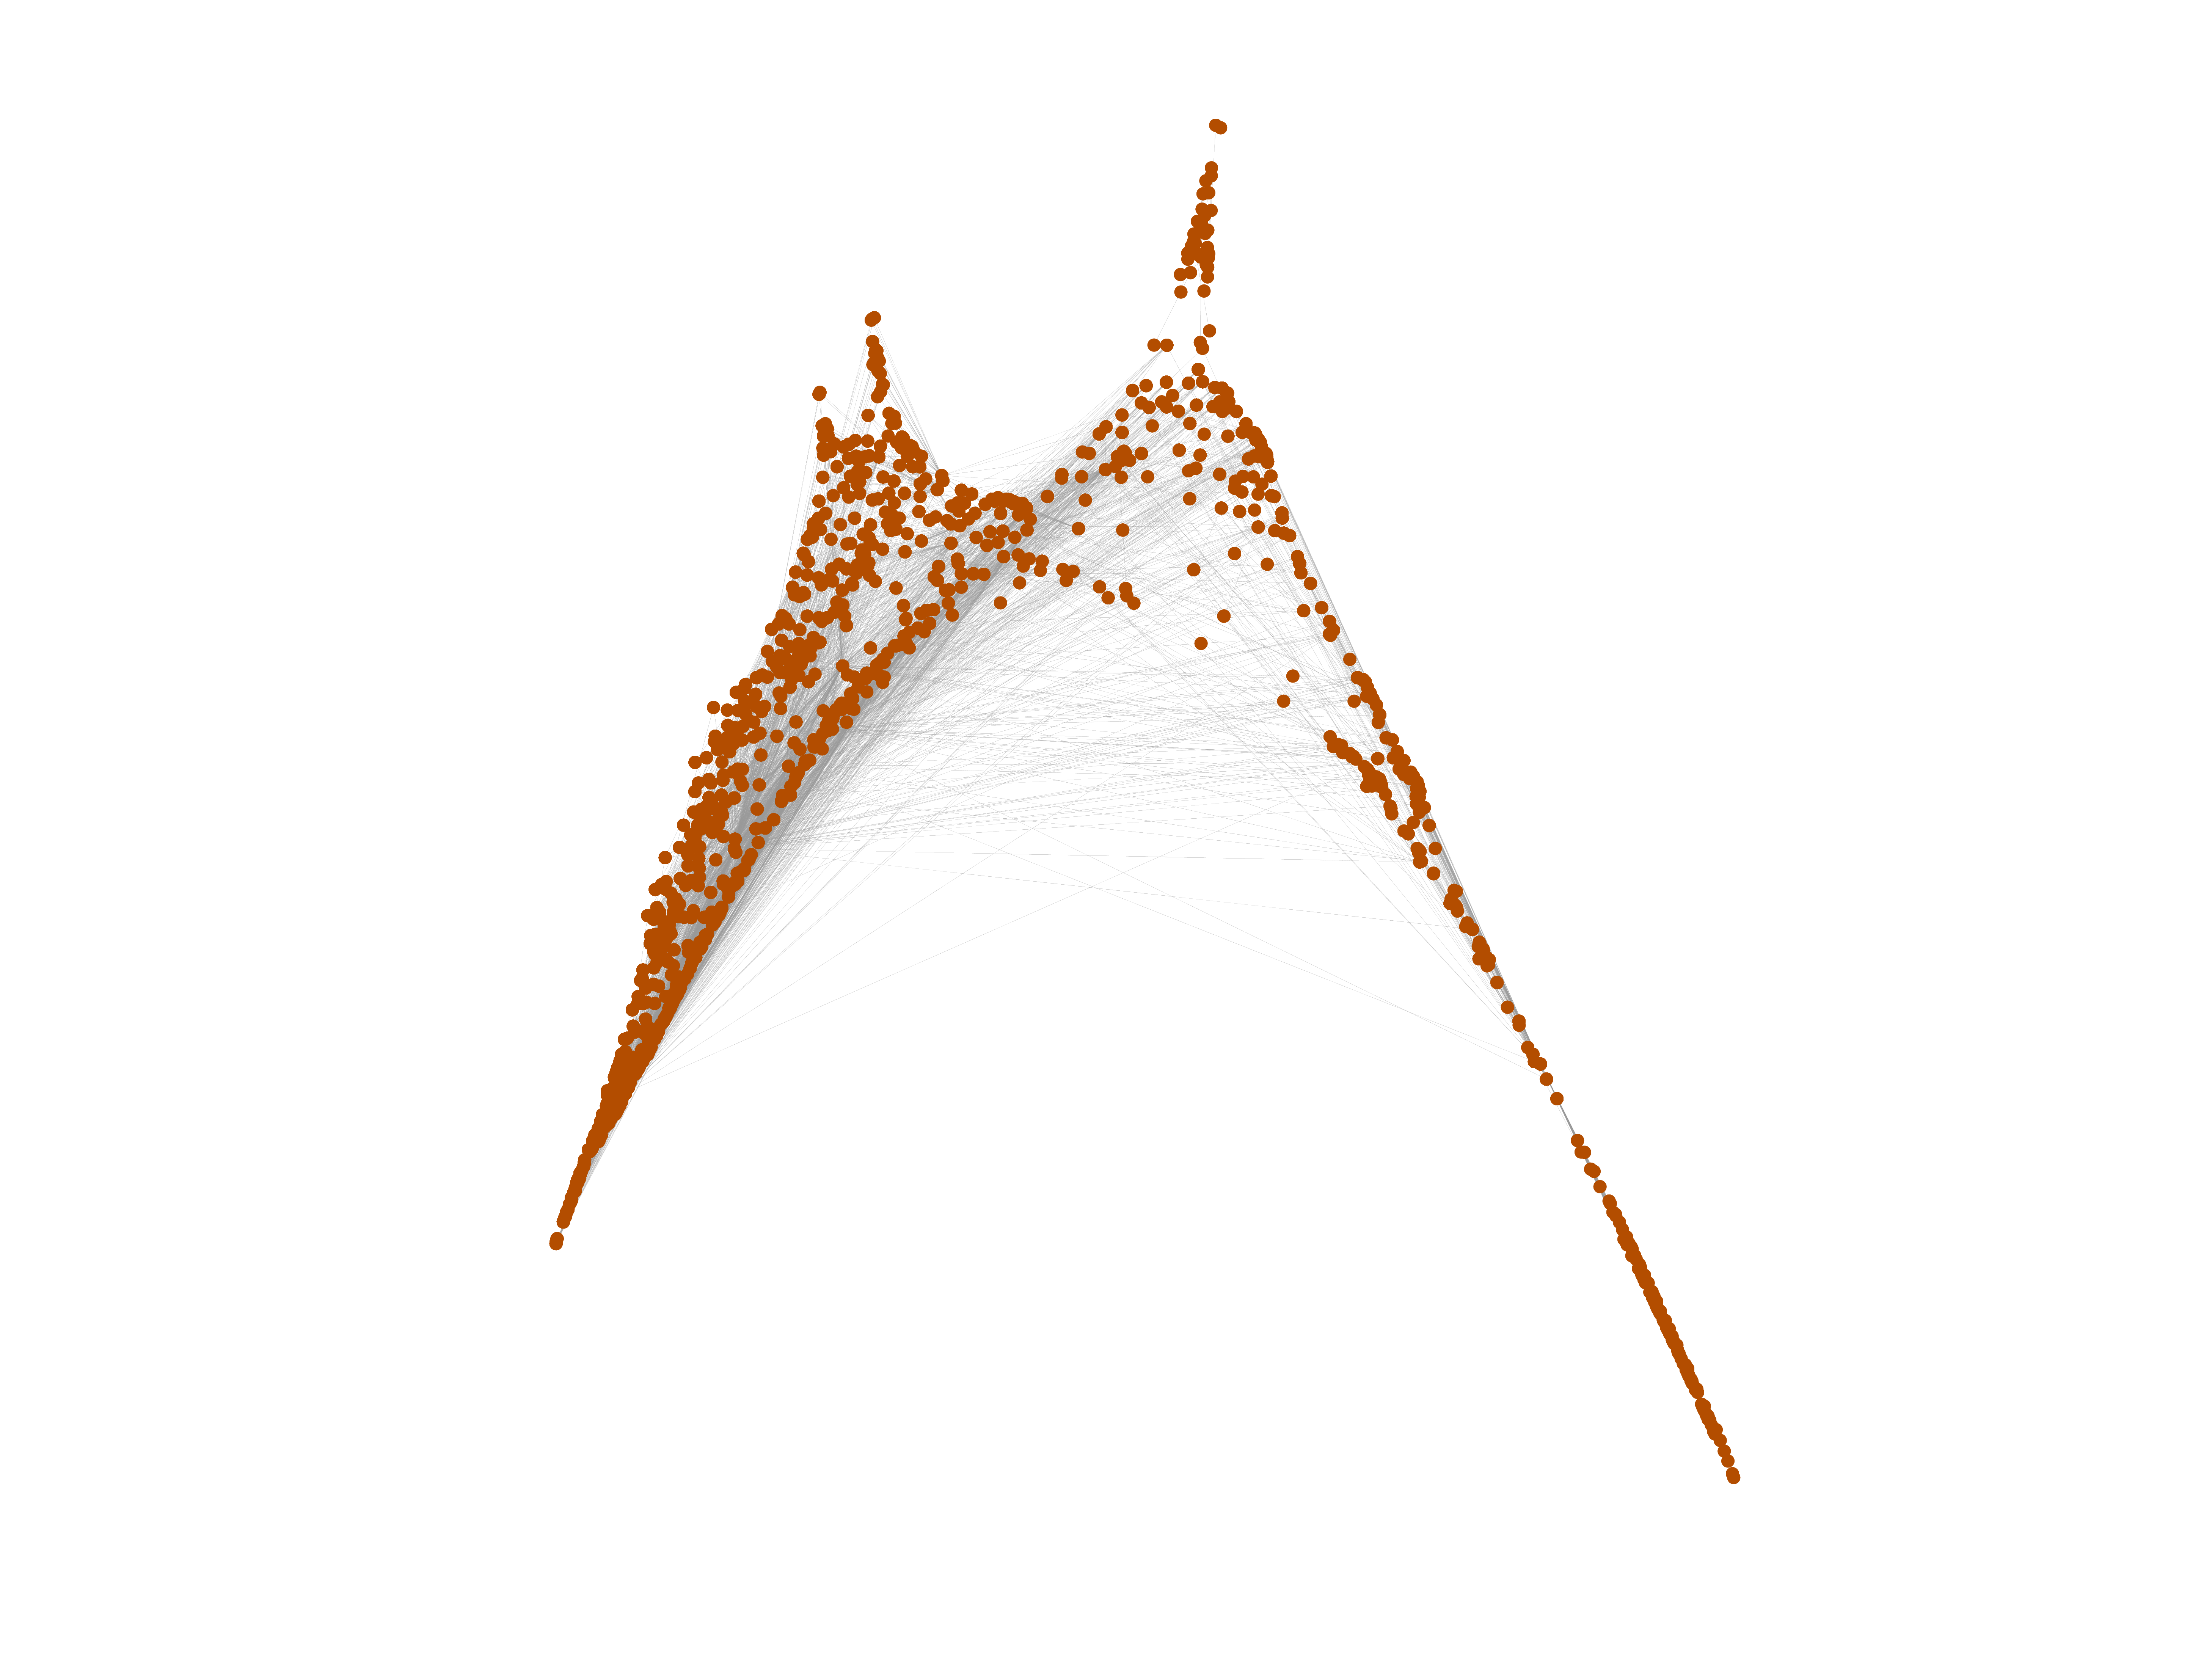
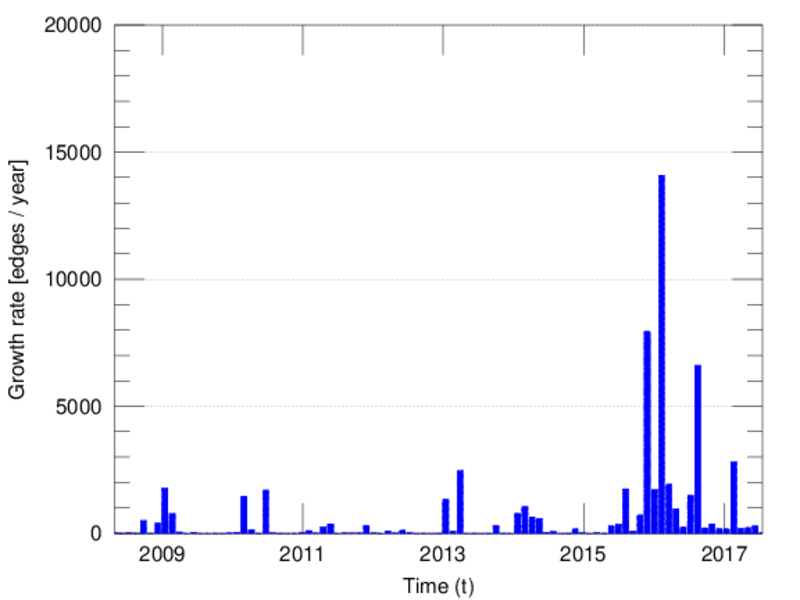
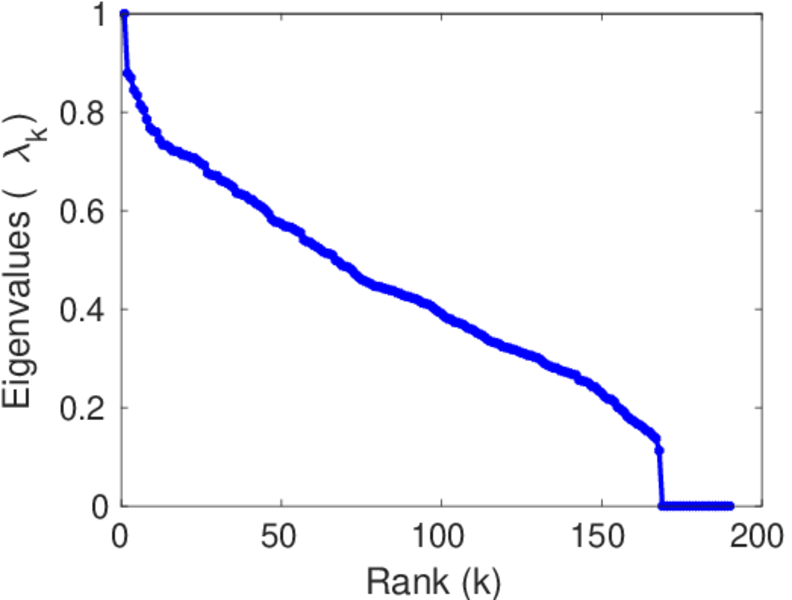
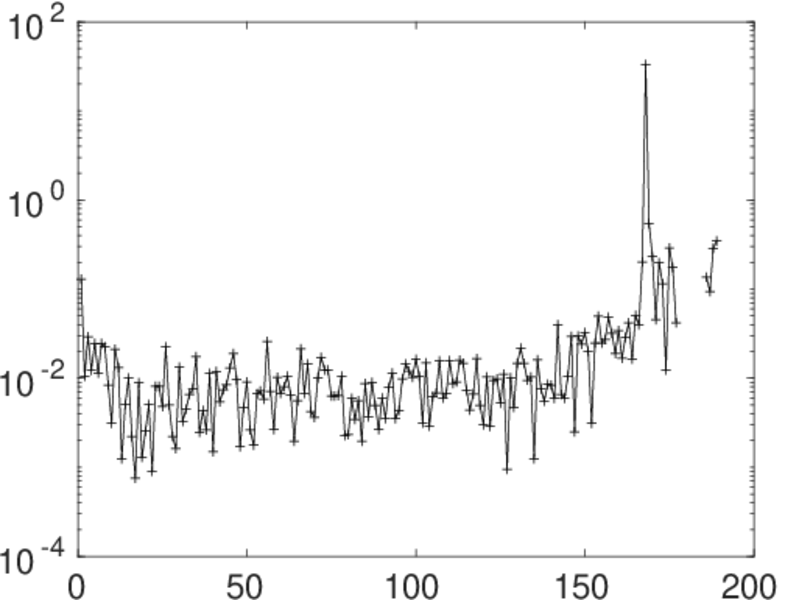
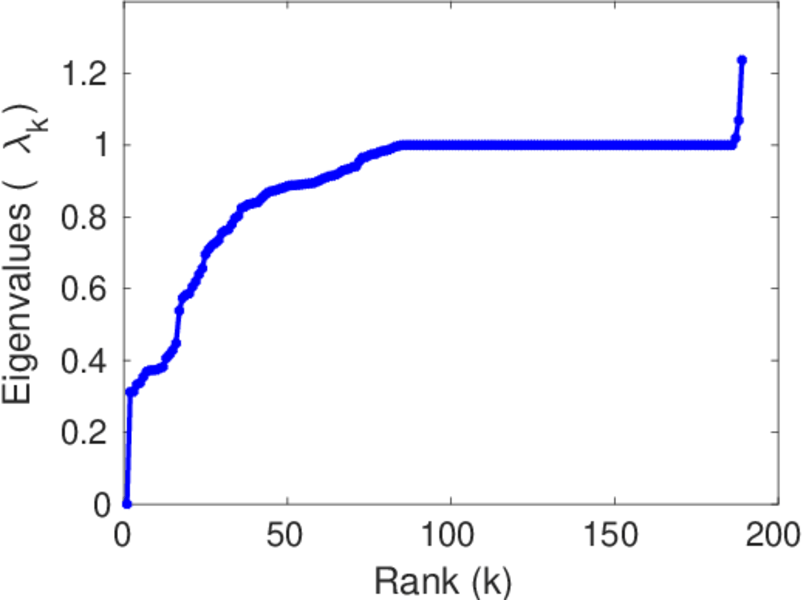
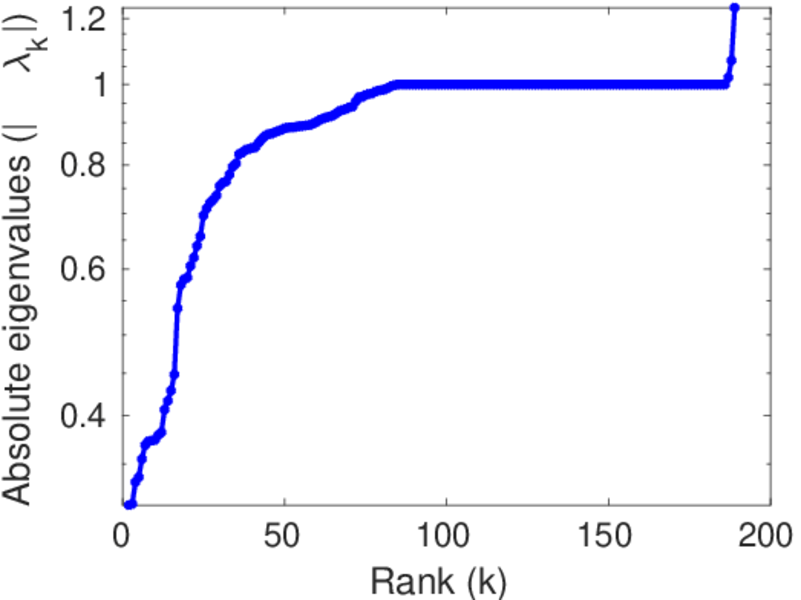
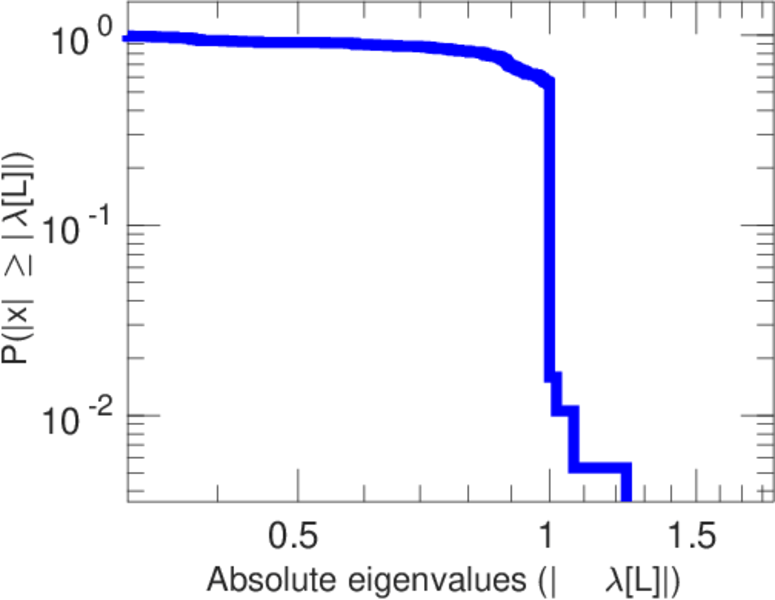
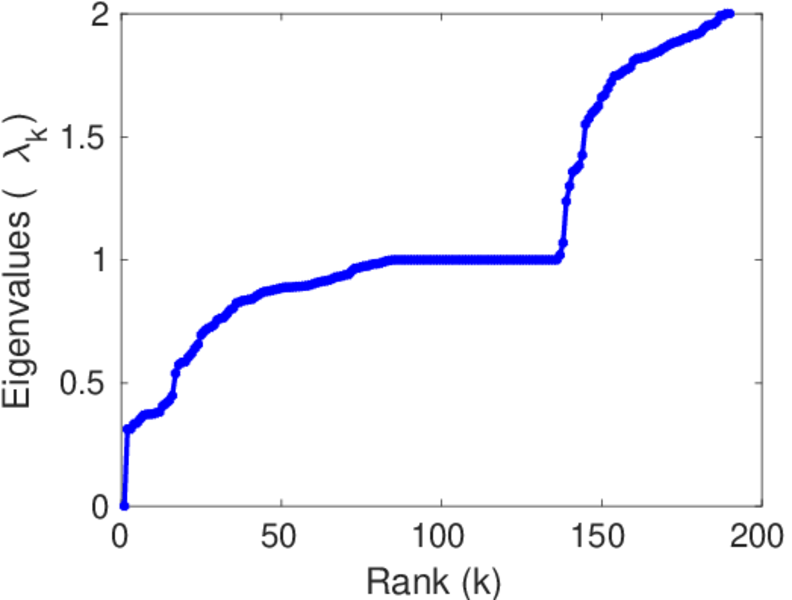
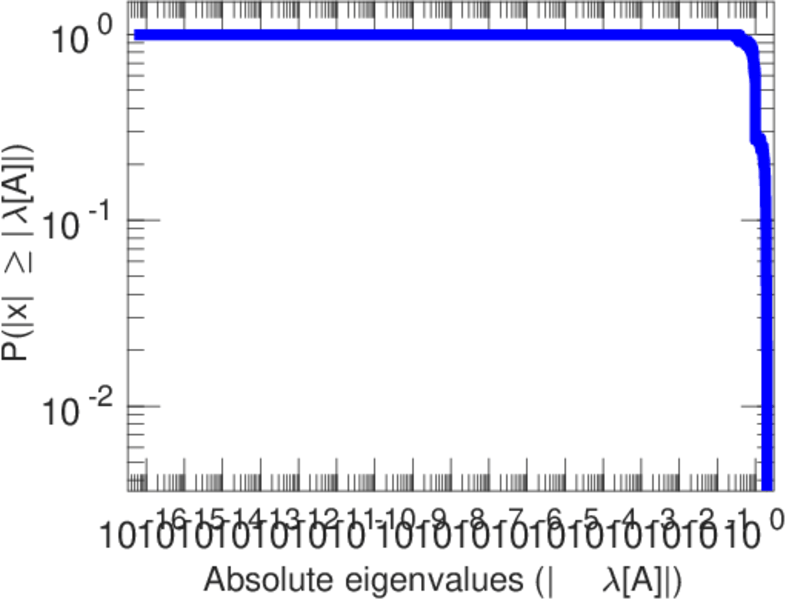
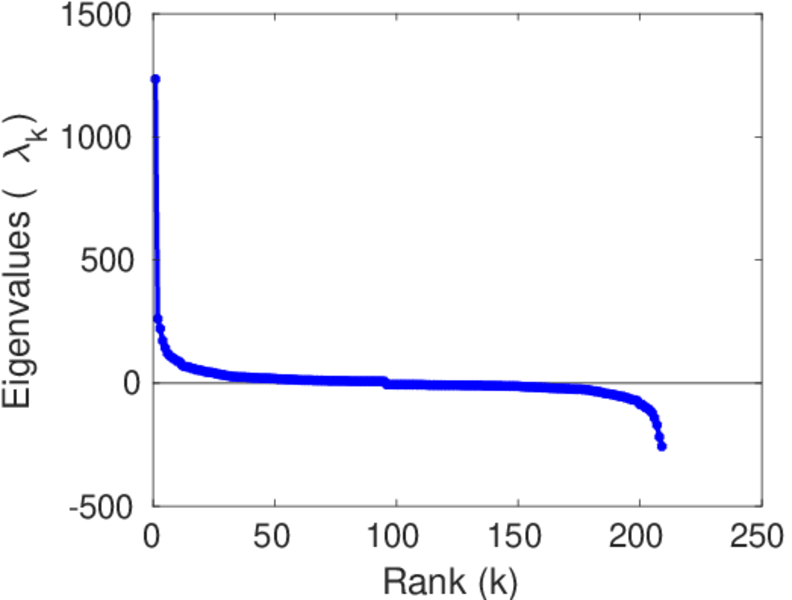
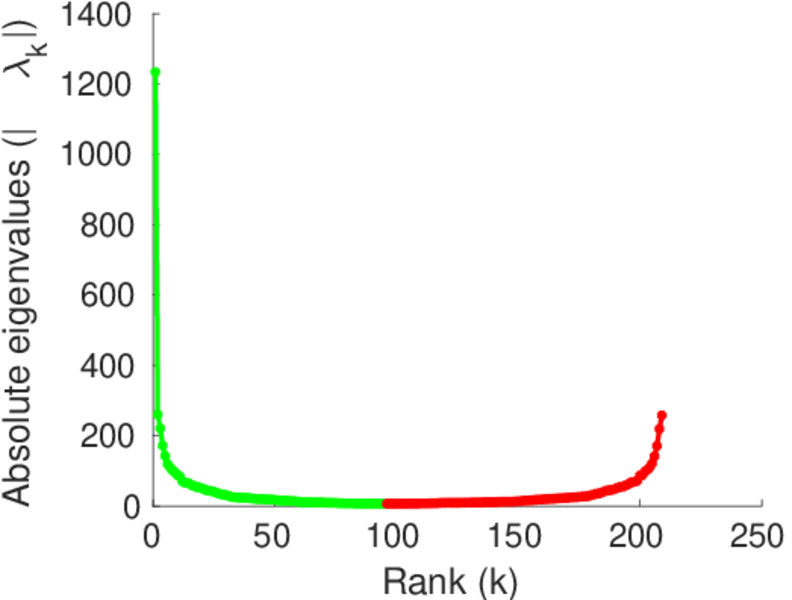
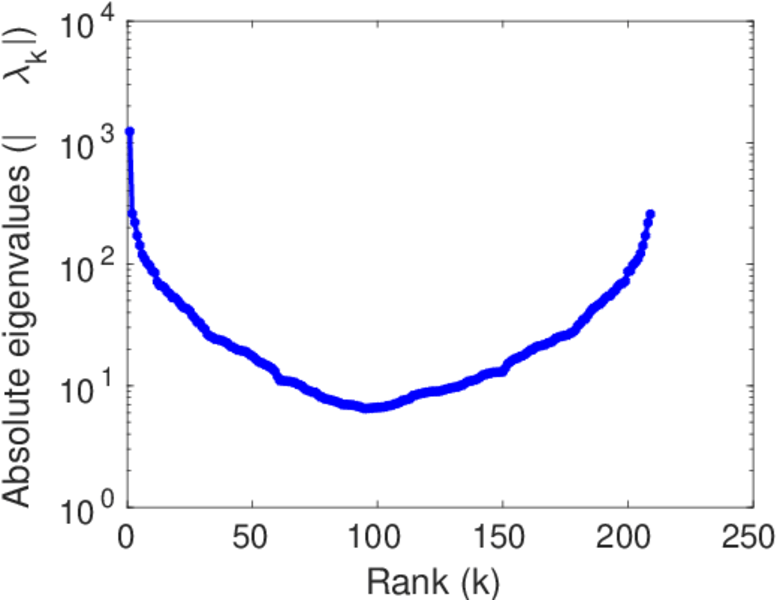
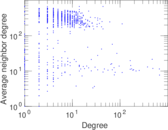
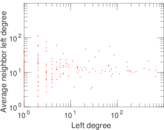
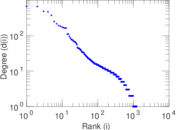
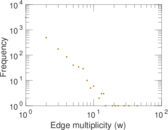
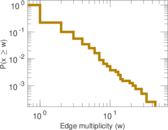
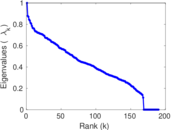
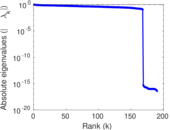
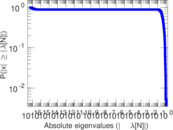
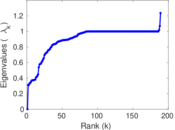
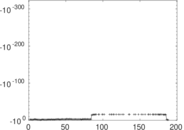
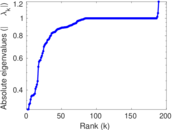
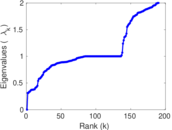
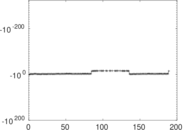
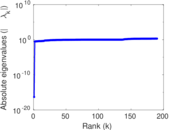
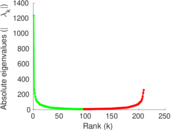
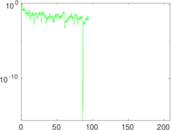
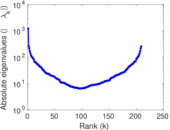
Plots


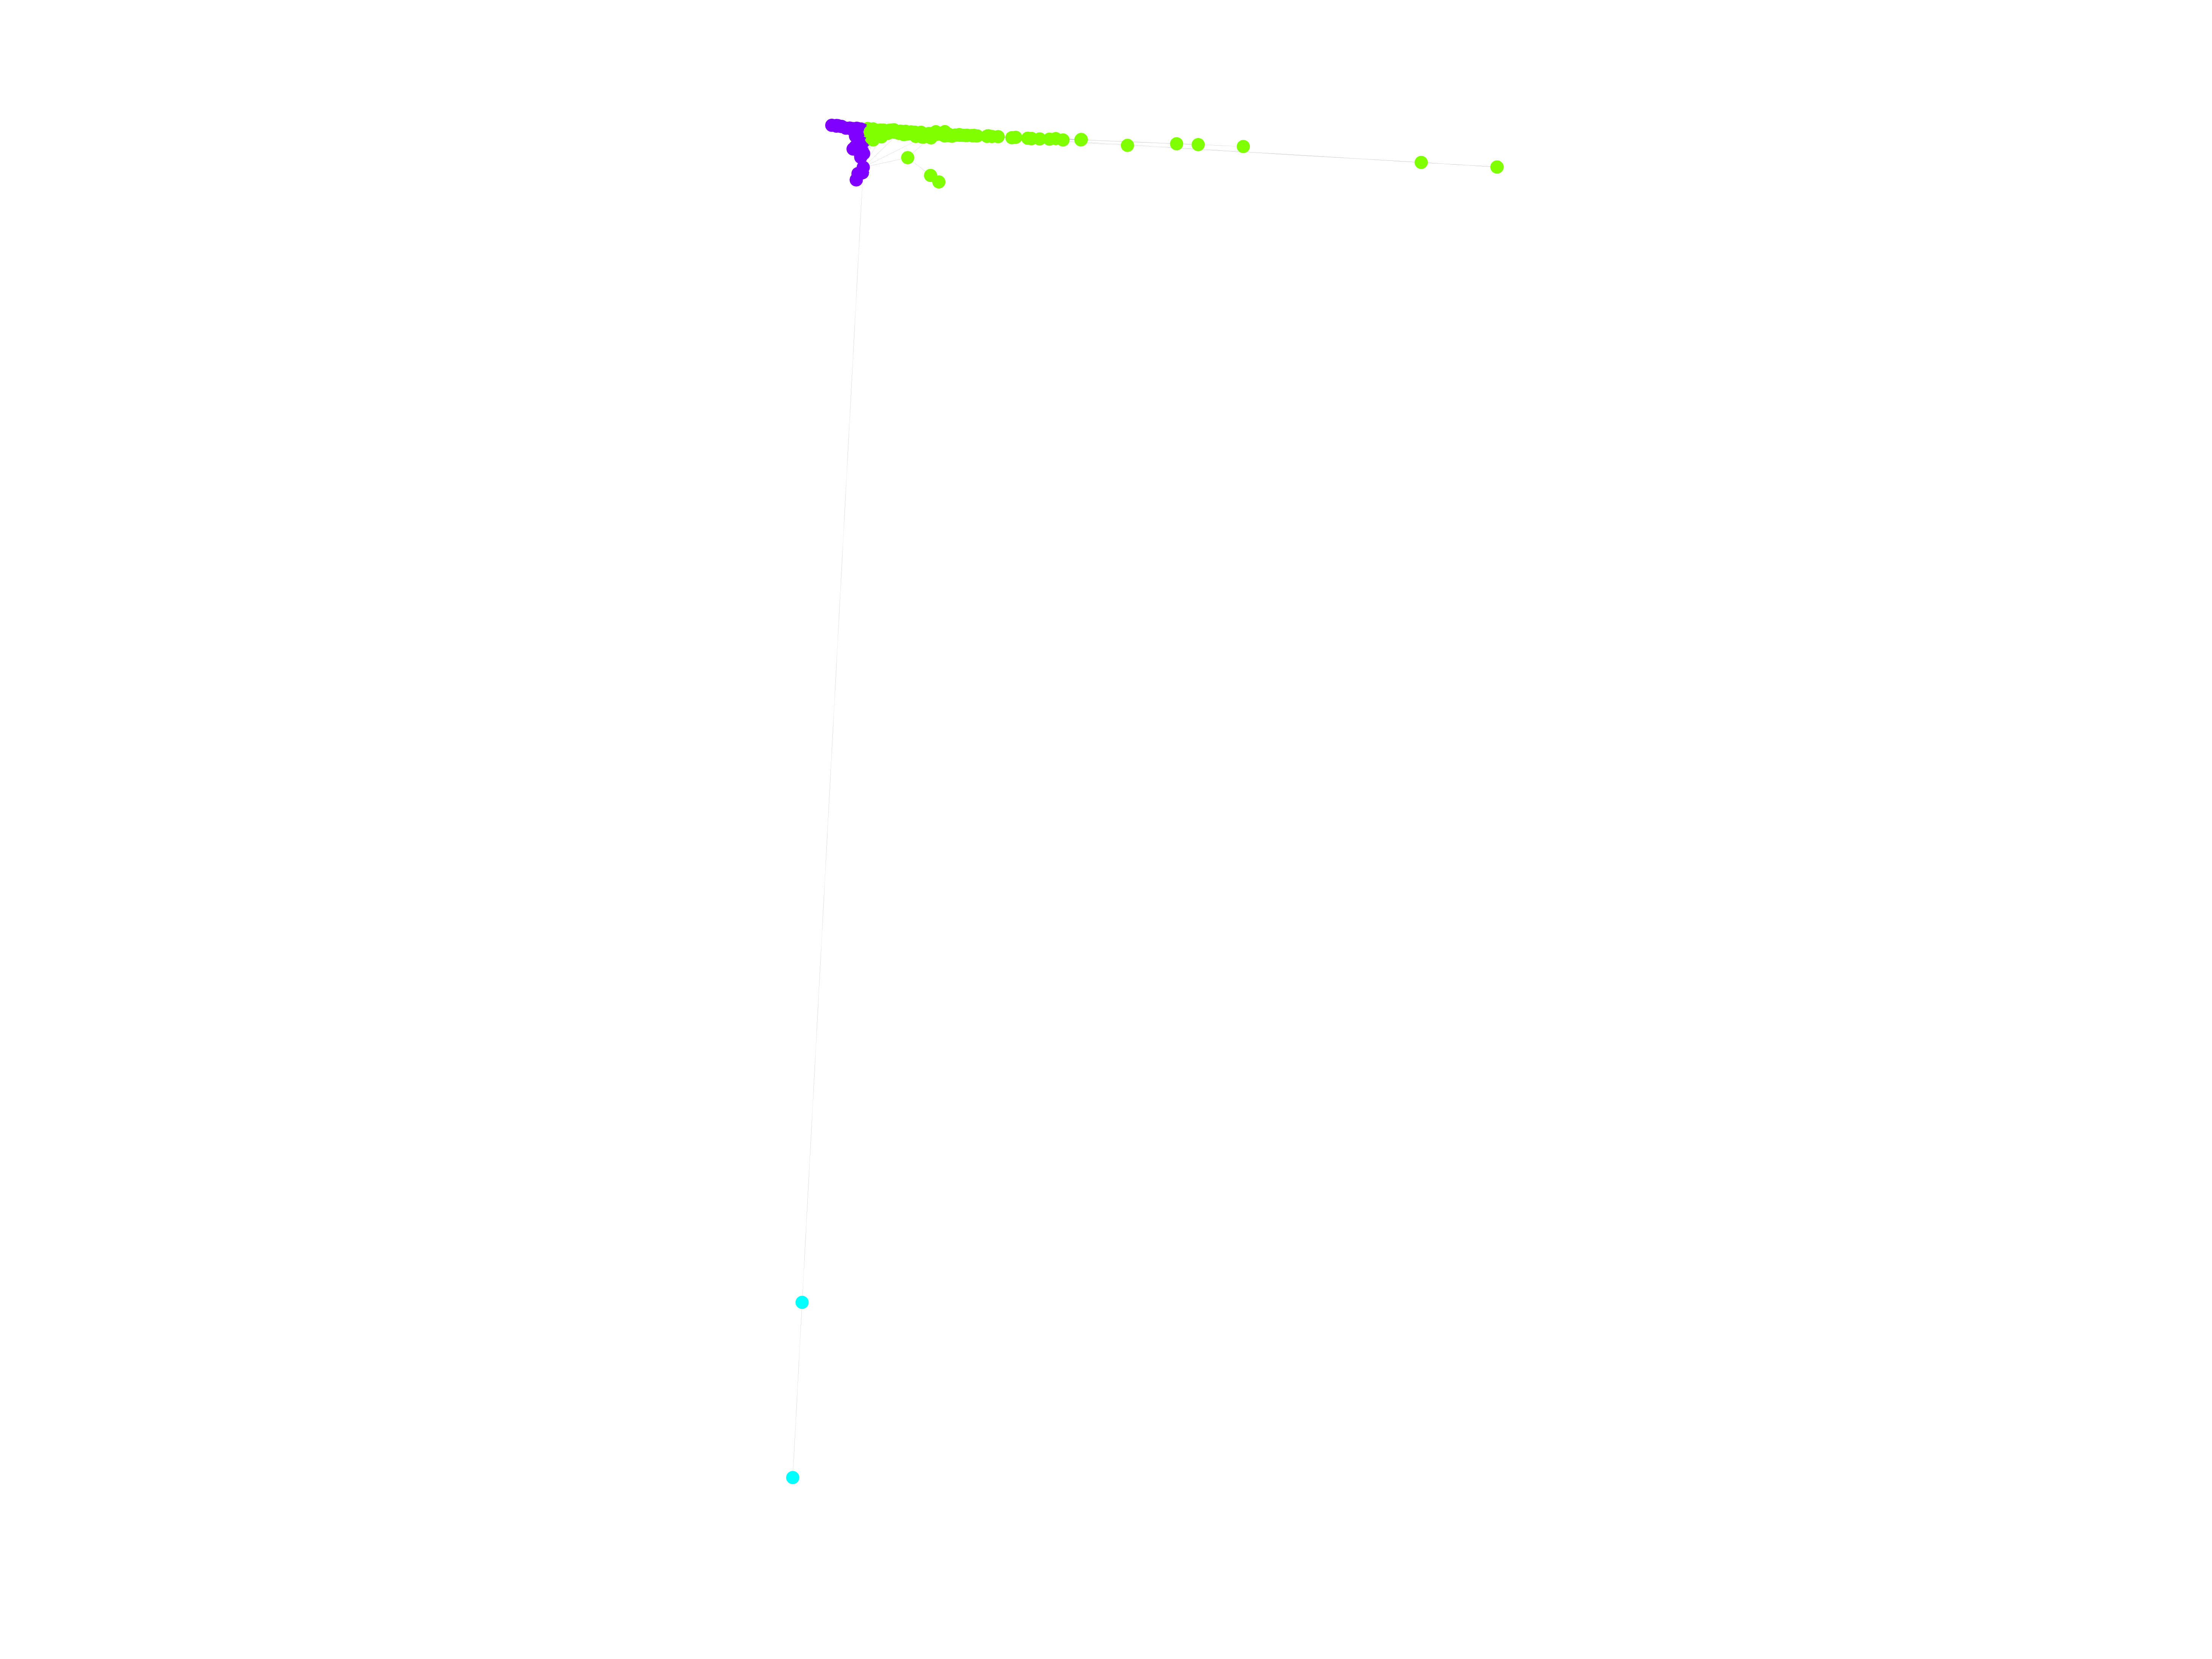
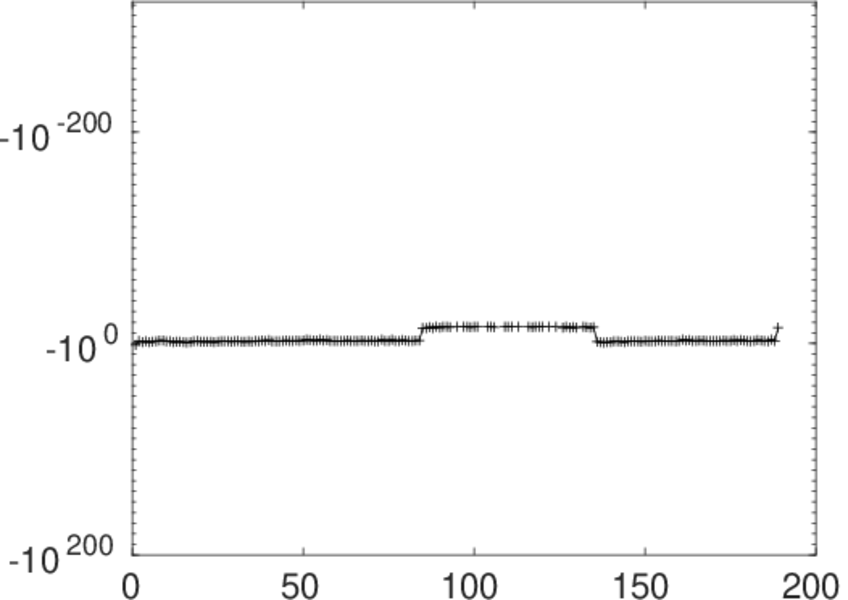
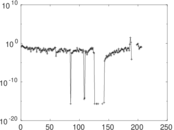
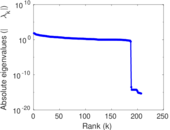
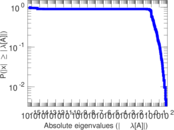
Matrix decompositions plots


Downloads
References
|
[1]
|
Jérôme Kunegis.
KONECT – The Koblenz Network Collection.
In Proc. Int. Conf. on World Wide Web Companion, pages
1343–1350, 2013.
[ http ]
|
|
[2]
|
Wikimedia Foundation.
Wikimedia downloads.
http://dumps.wikimedia.org/, January 2010.
|
 KONECT ‣ Networks ‣
Buy Me a Coffee
KONECT ‣ Networks ‣
Buy Me a Coffee