Wikipedia edits (af)
This is the bipartite edit network of the Afrikaans Wikipedia. It contains
users and pages from the Afrikaans Wikipedia, connected by edit events. Each
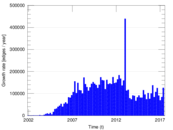
edge represents an edit. The dataset includes the timestamp of each edit.
Metadata
Statistics
| Size | n = | 117,392
|
| Left size | n1 = | 7,699
|
| Right size | n2 = | 109,693
|
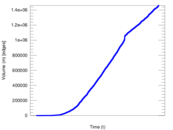
| Volume | m = | 1,460,196
|
| Unique edge count | m̿ = | 614,164
|
| Wedge count | s = | 3,116,845,456
|
| Claw count | z = | 19,519,999,185,336
|
| Cross count | x = | 119,619,755,790,031,504
|
| Square count | q = | 6,347,289,255
|
| 4-Tour count | T4 = | 63,247,622,160
|
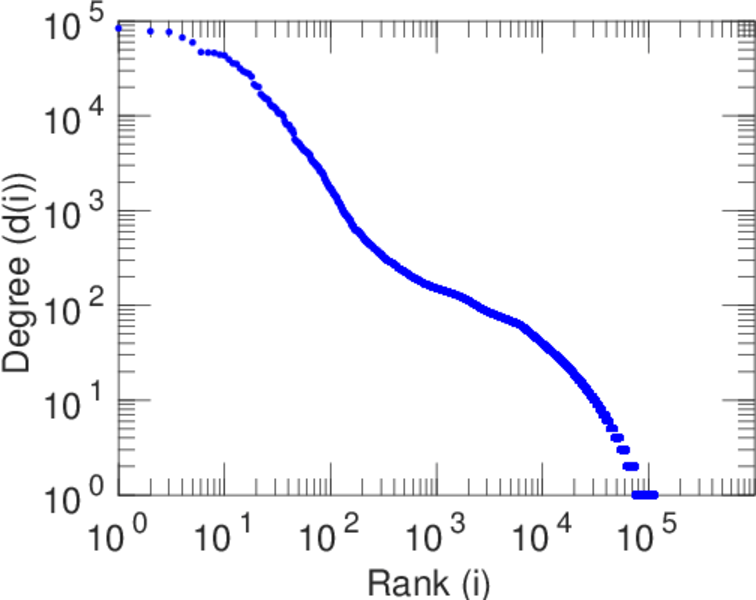
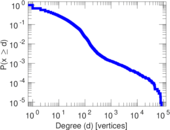
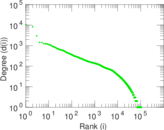
| Maximum degree | dmax = | 83,708
|
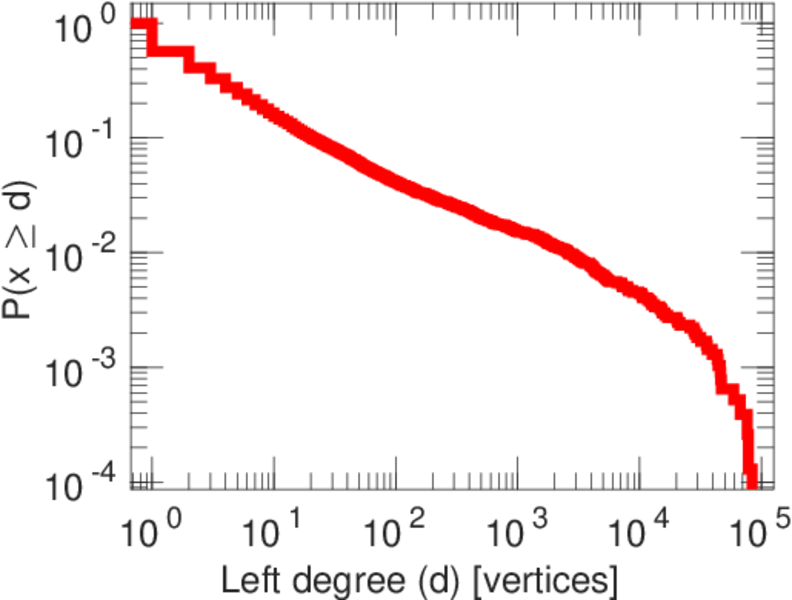
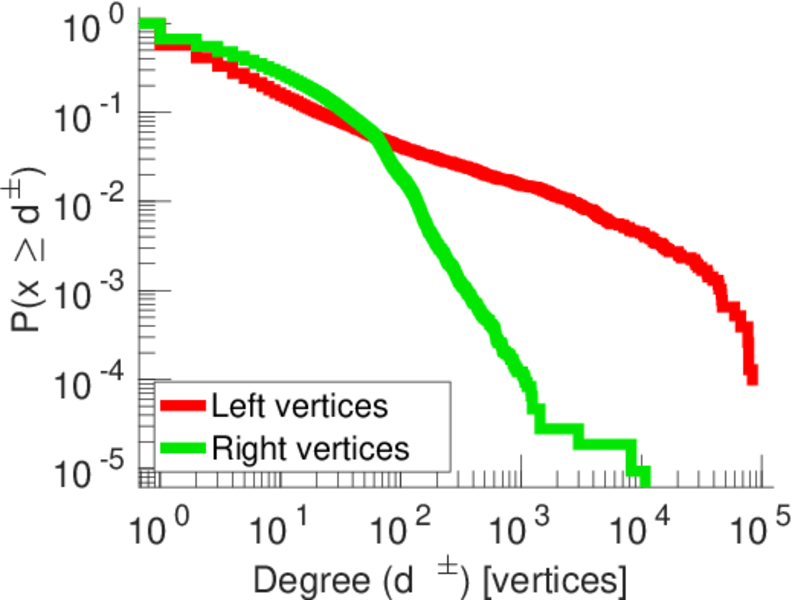
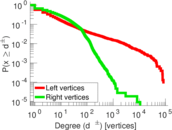
| Maximum left degree | d1max = | 83,708
|
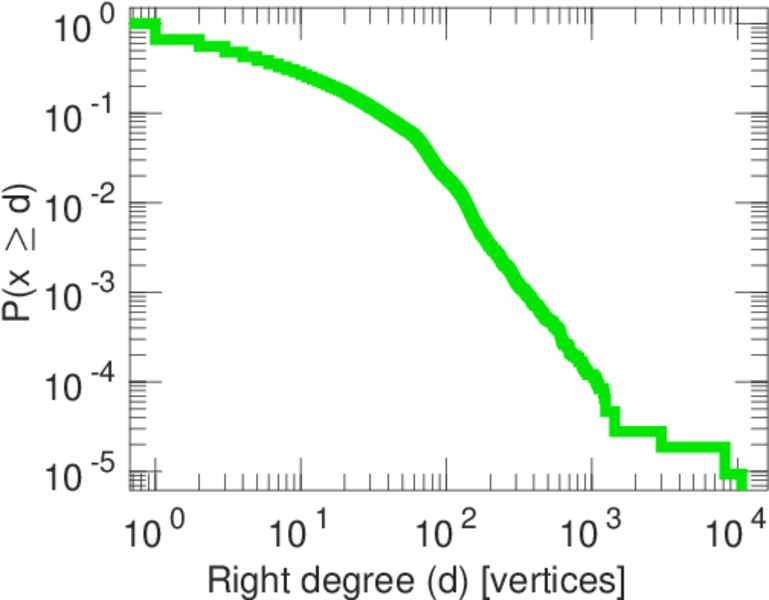
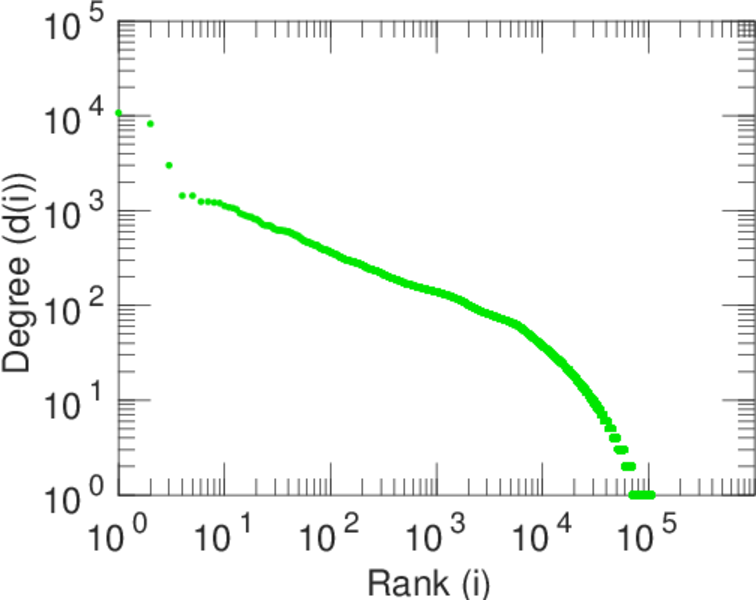
| Maximum right degree | d2max = | 10,730
|
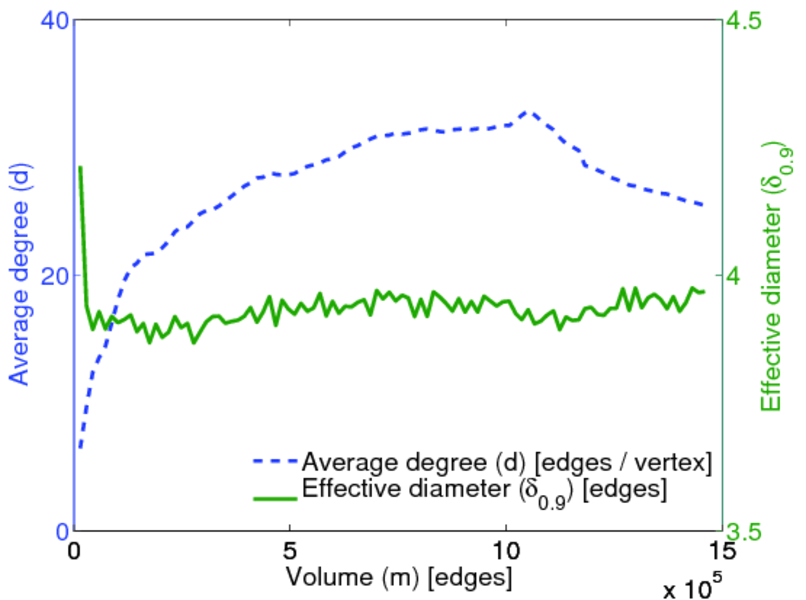
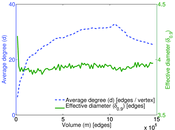
| Average degree | d = | 24.877 3
|
| Average left degree | d1 = | 189.660
|
| Average right degree | d2 = | 13.311 7
|
| Fill | p = | 0.000 727 229
|
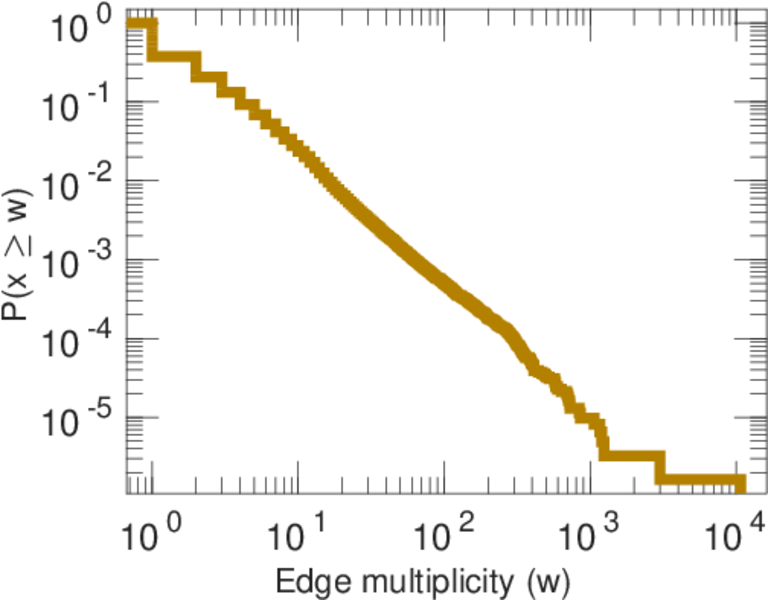
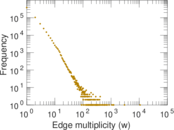
| Average edge multiplicity | m̃ = | 2.377 53
|
| Size of LCC | N = | 113,310
|
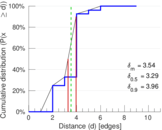
| Diameter | δ = | 10
|
| 50-Percentile effective diameter | δ0.5 = | 3.286 73
|
| 90-Percentile effective diameter | δ0.9 = | 3.956 14
|
| Median distance | δM = | 4
|
| Mean distance | δm = | 3.536 47
|
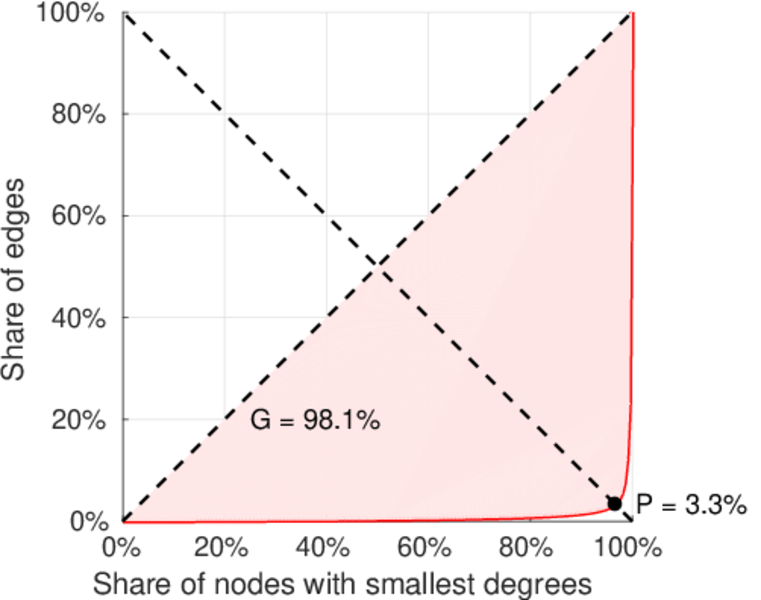
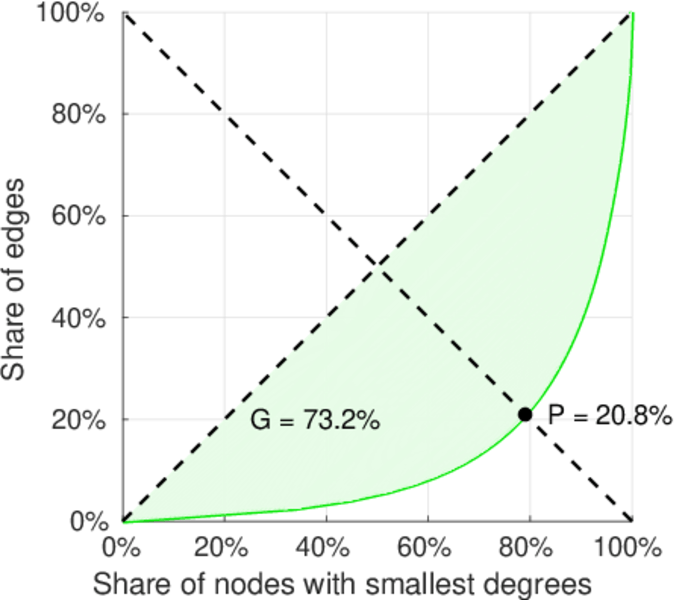
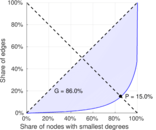
| Gini coefficient | G = | 0.862 167
|
| Balanced inequality ratio | P = | 0.148 680
|
| Left balanced inequality ratio | P1 = | 0.032 644 9
|
| Right balanced inequality ratio | P2 = | 0.208 074
|
| Relative edge distribution entropy | Her = | 0.731 513
|
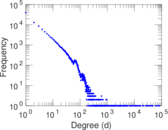
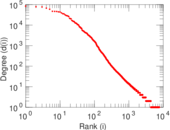
| Power law exponent | γ = | 2.047 12
|
| Tail power law exponent | γt = | 1.701 00
|
| Tail power law exponent with p | γ3 = | 1.701 00
|
| p-value | p = | 0.000 00
|
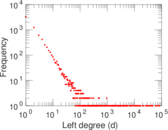
| Left tail power law exponent with p | γ3,1 = | 1.771 00
|
| Left p-value | p1 = | 0.000 00
|
| Right tail power law exponent with p | γ3,2 = | 4.761 00
|
| Right p-value | p2 = | 0.000 00
|
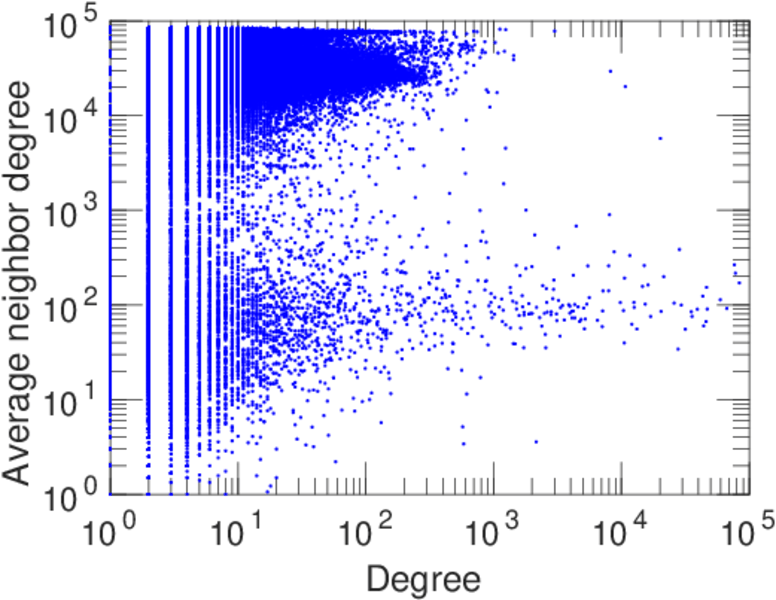
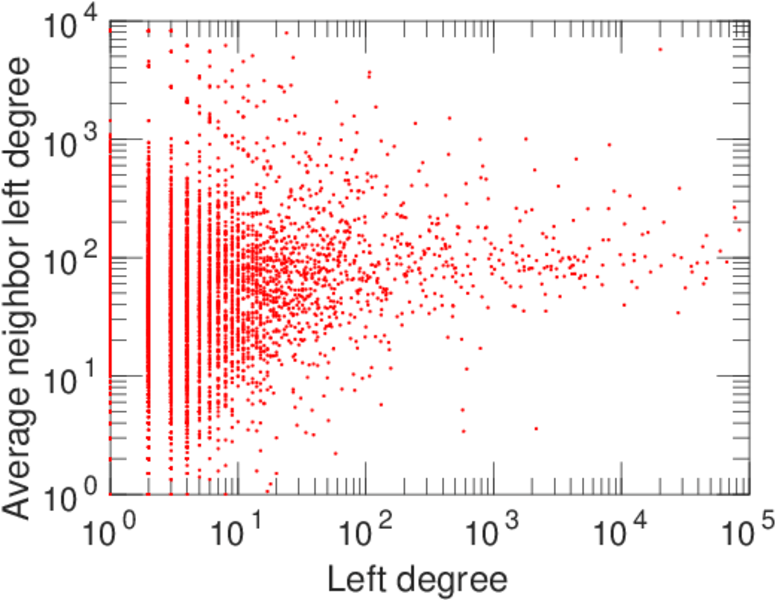
| Degree assortativity | ρ = | −0.263 412
|
| Degree assortativity p-value | pρ = | 0.000 00
|
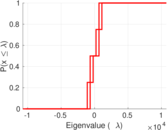
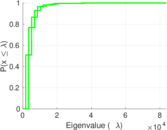
| Algebraic connectivity | a = | 0.028 210 8
|
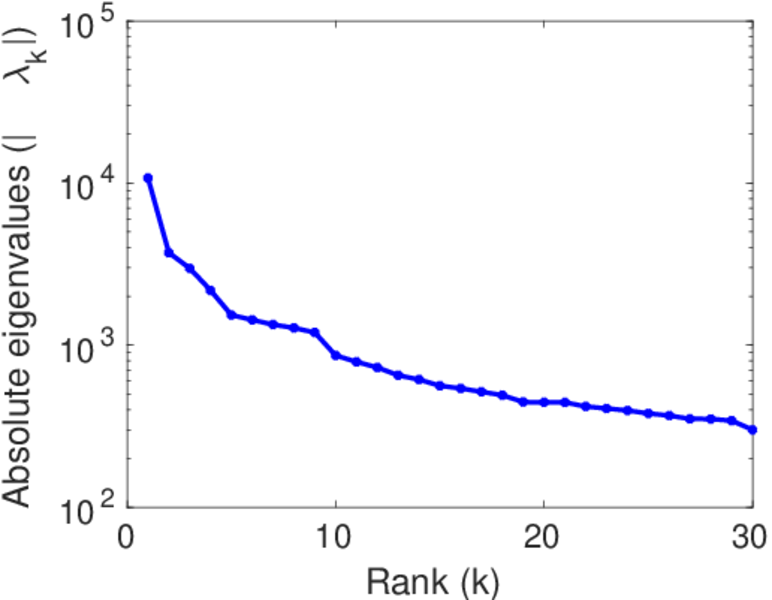
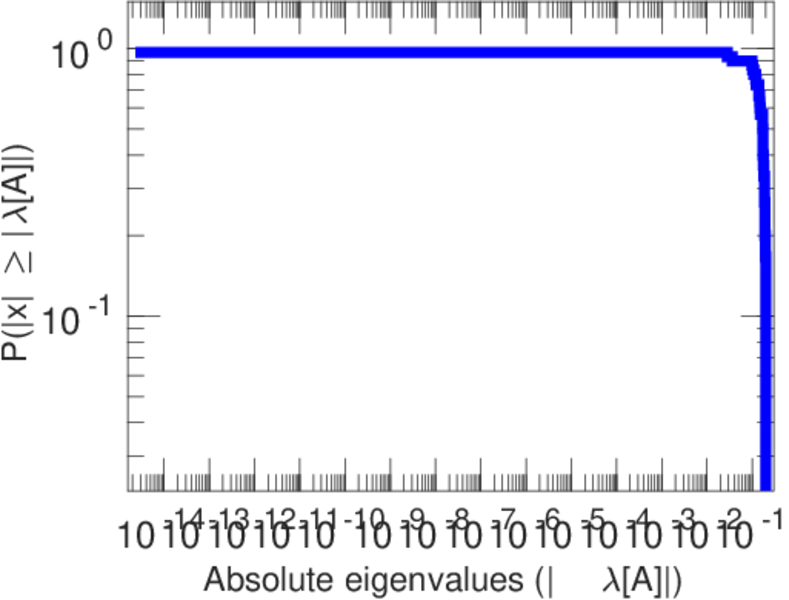
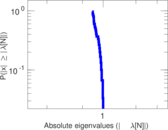
| Spectral separation | |λ1[A] / λ2[A]| = | 2.888 74
|
| Controllability | C = | 101,238
|
| Relative controllability | Cr = | 0.881 680
|
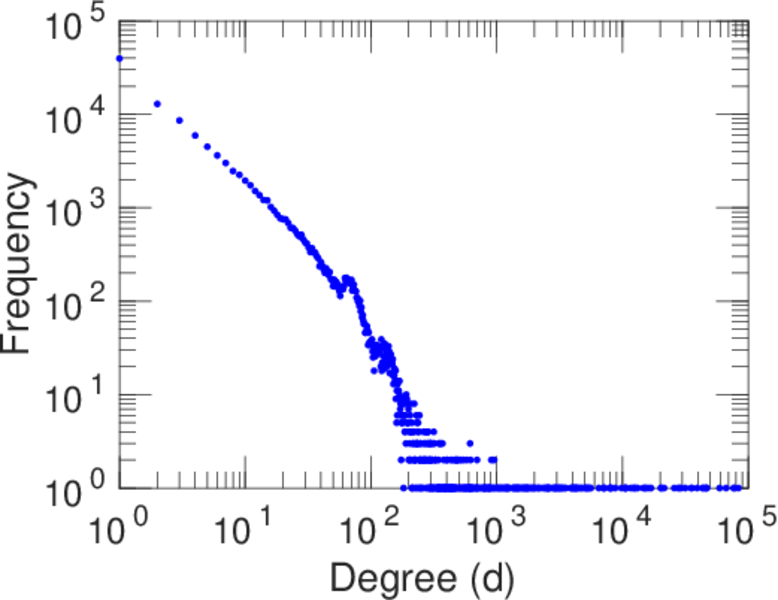
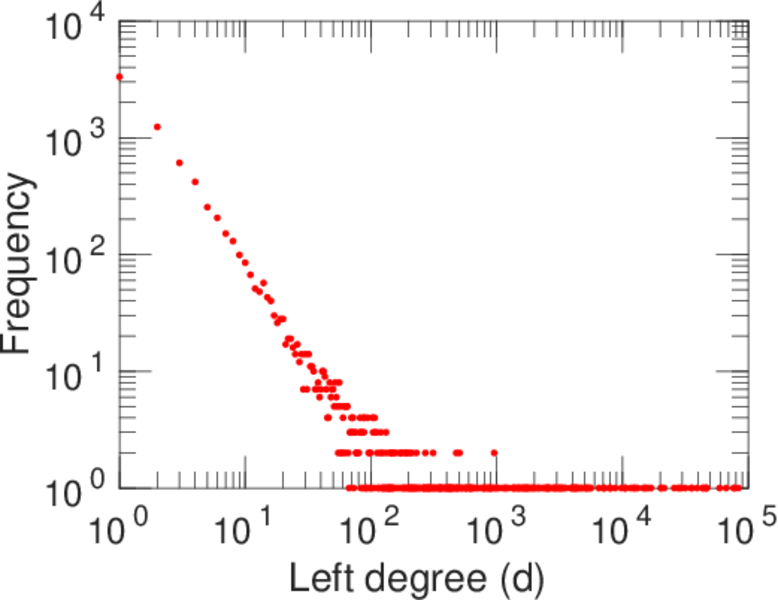
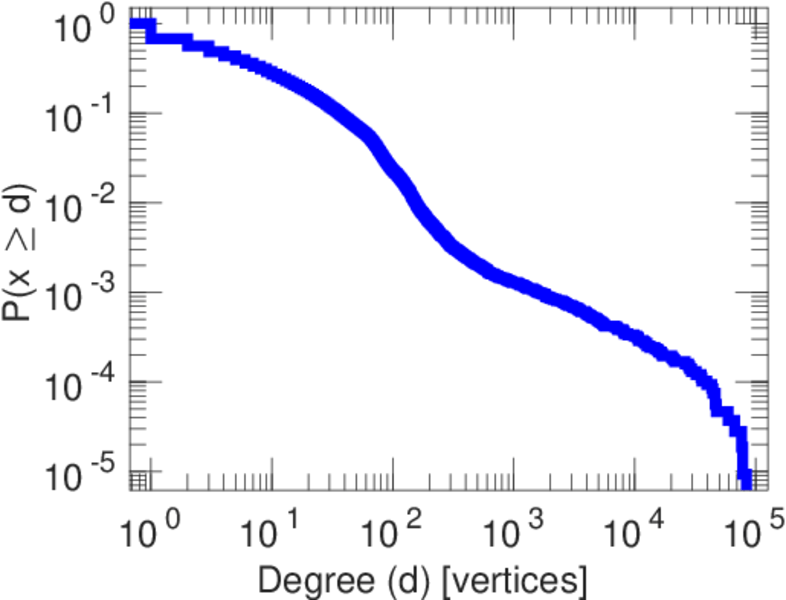
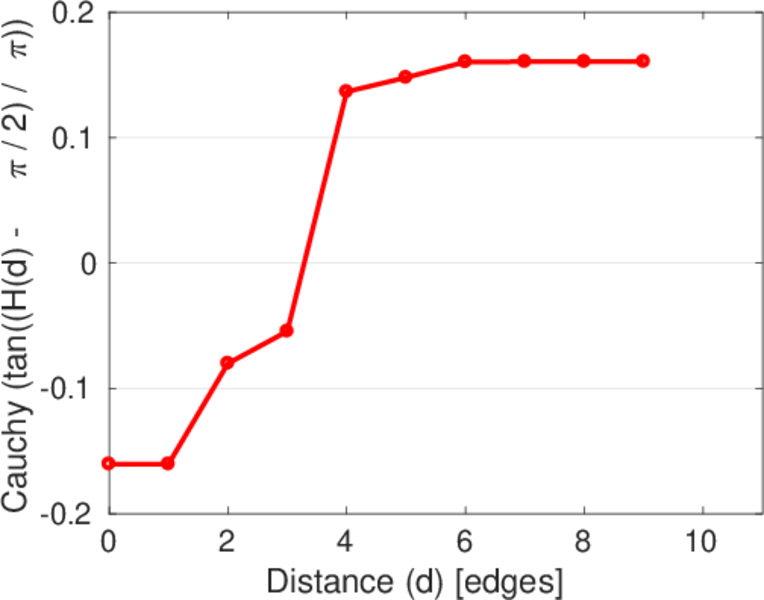
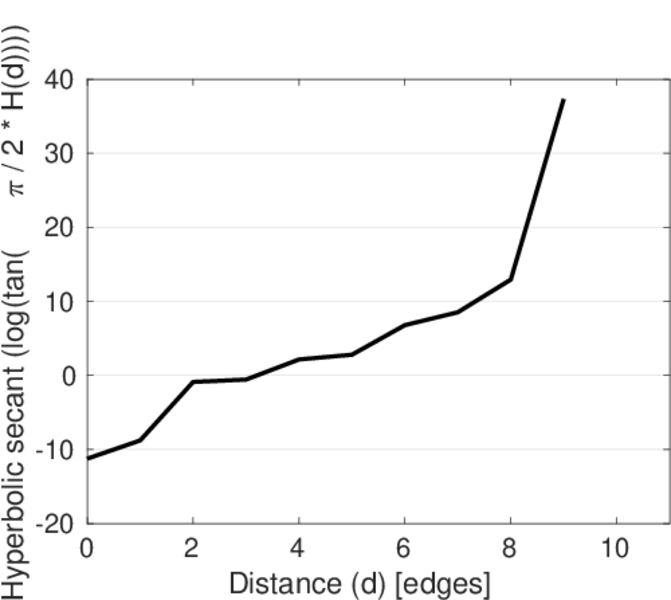
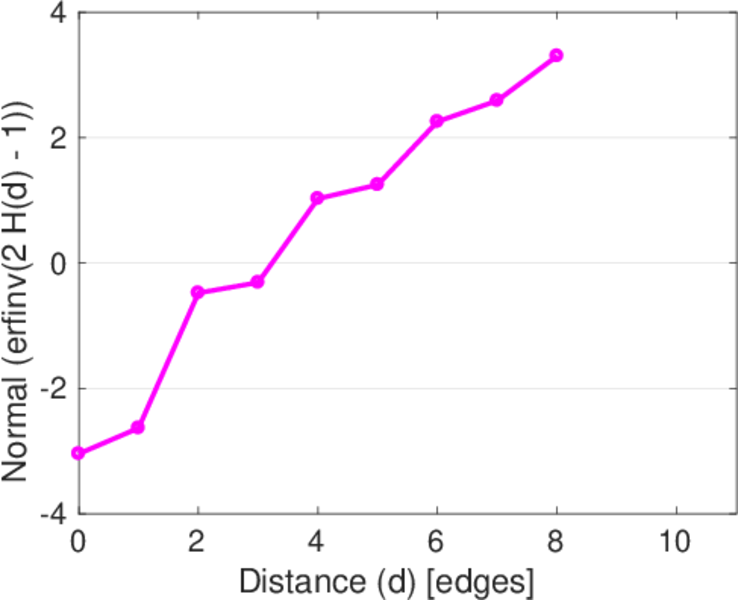
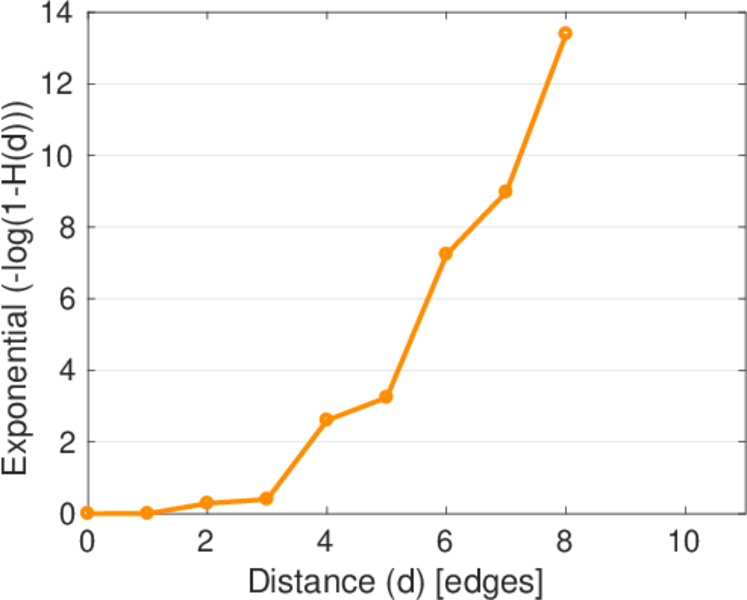
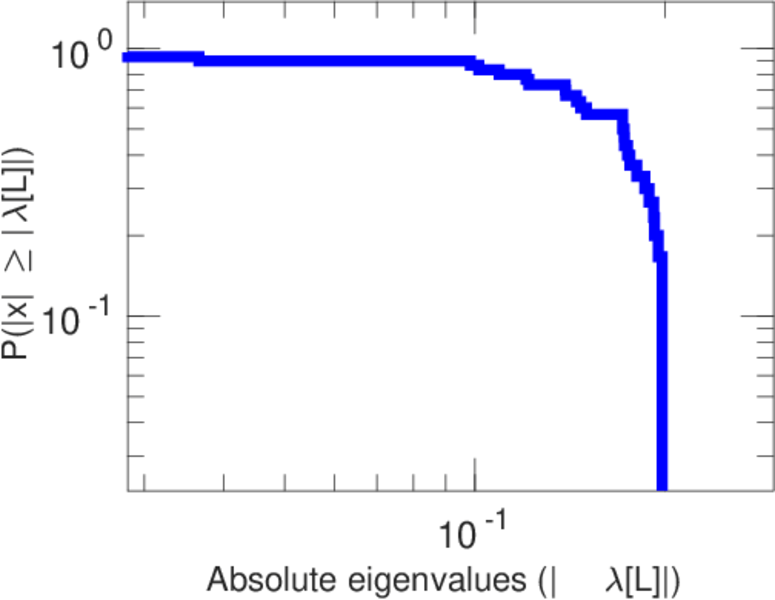
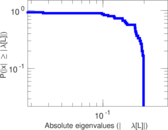
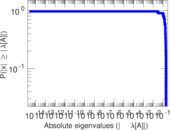
Plots


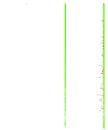

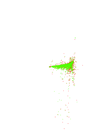


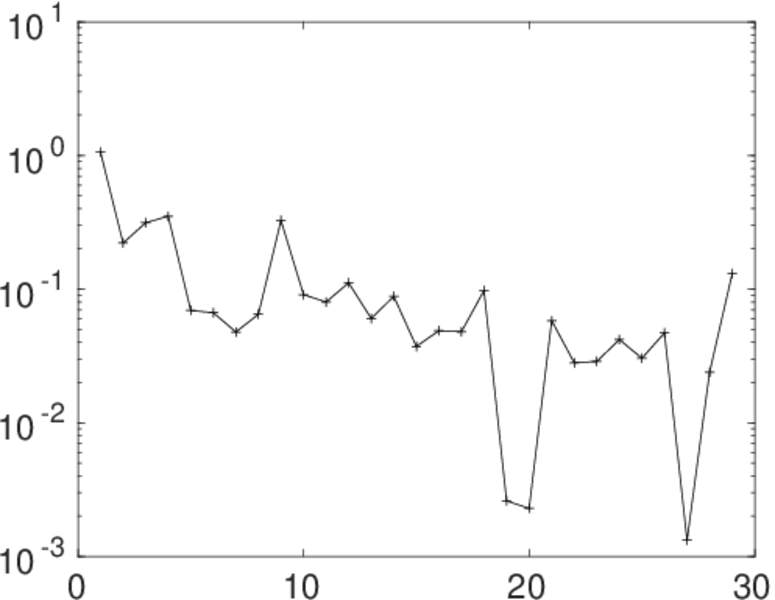
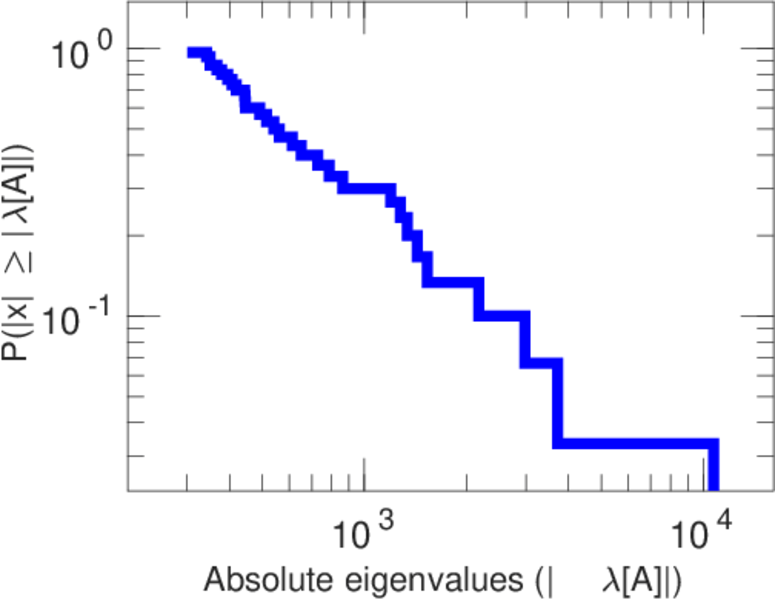
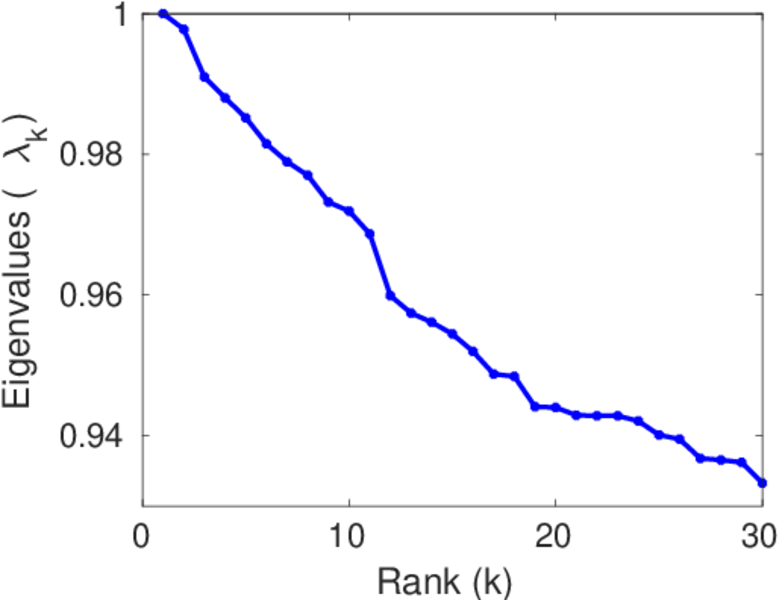
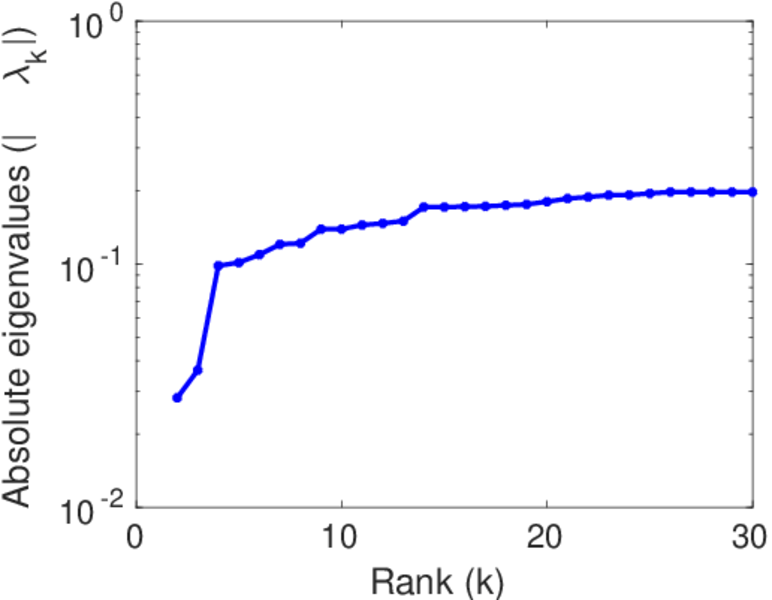
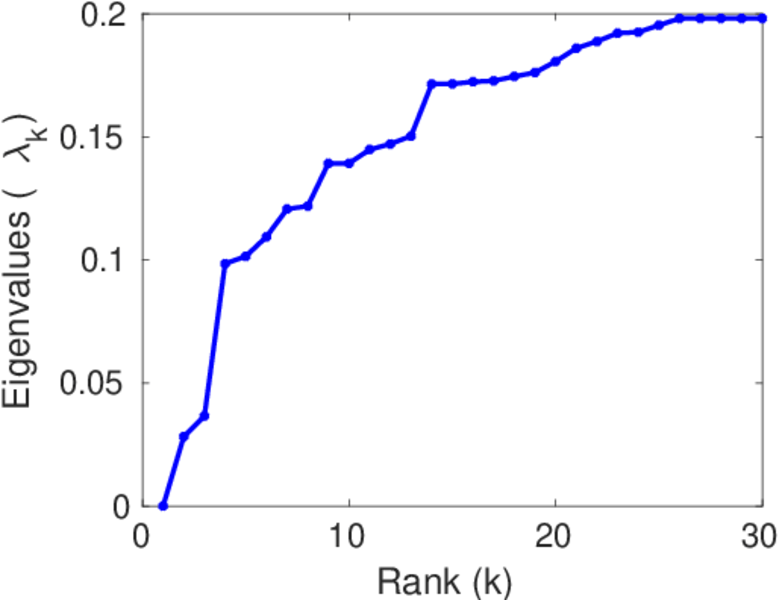
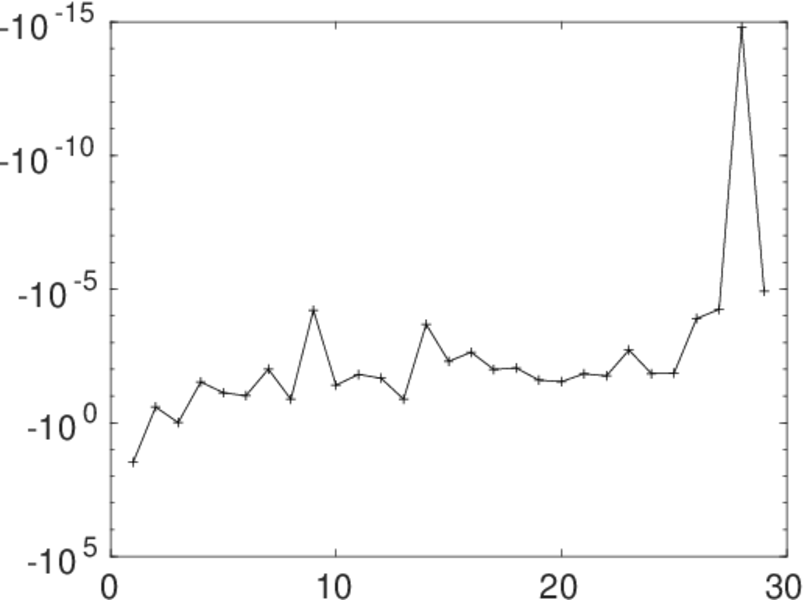
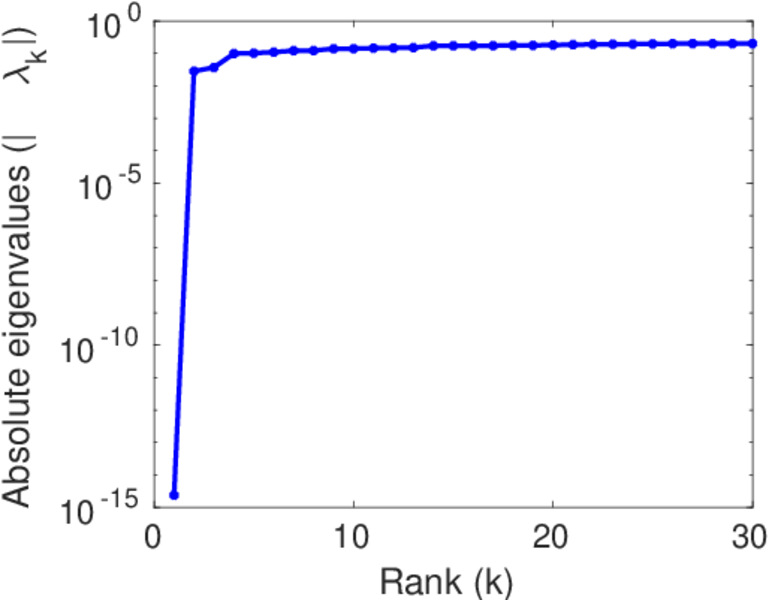
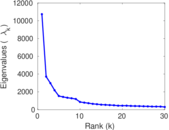
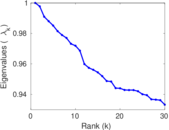
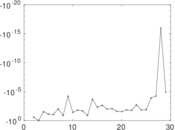
Matrix decompositions plots


Downloads
References
|
[1]
|
Jérôme Kunegis.
KONECT – The Koblenz Network Collection.
In Proc. Int. Conf. on World Wide Web Companion, pages
1343–1350, 2013.
[ http ]
|
|
[2]
|
Wikimedia Foundation.
Wikimedia downloads.
http://dumps.wikimedia.org/, January 2010.
|
 KONECT ‣ Networks ‣
Buy Me a Coffee
KONECT ‣ Networks ‣
Buy Me a Coffee