Wikipedia edits (ak)
This is the bipartite edit network of the Akan Wikipedia. It contains users and
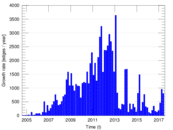
pages from the Akan Wikipedia, connected by edit events. Each edge represents
an edit. The dataset includes the timestamp of each edit.
Metadata
Statistics
| Size | n = | 2,872
|
| Left size | n1 = | 837
|
| Right size | n2 = | 2,035
|
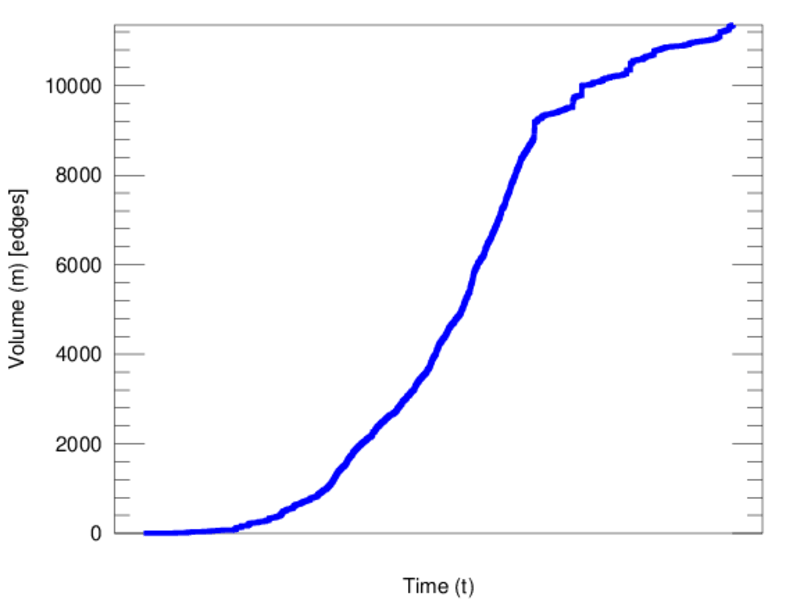
| Volume | m = | 11,356
|
| Unique edge count | m̿ = | 5,654
|
| Wedge count | s = | 206,493
|
| Claw count | z = | 7,624,707
|
| Cross count | x = | 292,642,050
|
| Square count | q = | 295,931
|
| 4-Tour count | T4 = | 3,206,644
|
| Maximum degree | dmax = | 634
|
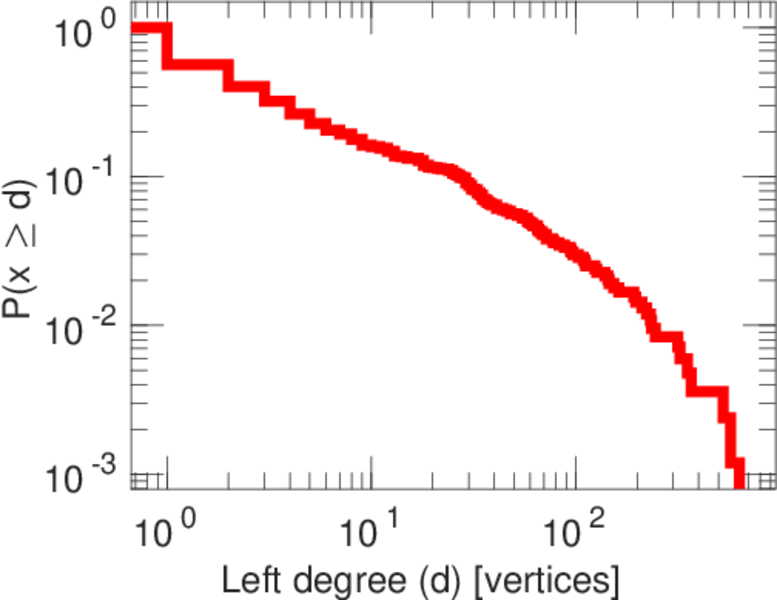
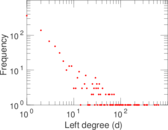
| Maximum left degree | d1max = | 634
|
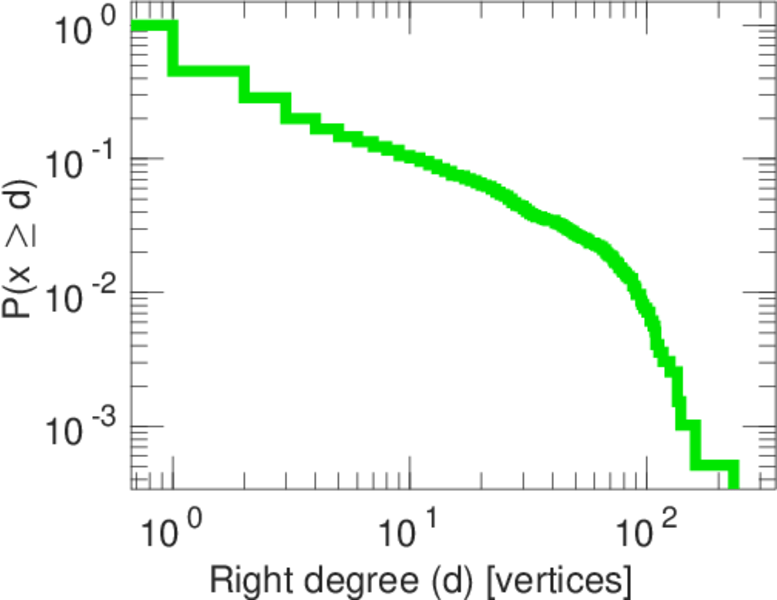
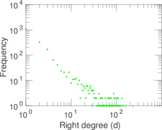
| Maximum right degree | d2max = | 232
|
| Average degree | d = | 7.908 08
|
| Average left degree | d1 = | 13.567 5
|
| Average right degree | d2 = | 5.580 34
|
| Fill | p = | 0.003 319 45
|
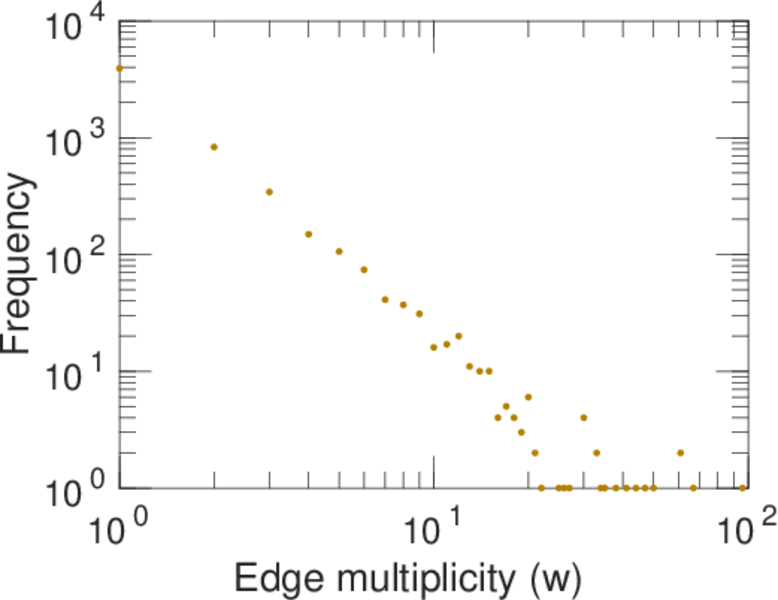
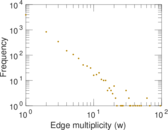
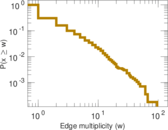
| Average edge multiplicity | m̃ = | 2.008 49
|
| Size of LCC | N = | 1,981
|
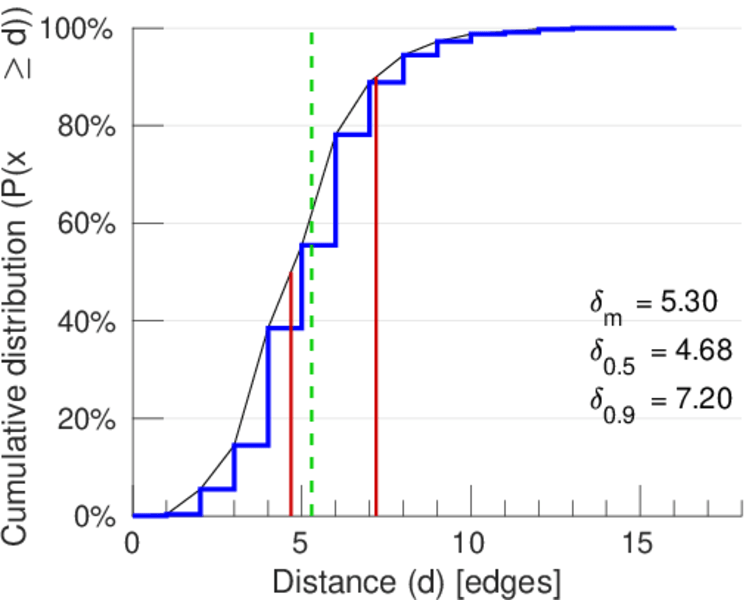
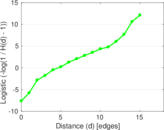
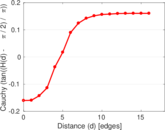
| Diameter | δ = | 17
|
| 50-Percentile effective diameter | δ0.5 = | 4.678 59
|
| 90-Percentile effective diameter | δ0.9 = | 7.201 17
|
| Median distance | δM = | 5
|
| Mean distance | δm = | 5.295 27
|
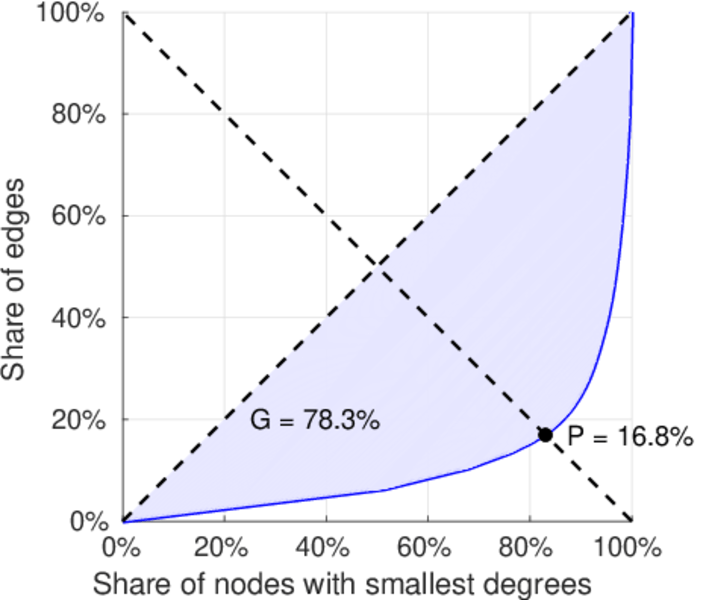
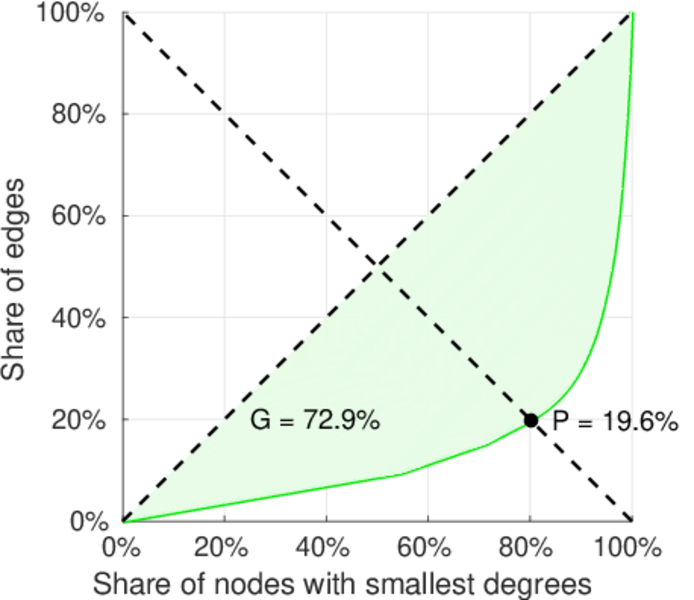
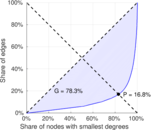
| Gini coefficient | G = | 0.779 795
|
| Balanced inequality ratio | P = | 0.172 948
|
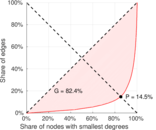
| Left balanced inequality ratio | P1 = | 0.145 210
|
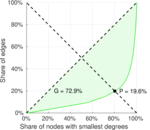
| Right balanced inequality ratio | P2 = | 0.196 372
|
| Relative edge distribution entropy | Her = | 0.851 905
|
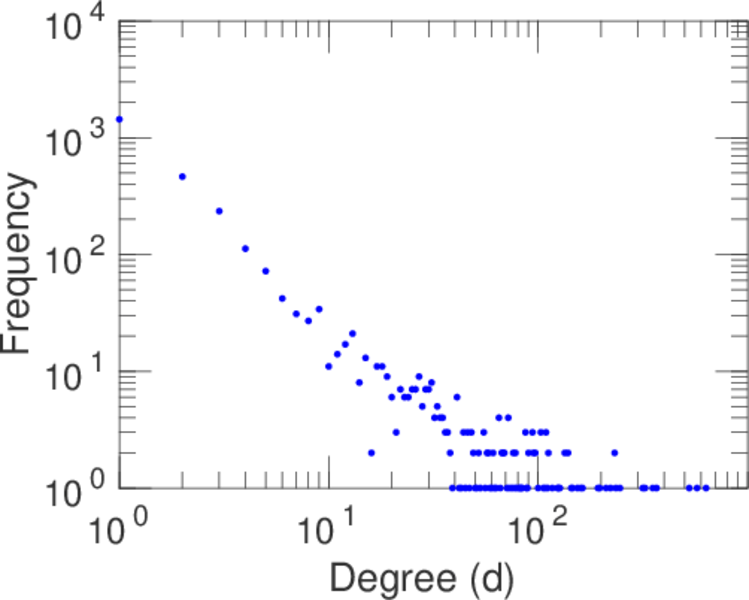
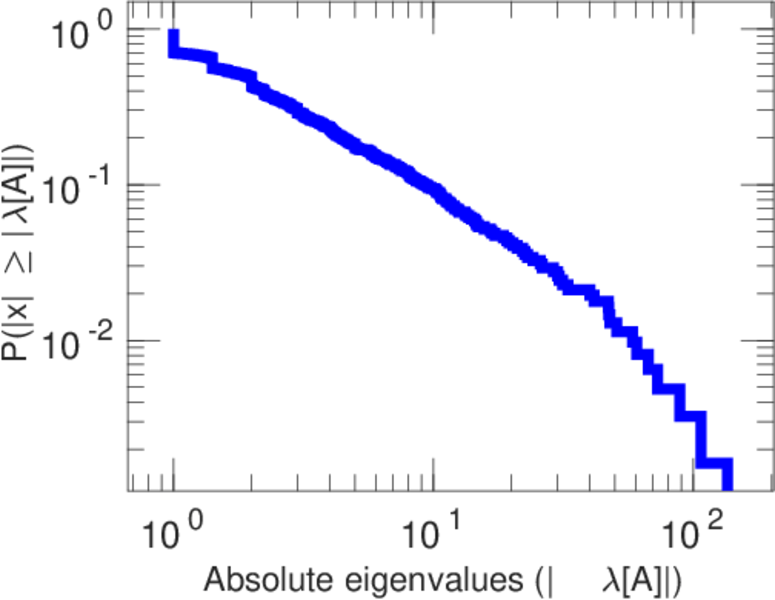
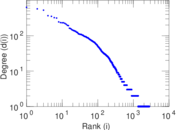
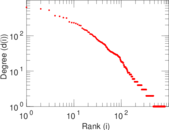
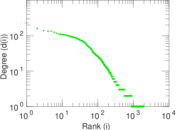
| Power law exponent | γ = | 2.765 43
|
| Tail power law exponent | γt = | 2.751 00
|
| Tail power law exponent with p | γ3 = | 2.751 00
|
| p-value | p = | 0.794 000
|
| Left tail power law exponent with p | γ3,1 = | 1.801 00
|
| Left p-value | p1 = | 0.011 000 0
|
| Right tail power law exponent with p | γ3,2 = | 2.131 00
|
| Right p-value | p2 = | 0.000 00
|
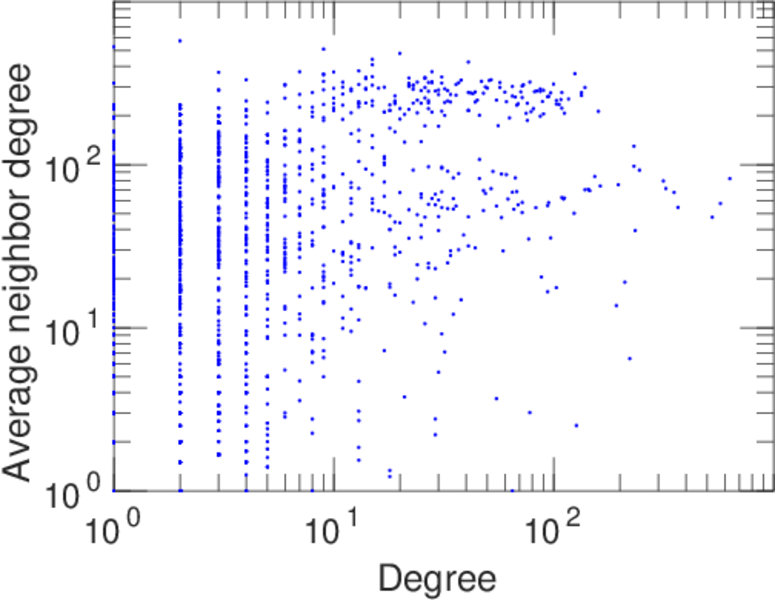
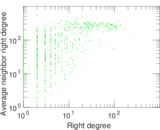
| Degree assortativity | ρ = | −0.055 698 0
|
| Degree assortativity p-value | pρ = | 2.784 26 × 10−5
|
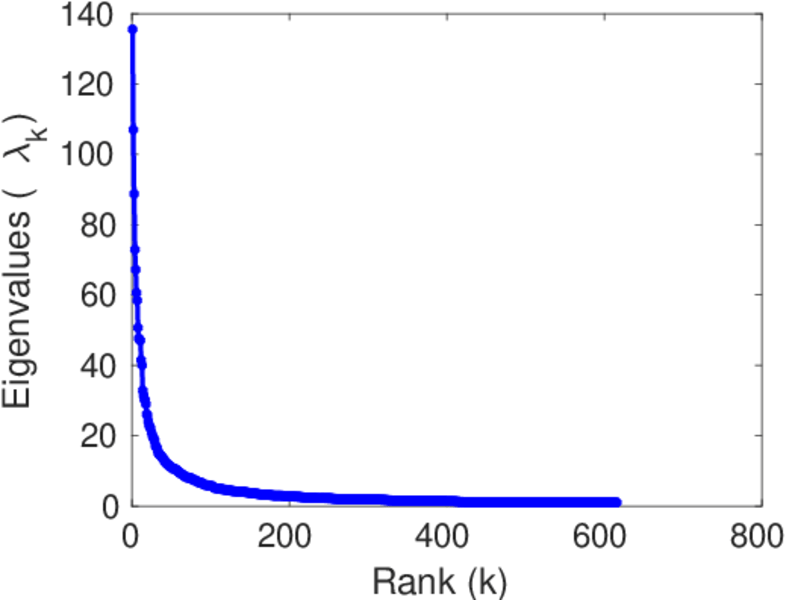
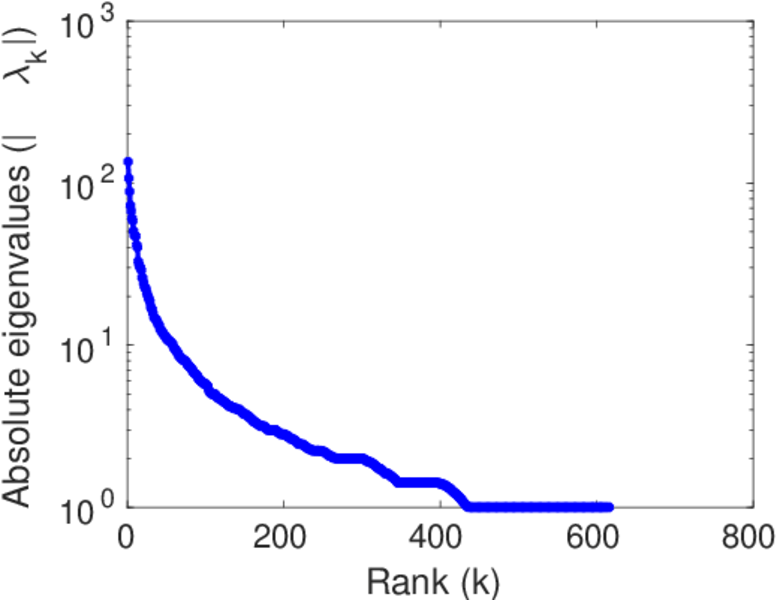
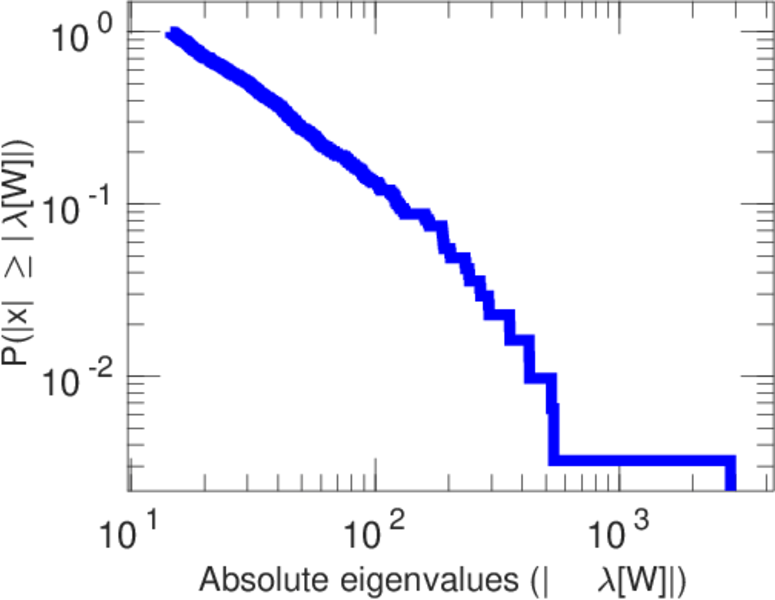
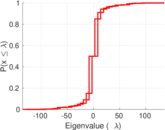
| Spectral norm | α = | 135.567
|
| Algebraic connectivity | a = | 0.010 321 7
|
| Spectral separation | |λ1[A] / λ2[A]| = | 1.267 25
|
| Controllability | C = | 1,258
|
| Relative controllability | Cr = | 0.449 768
|
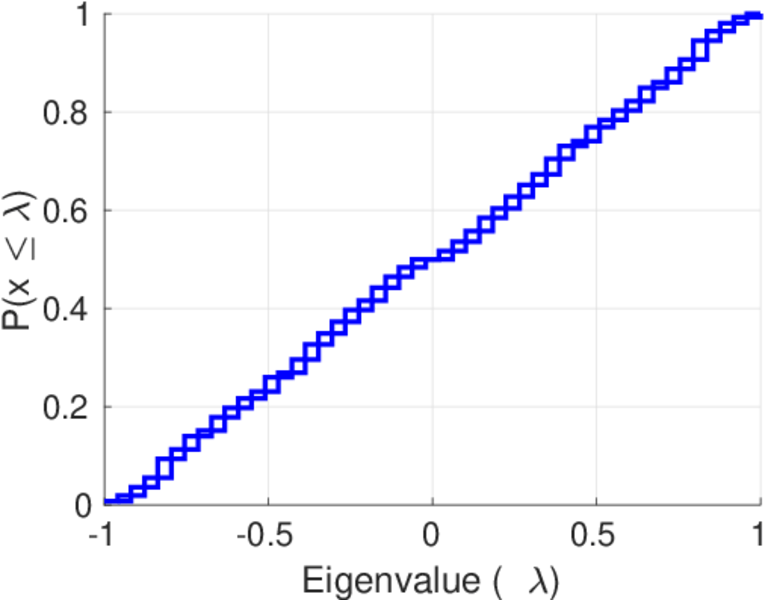
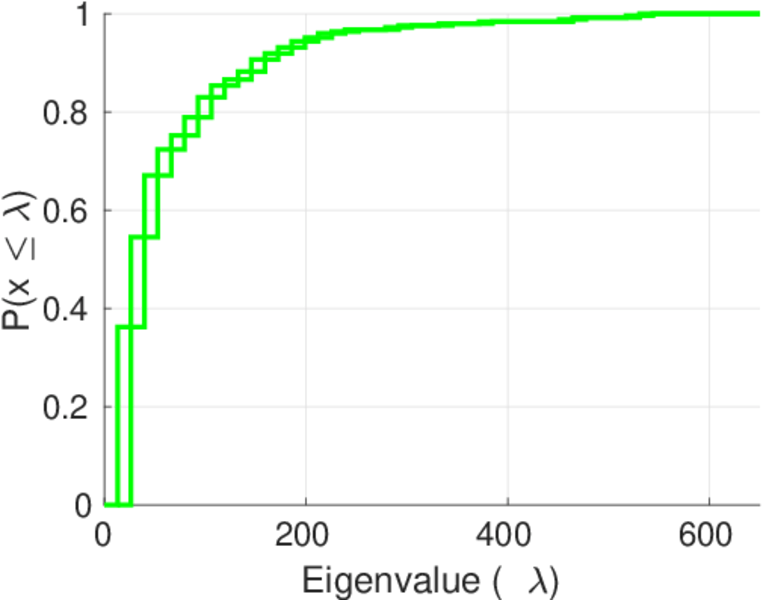
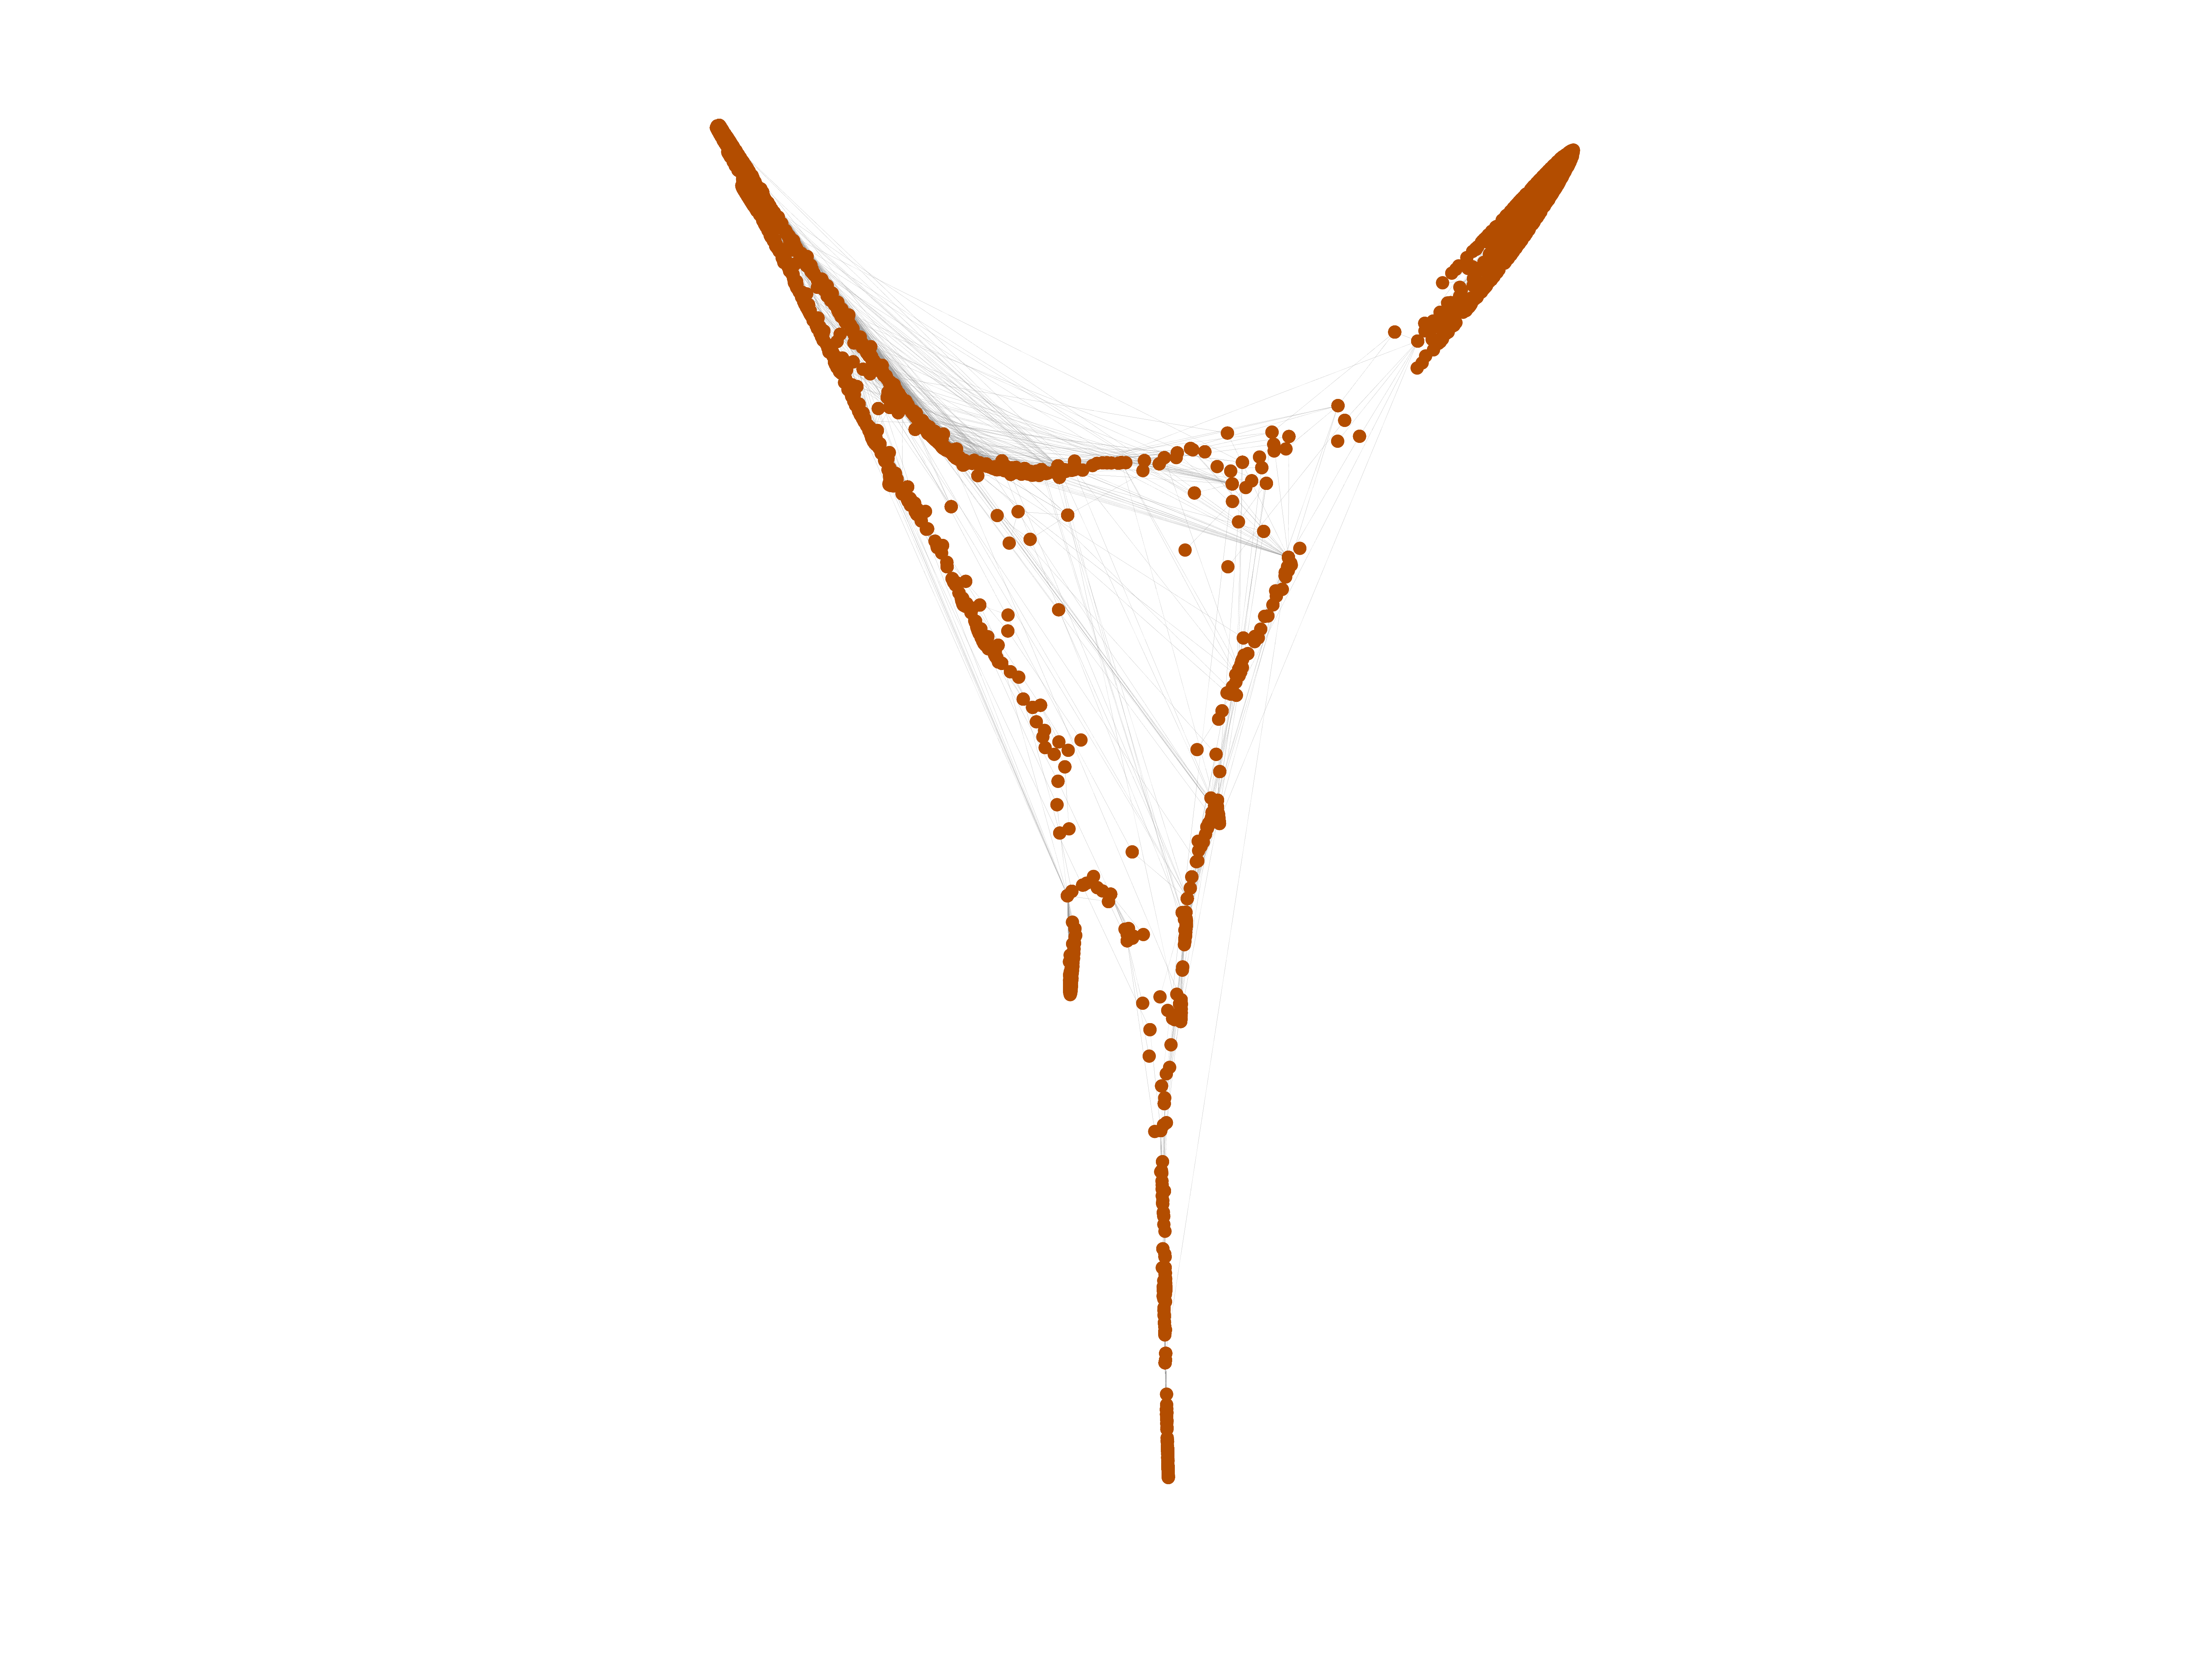
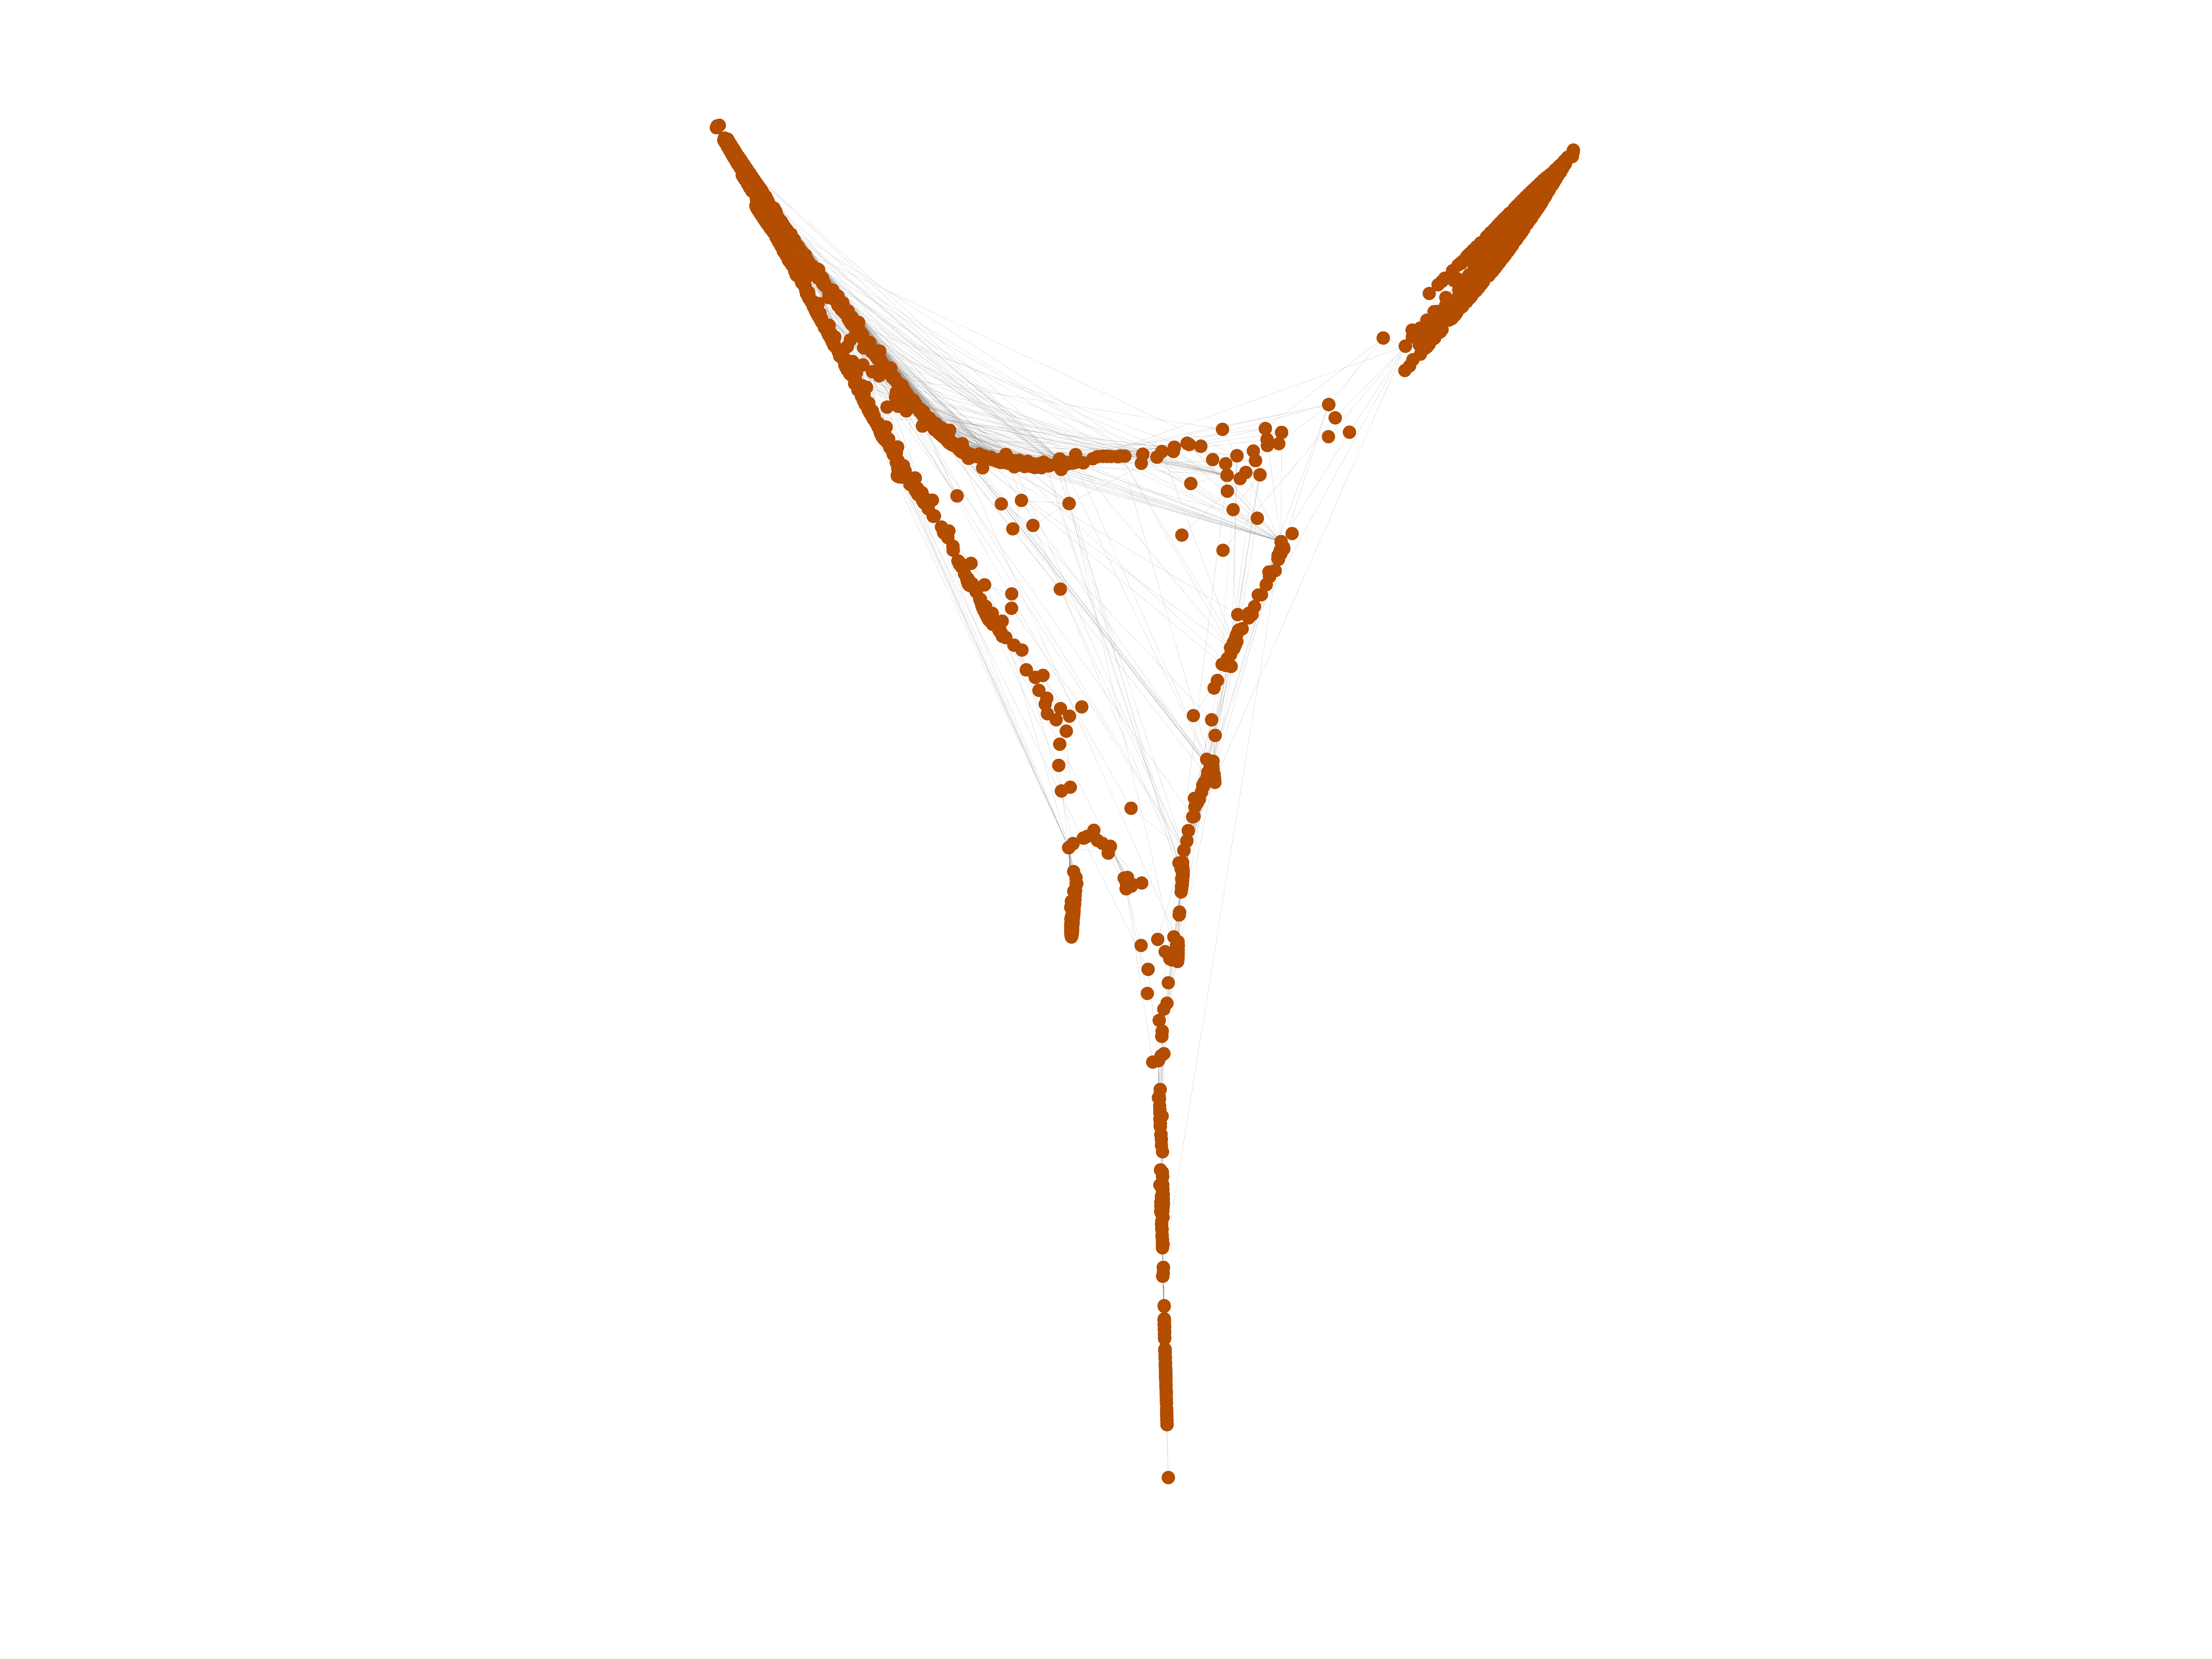
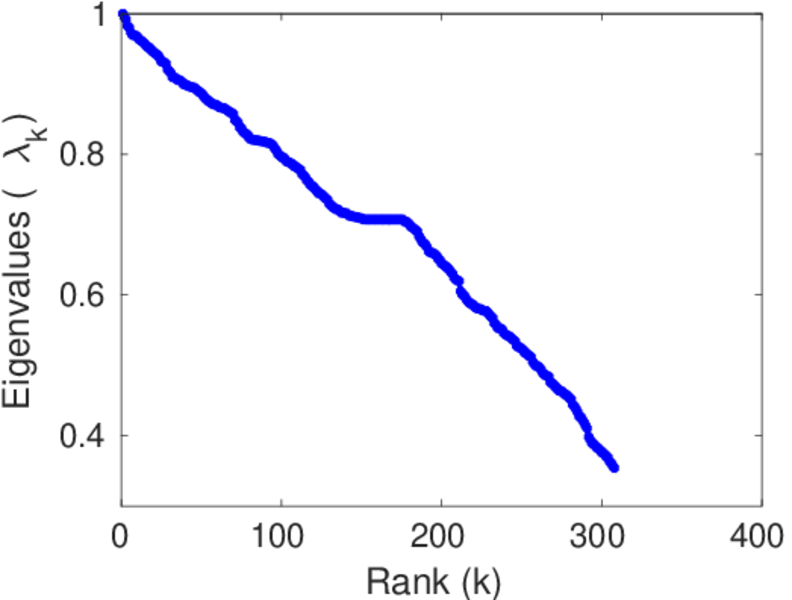
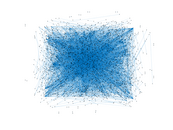
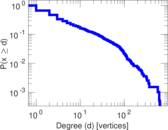
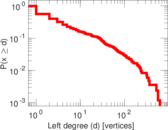
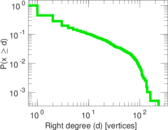
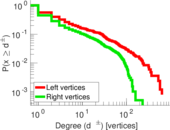
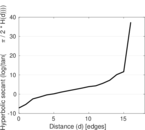
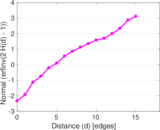
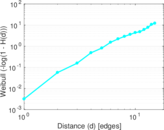
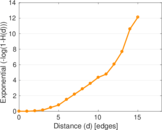
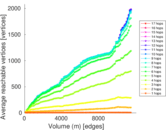
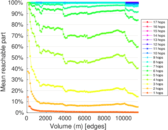
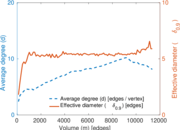
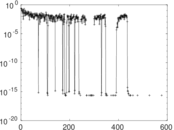
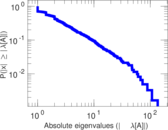
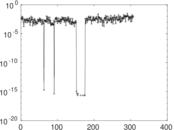
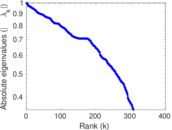
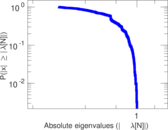
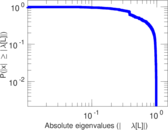
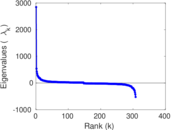
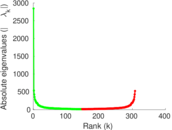
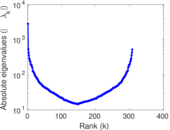
Plots


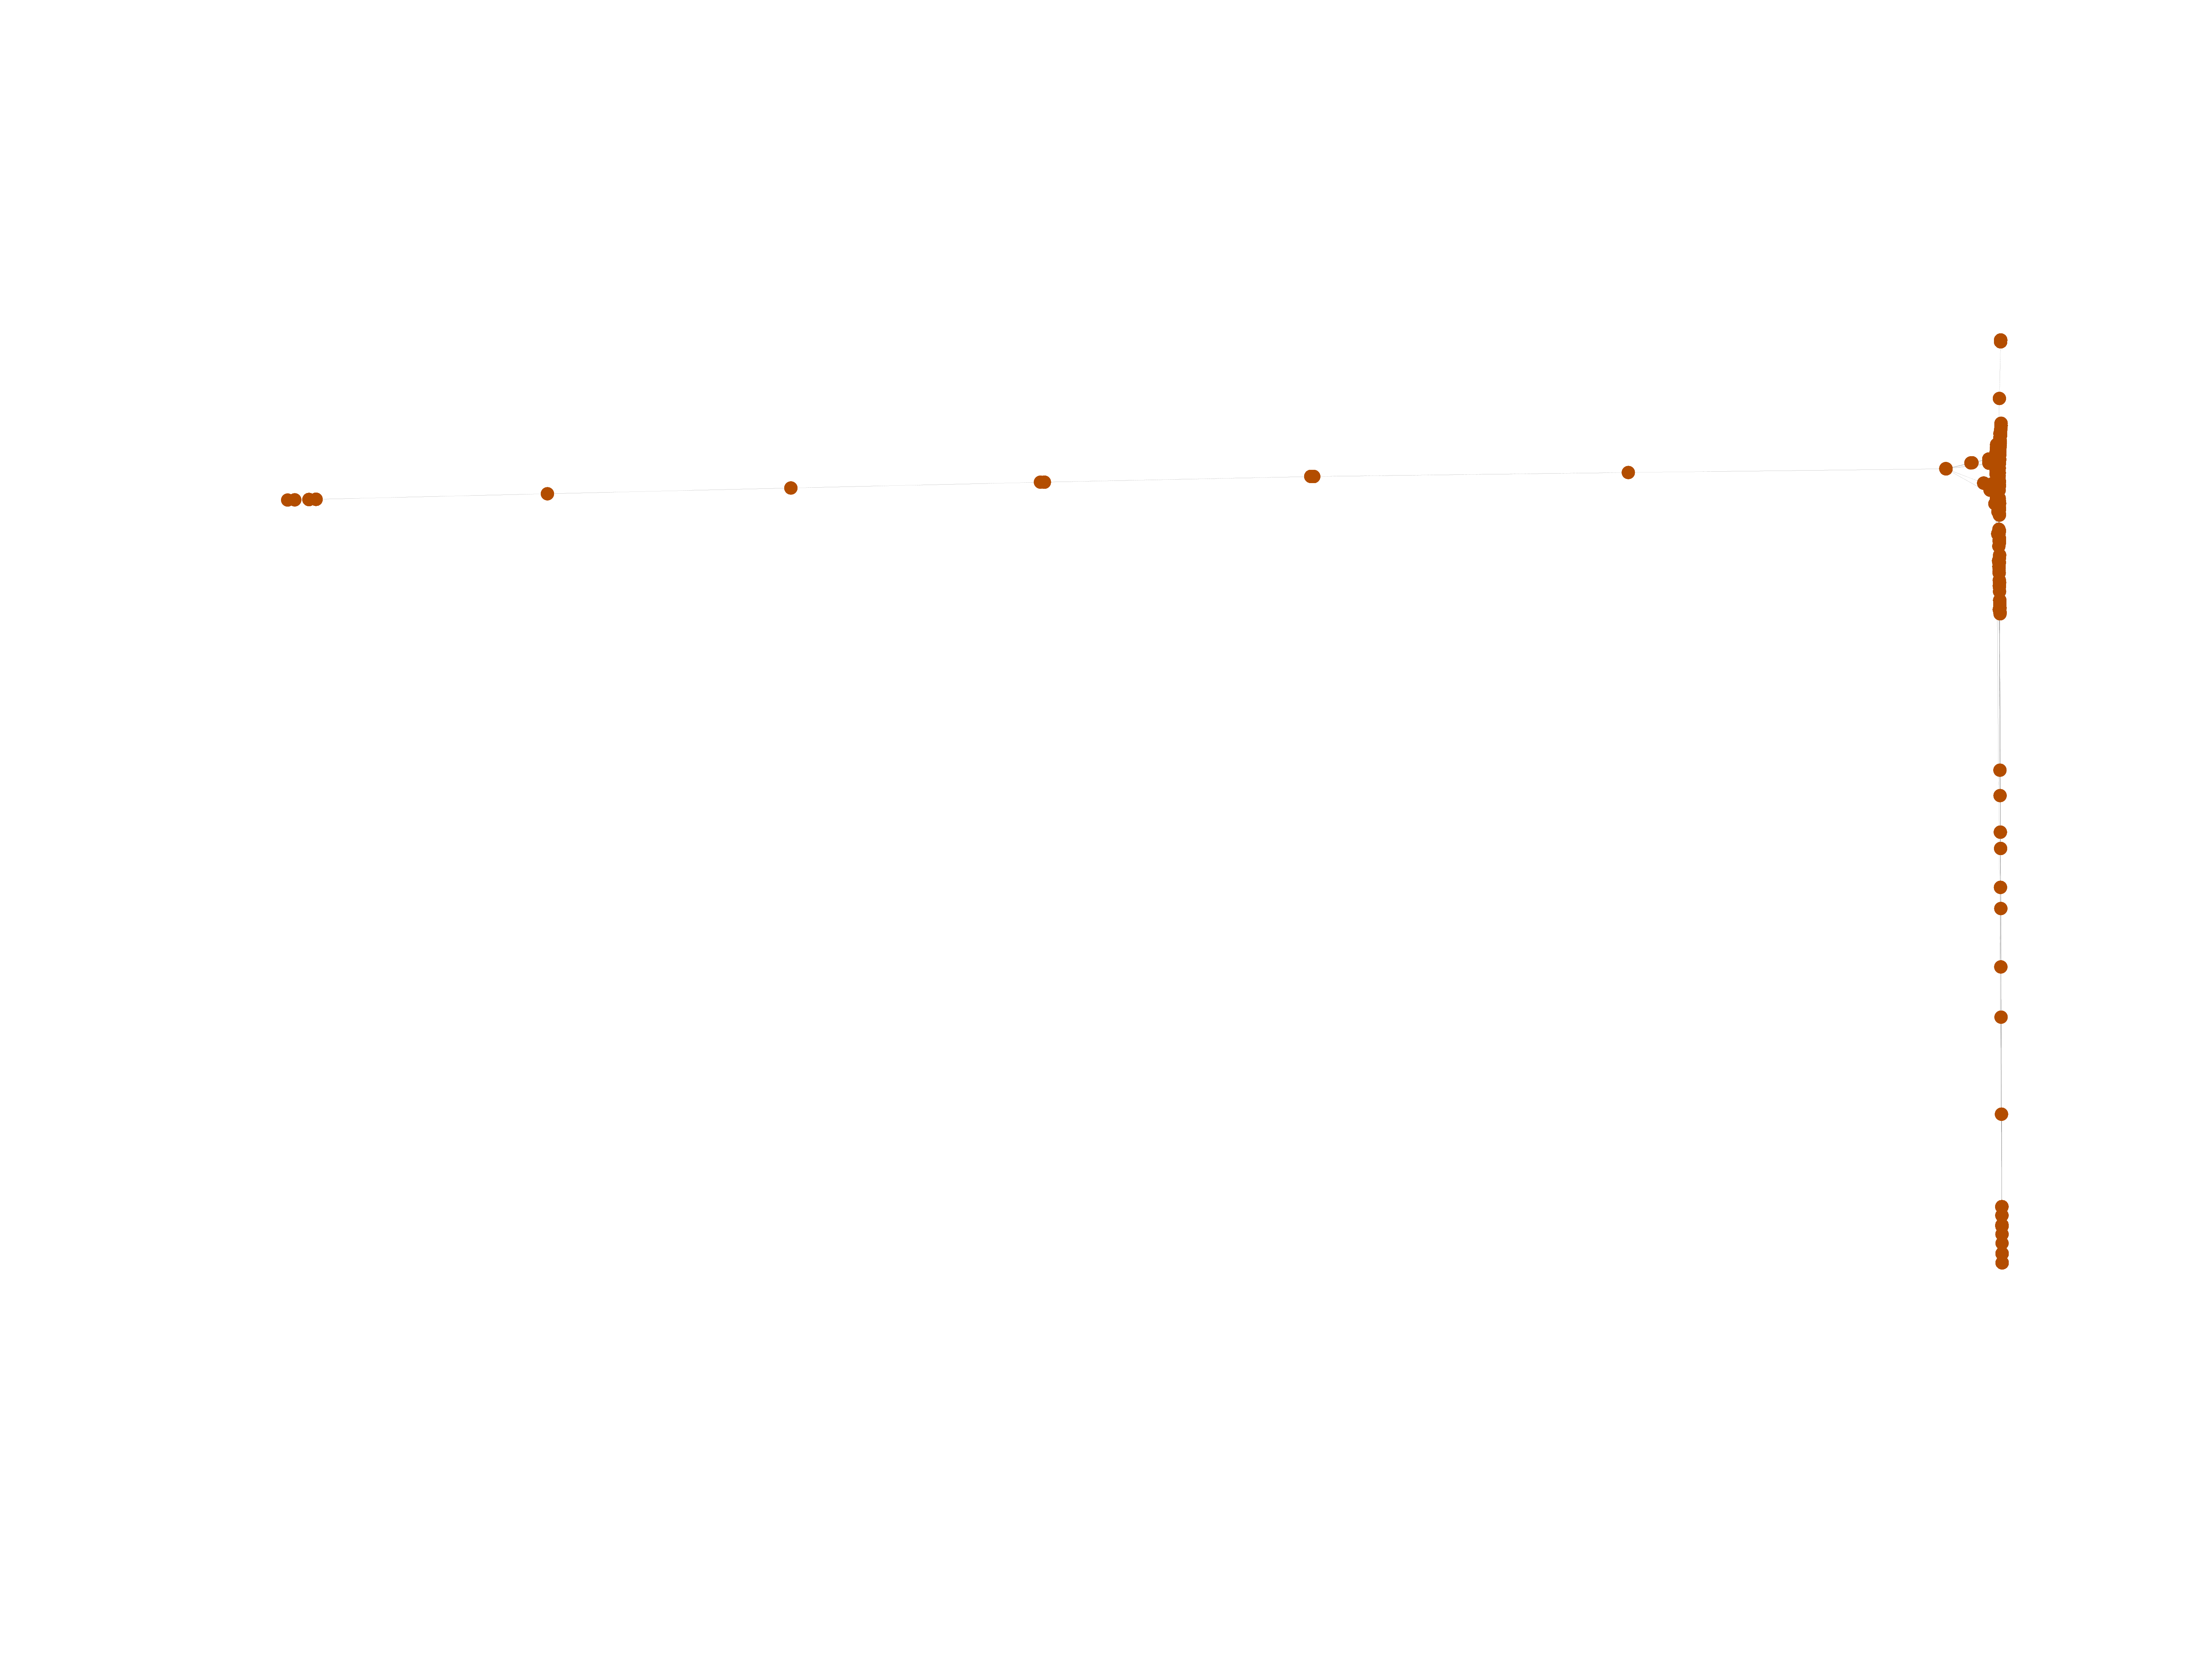
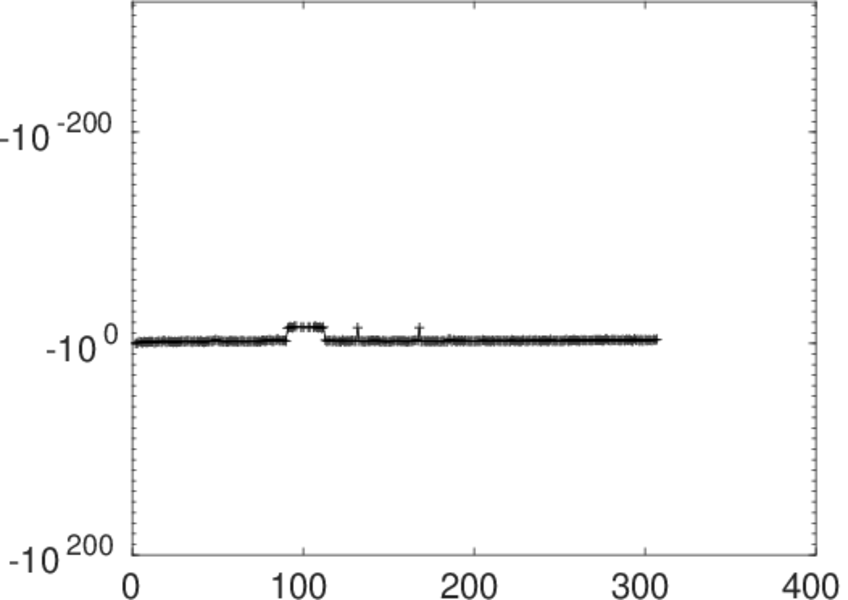
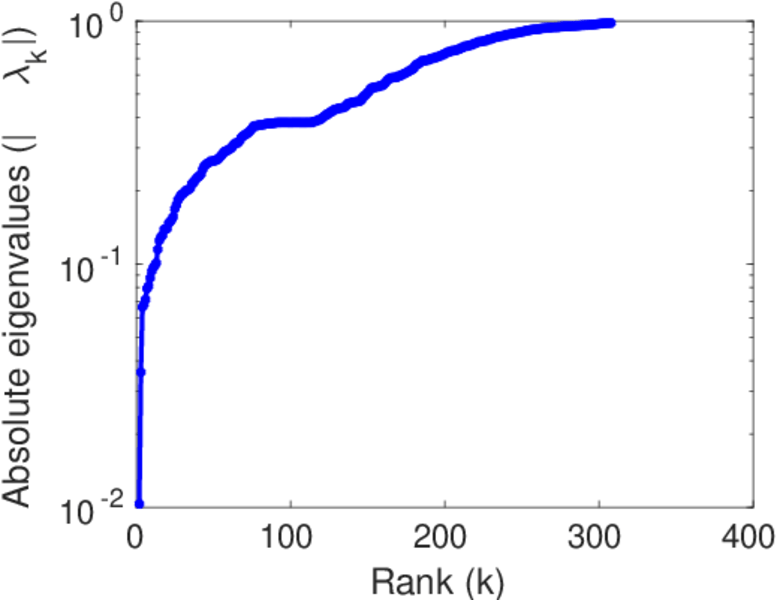
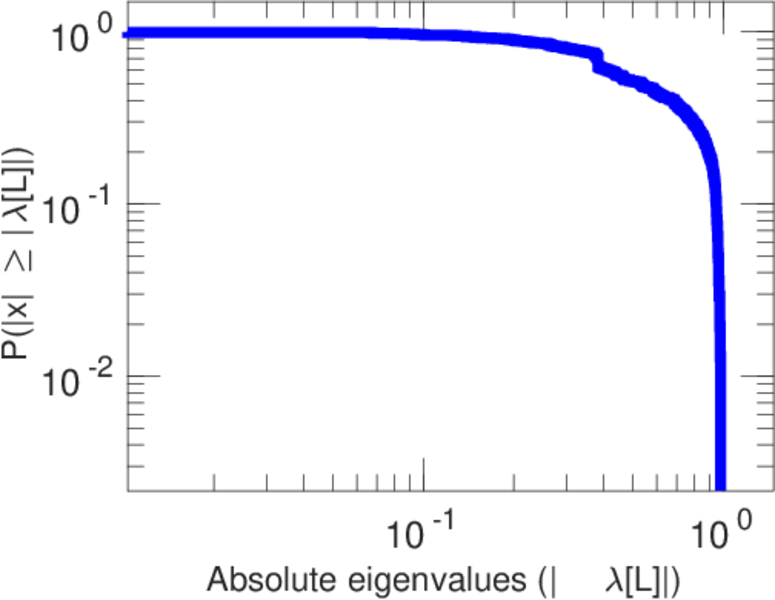
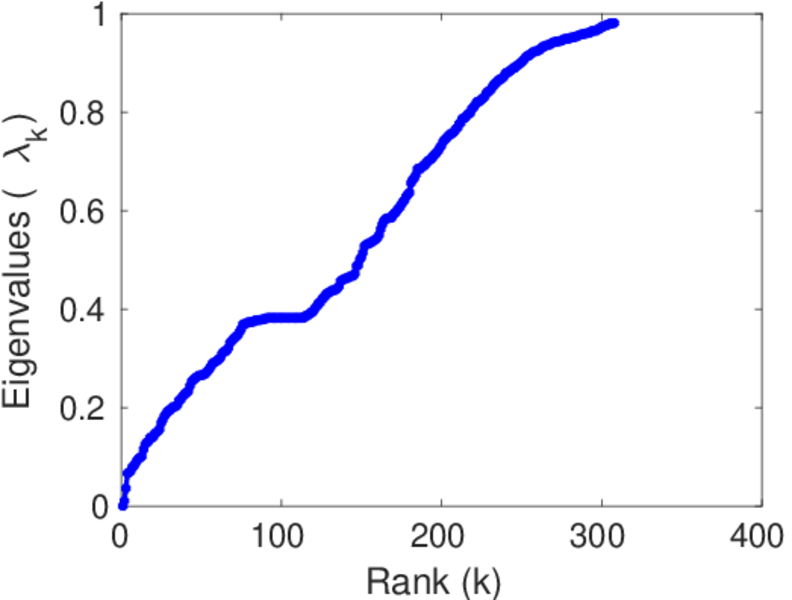
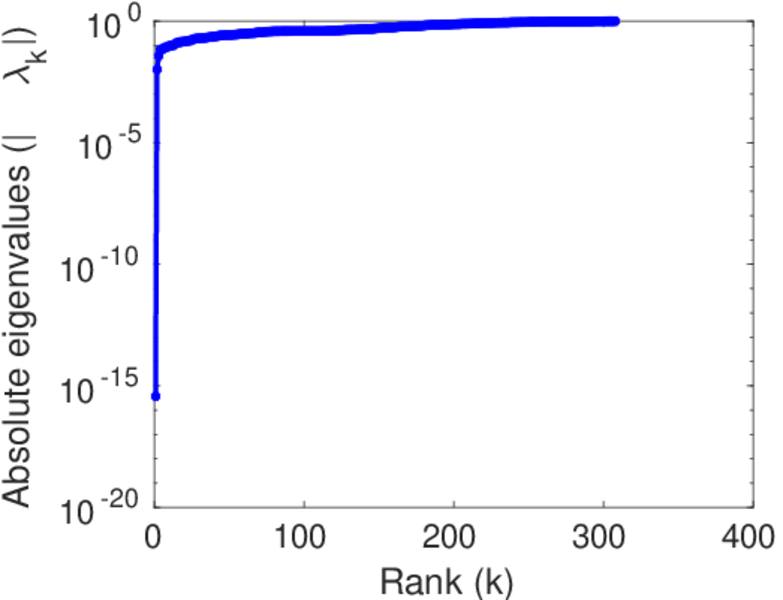
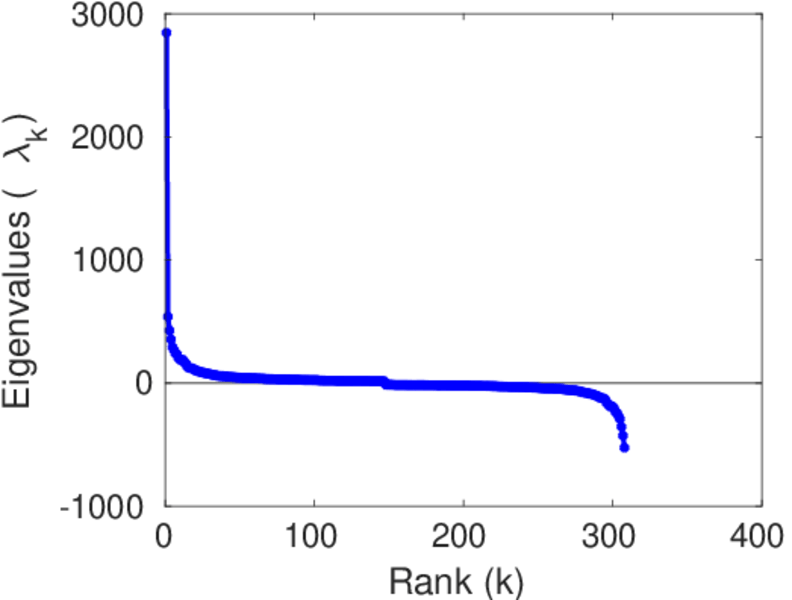
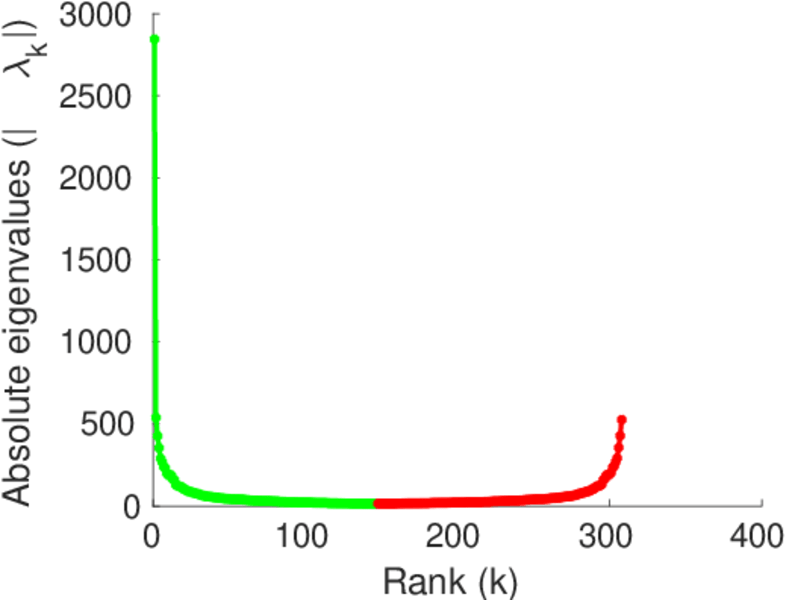
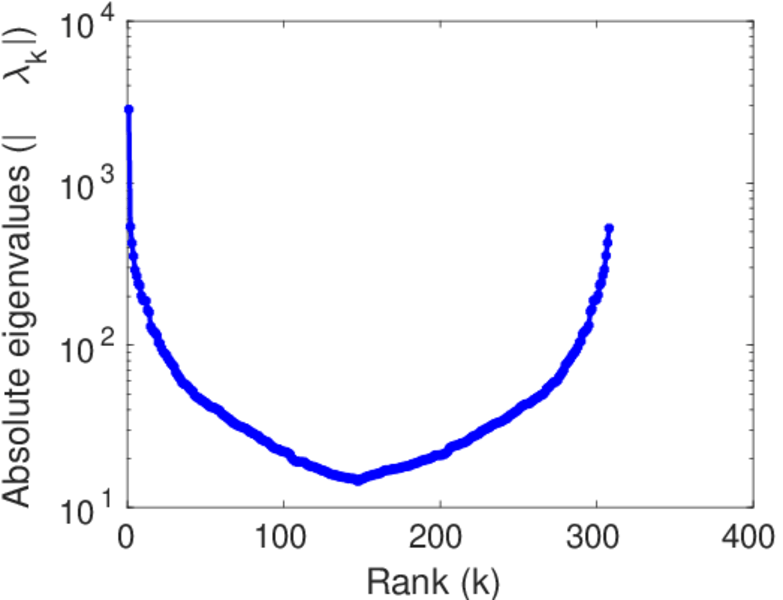
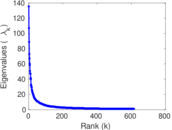
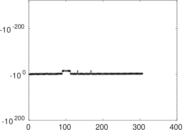
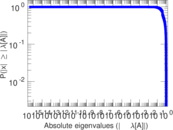
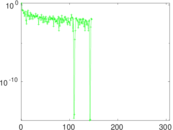
Matrix decompositions plots


Downloads
References
|
[1]
|
Jérôme Kunegis.
KONECT – The Koblenz Network Collection.
In Proc. Int. Conf. on World Wide Web Companion, pages
1343–1350, 2013.
[ http ]
|
|
[2]
|
Wikimedia Foundation.
Wikimedia downloads.
http://dumps.wikimedia.org/, January 2010.
|
 KONECT ‣ Networks ‣
Buy Me a Coffee
KONECT ‣ Networks ‣
Buy Me a Coffee