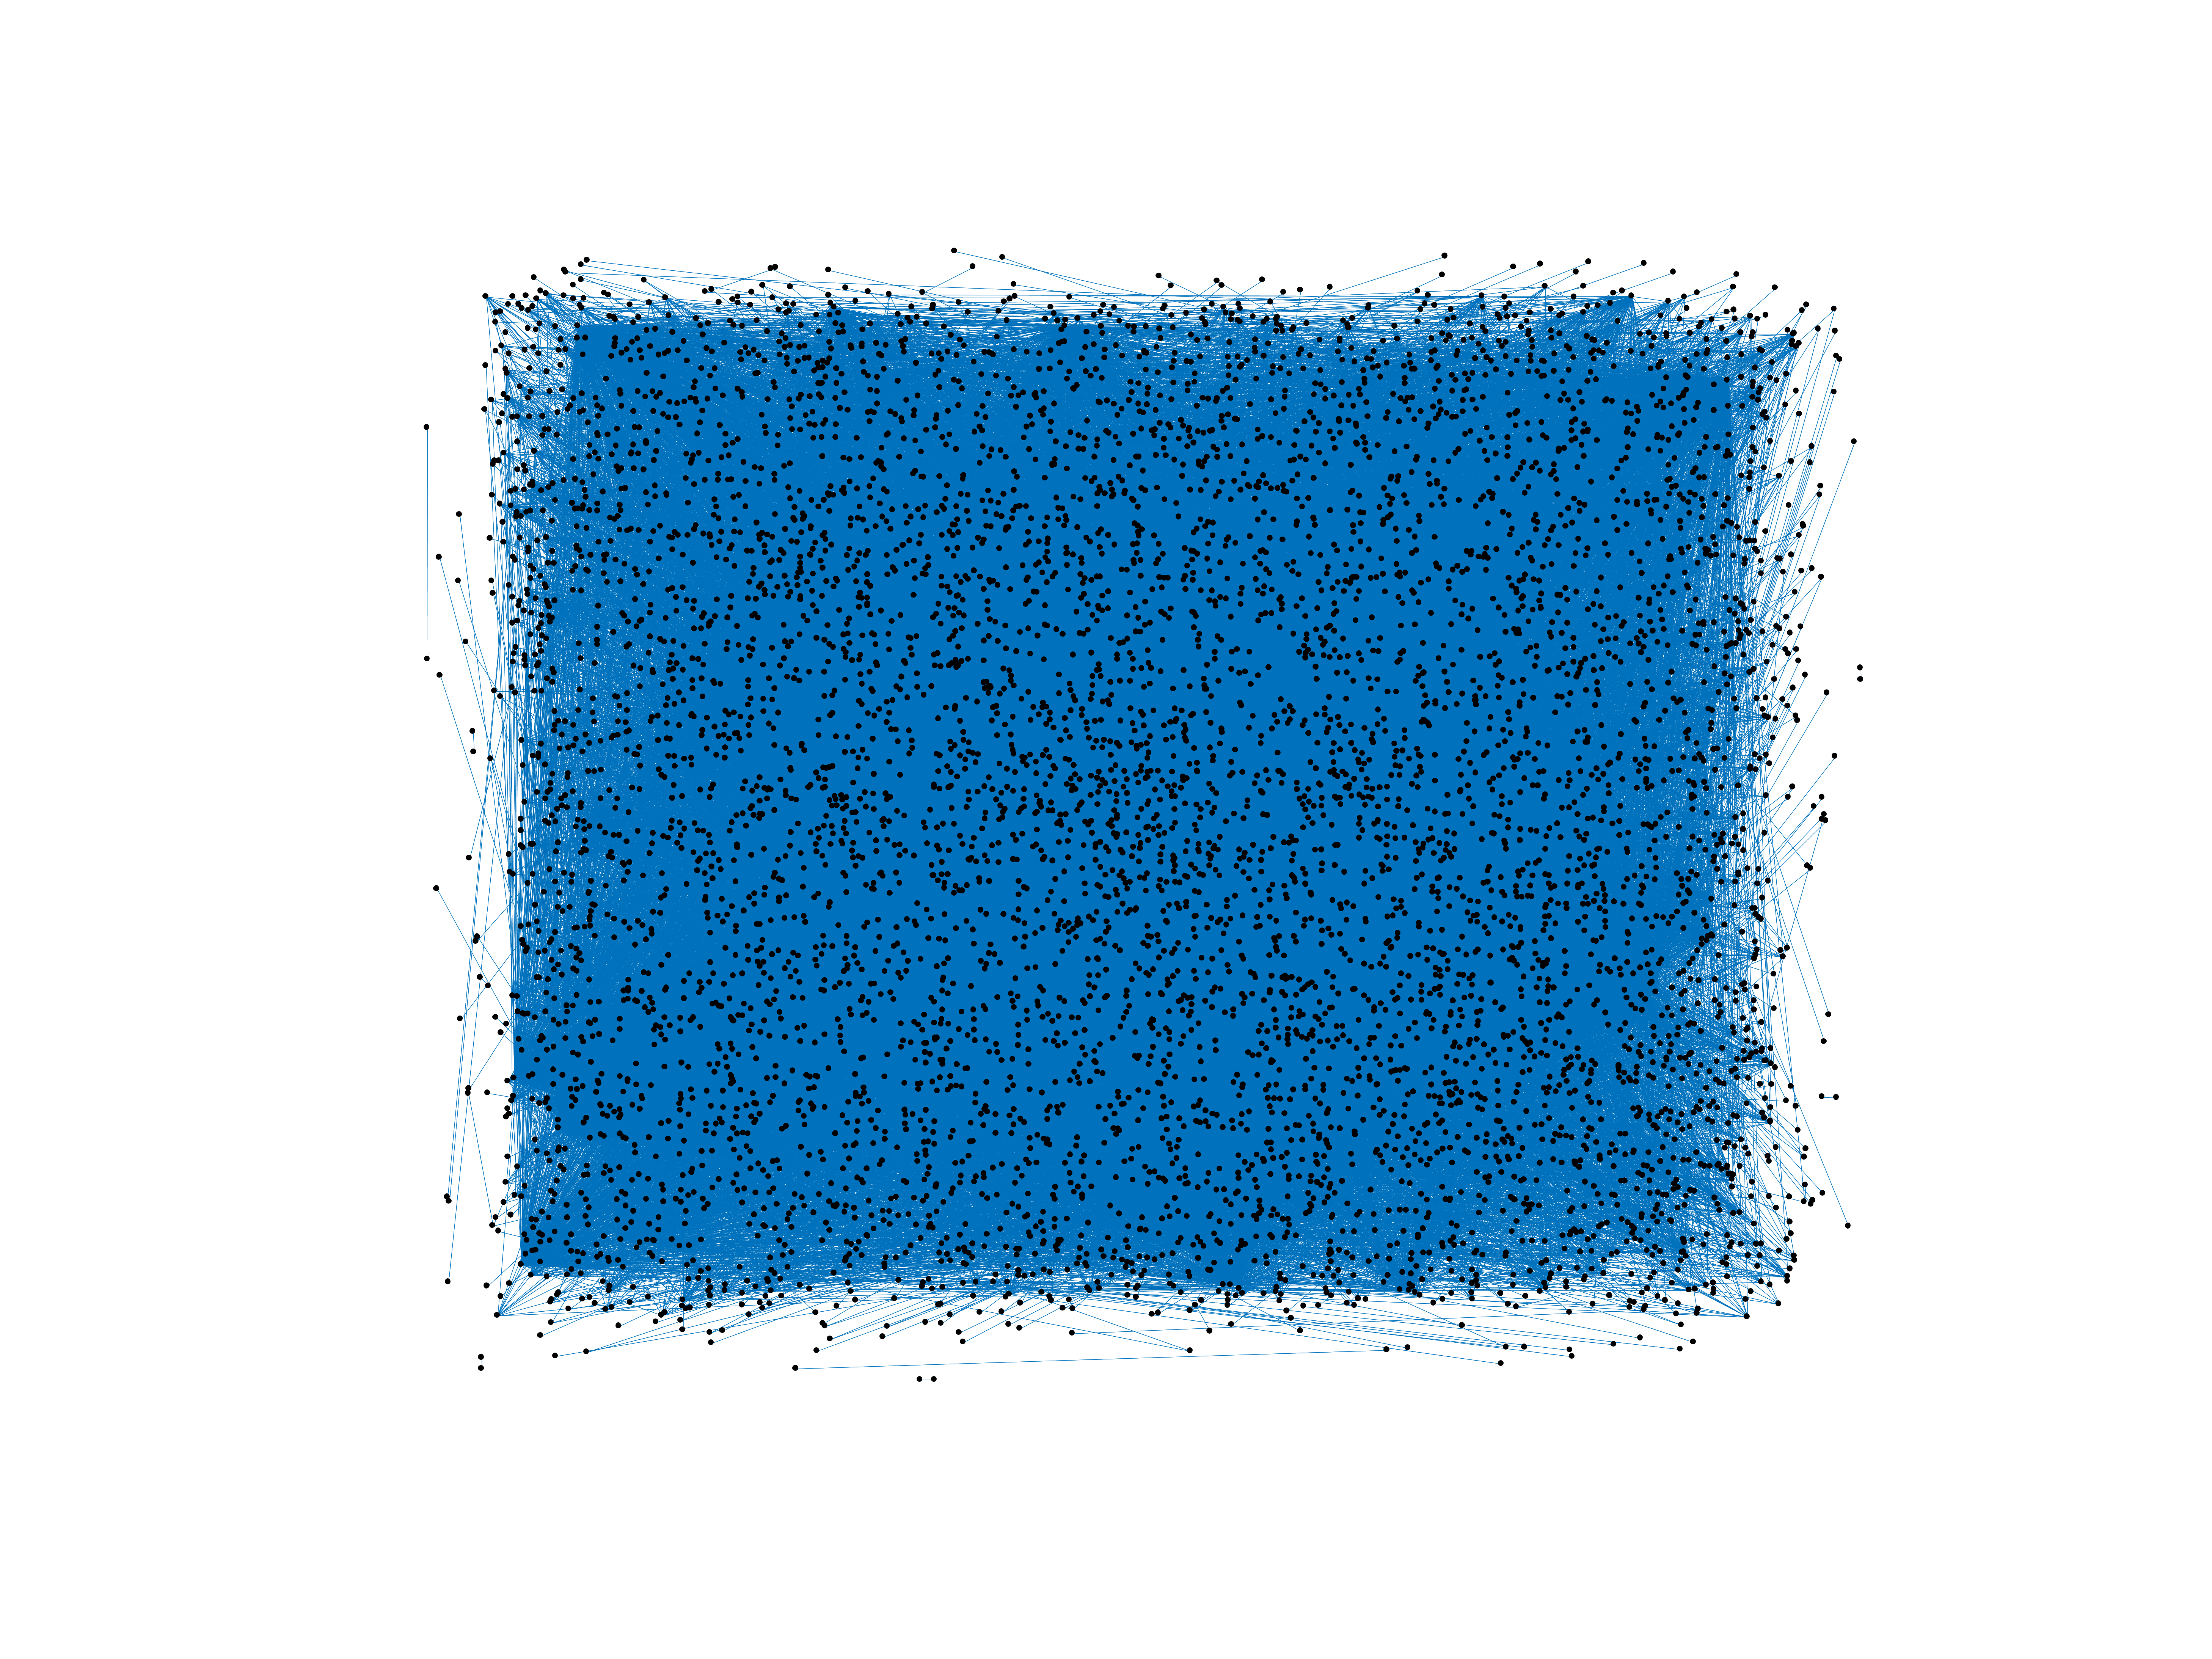
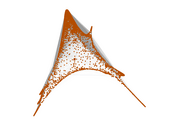
Wikipedia edits (arc)
This is the bipartite edit network of the Aramaic Wikipedia. It contains users
and pages from the Aramaic Wikipedia, connected by edit events. Each edge
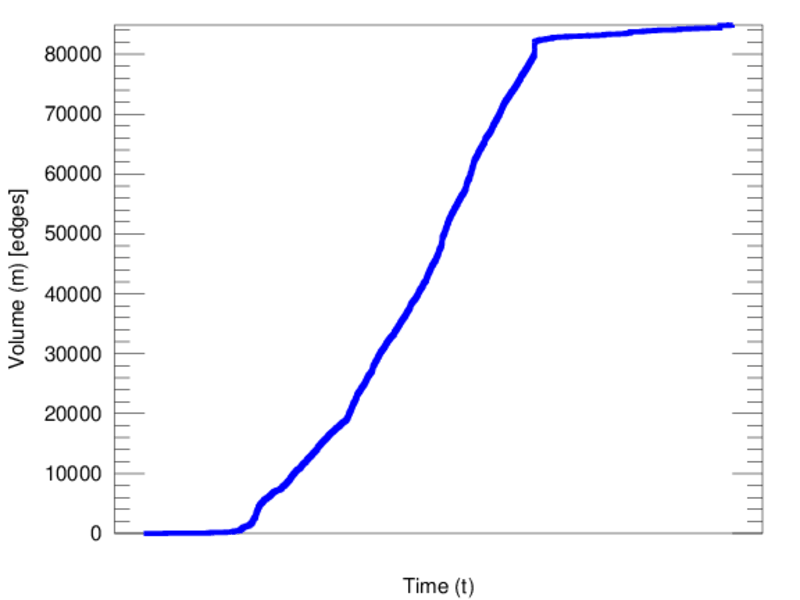
represents an edit. The dataset includes the timestamp of each edit.
Metadata
Statistics
| Size | n = | 6,846
|
| Left size | n1 = | 966
|
| Right size | n2 = | 5,880
|
| Volume | m = | 84,862
|
| Unique edge count | m̿ = | 35,706
|
| Wedge count | s = | 14,140,011
|
| Claw count | z = | 5,811,163,842
|
| Cross count | x = | 2,226,778,650,704
|
| Square count | q = | 46,224,207
|
| 4-Tour count | T4 = | 426,448,992
|
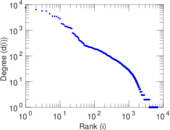
| Maximum degree | dmax = | 7,609
|
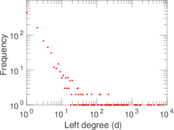
| Maximum left degree | d1max = | 7,609
|
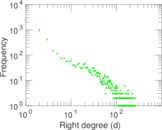
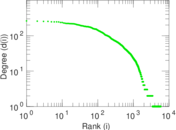
| Maximum right degree | d2max = | 262
|
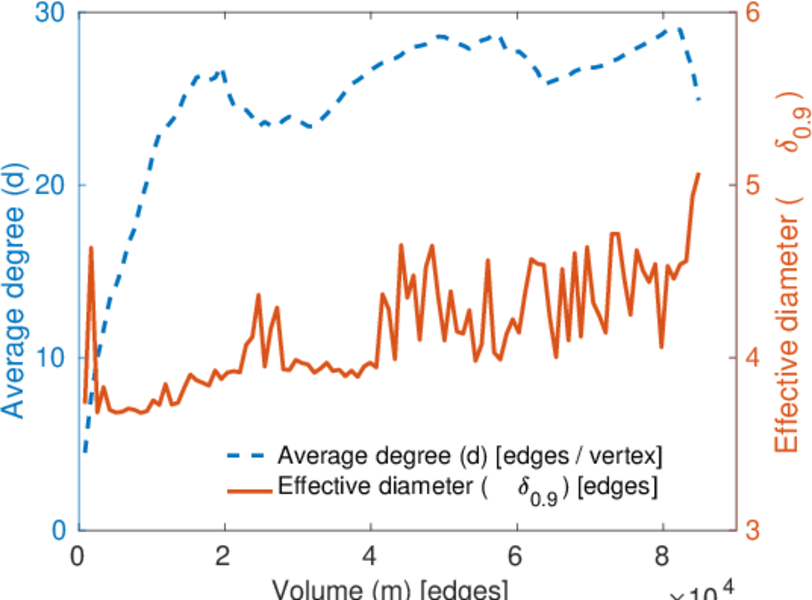
| Average degree | d = | 24.791 7
|
| Average left degree | d1 = | 87.848 9
|
| Average right degree | d2 = | 14.432 3
|
| Fill | p = | 0.006 286 18
|
| Average edge multiplicity | m̃ = | 2.376 69
|
| Size of LCC | N = | 6,079
|
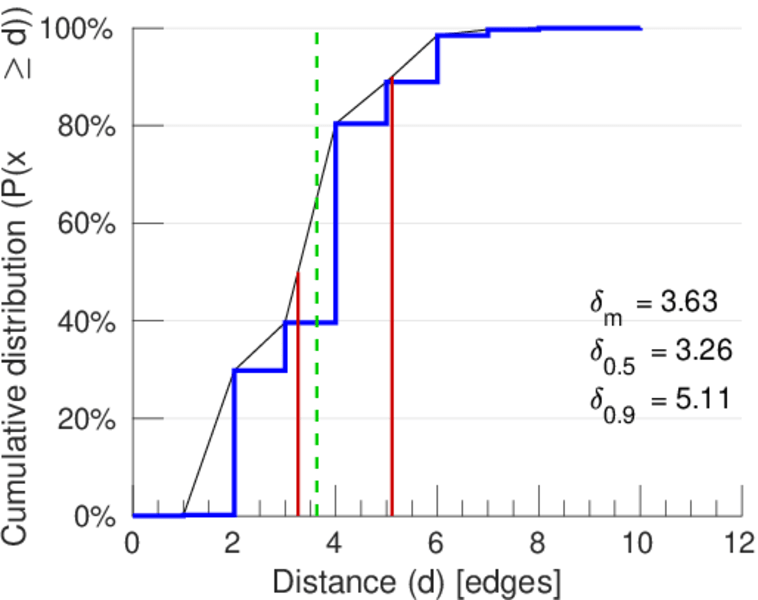
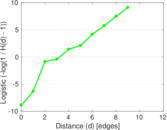
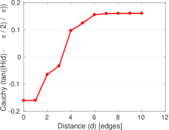
| Diameter | δ = | 12
|
| 50-Percentile effective diameter | δ0.5 = | 3.255 08
|
| 90-Percentile effective diameter | δ0.9 = | 5.108 67
|
| Median distance | δM = | 4
|
| Mean distance | δm = | 3.629 73
|
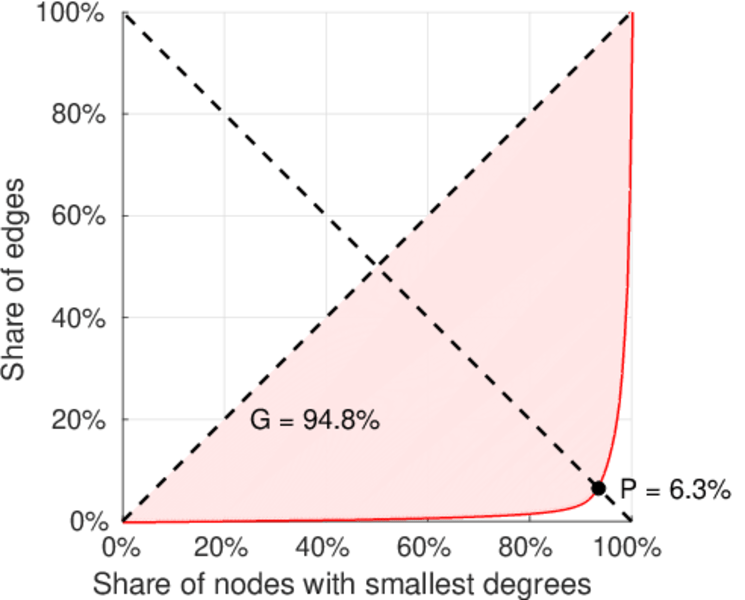
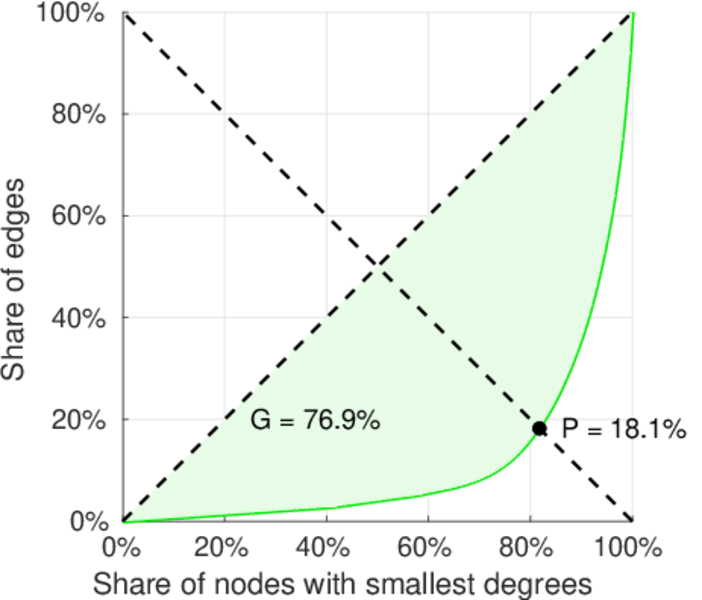
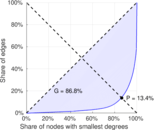
| Gini coefficient | G = | 0.868 505
|
| Balanced inequality ratio | P = | 0.139 880
|
| Left balanced inequality ratio | P1 = | 0.062 949 3
|
| Right balanced inequality ratio | P2 = | 0.180 717
|
| Relative edge distribution entropy | Her = | 0.772 304
|
| Power law exponent | γ = | 2.064 74
|
| Tail power law exponent | γt = | 1.711 00
|
| Tail power law exponent with p | γ3 = | 1.711 00
|
| p-value | p = | 0.000 00
|
| Left tail power law exponent with p | γ3,1 = | 1.711 00
|
| Left p-value | p1 = | 0.000 00
|
| Right tail power law exponent with p | γ3,2 = | 8.951 00
|
| Right p-value | p2 = | 0.303 000
|
| Degree assortativity | ρ = | −0.276 241
|
| Degree assortativity p-value | pρ = | 0.000 00
|
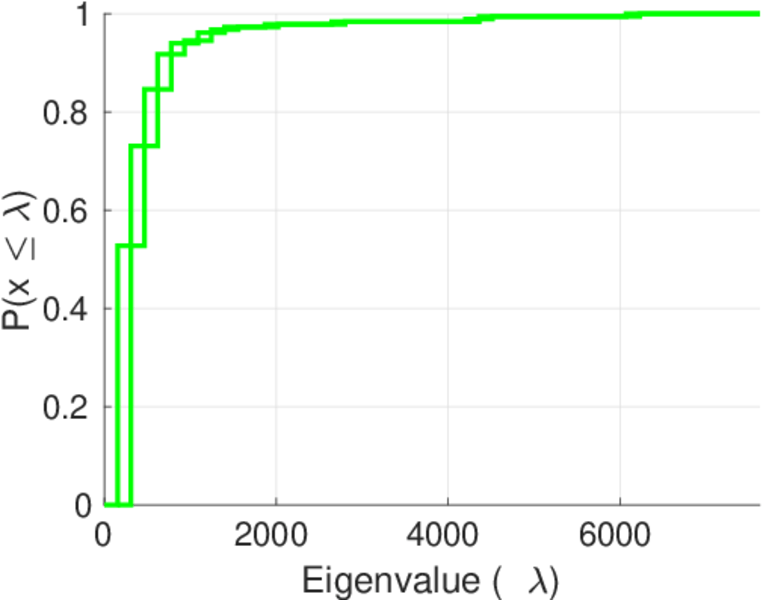
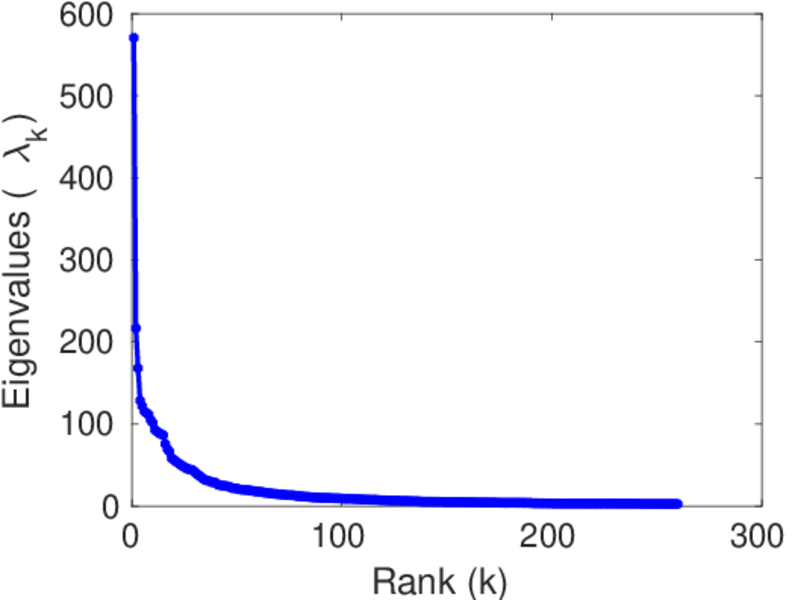
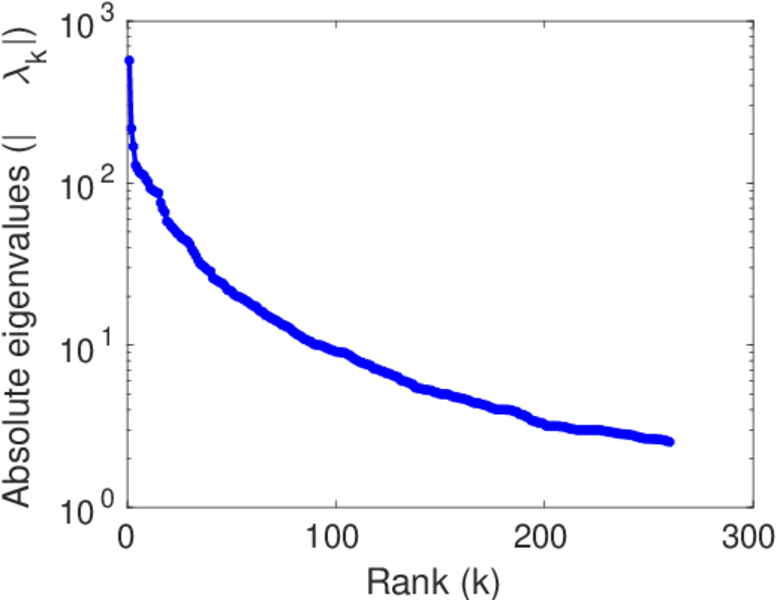
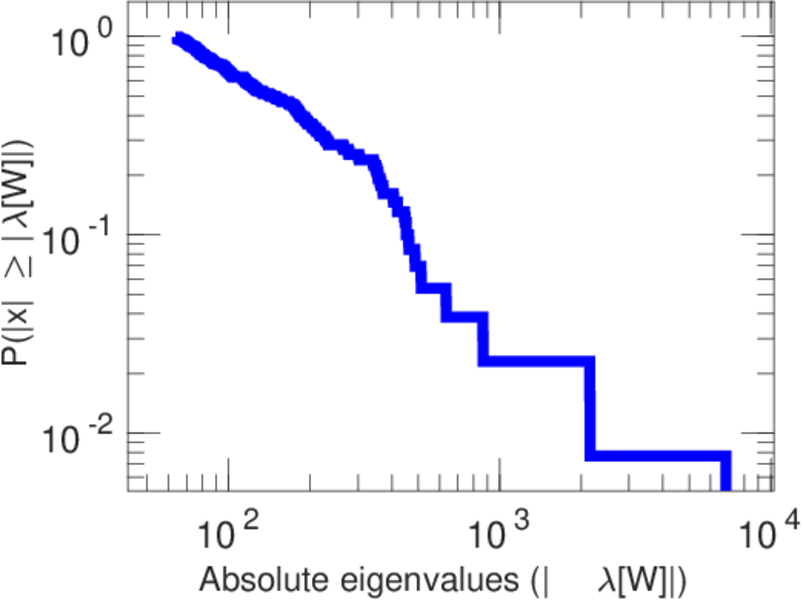
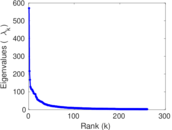
| Spectral norm | α = | 570.618
|
| Algebraic connectivity | a = | 0.030 683 8
|
| Spectral separation | |λ1[A] / λ2[A]| = | 2.633 51
|
| Controllability | C = | 5,051
|
| Relative controllability | Cr = | 0.740 942
|
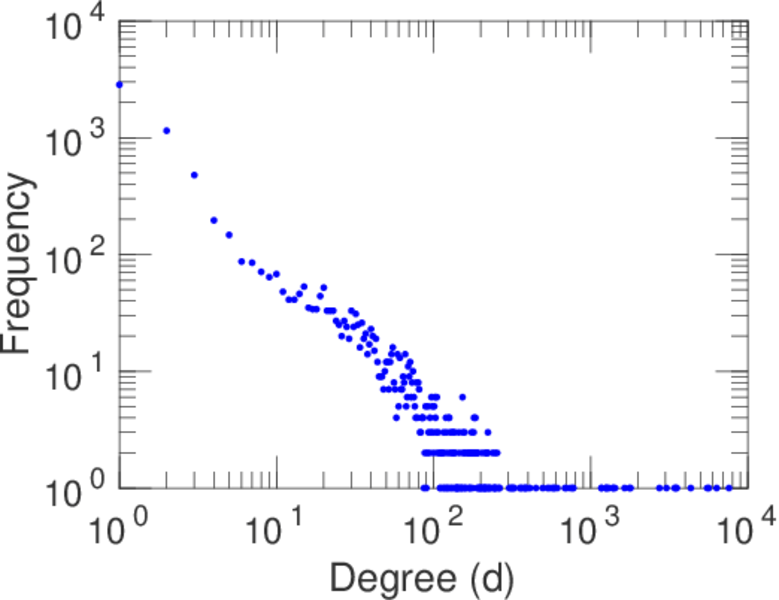
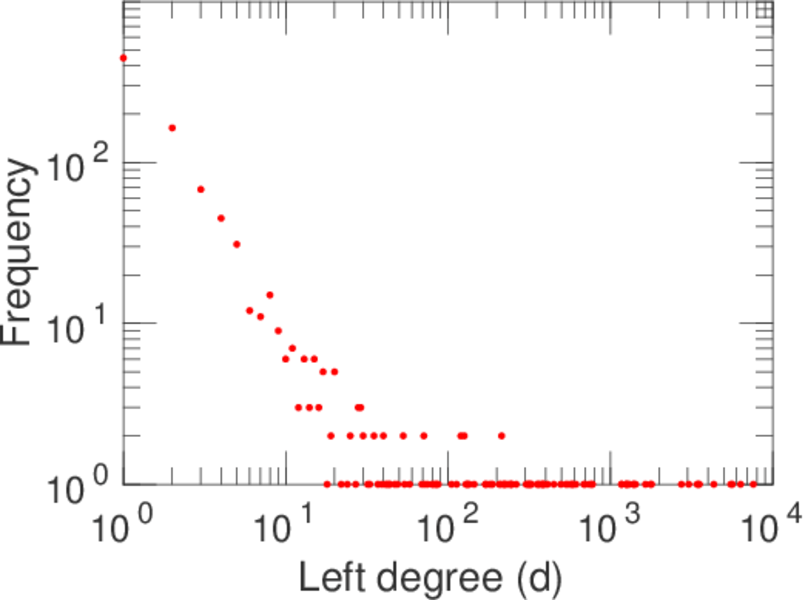
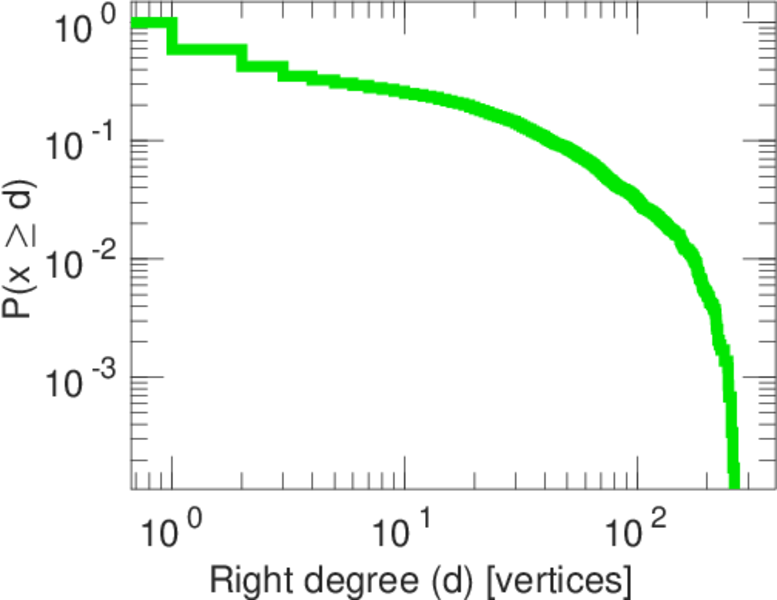
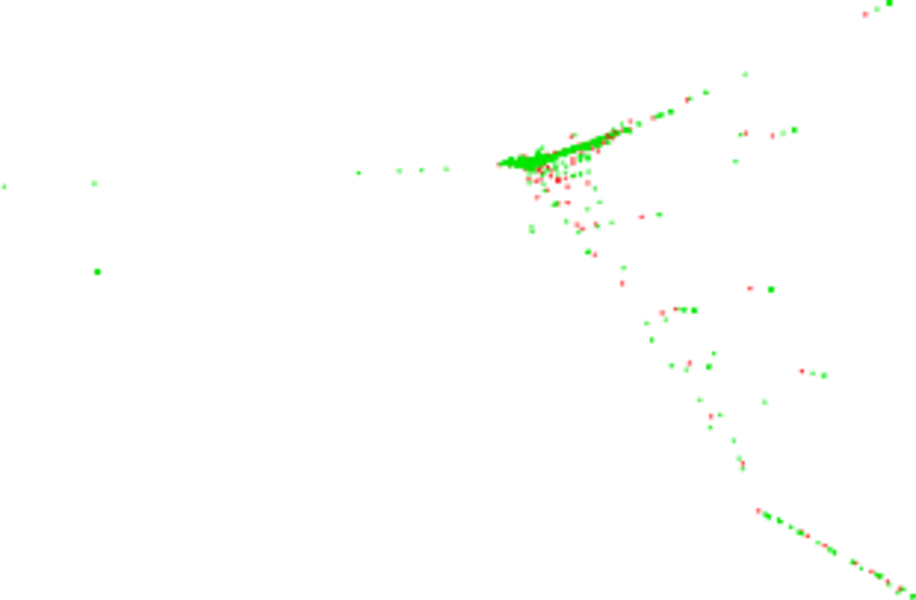
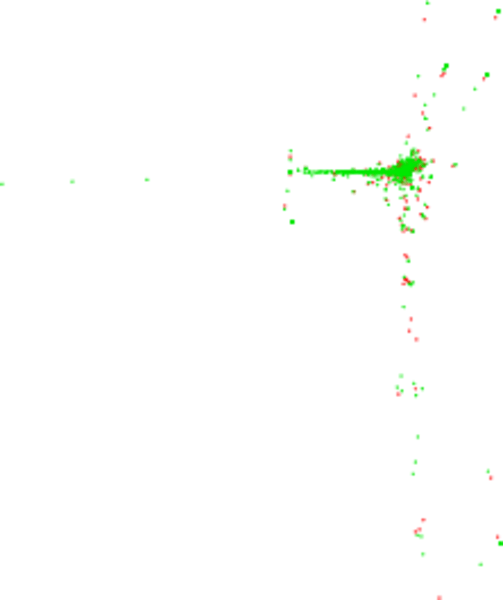
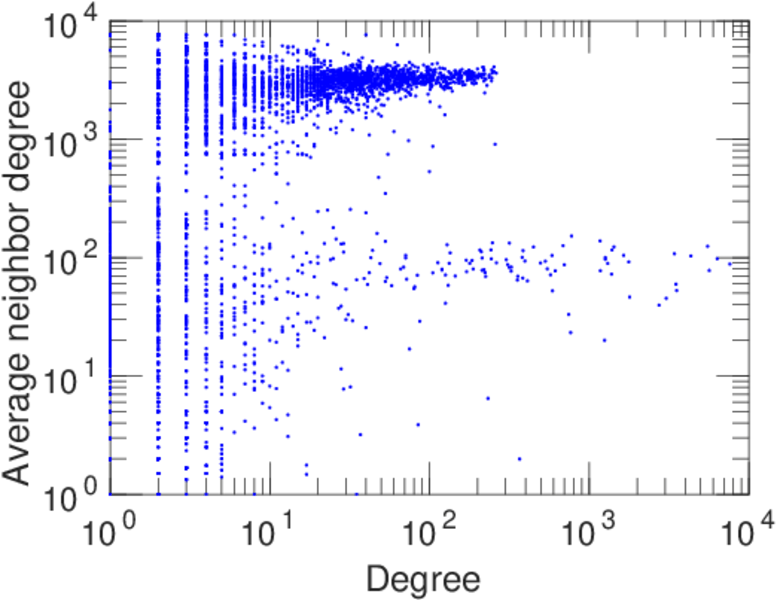
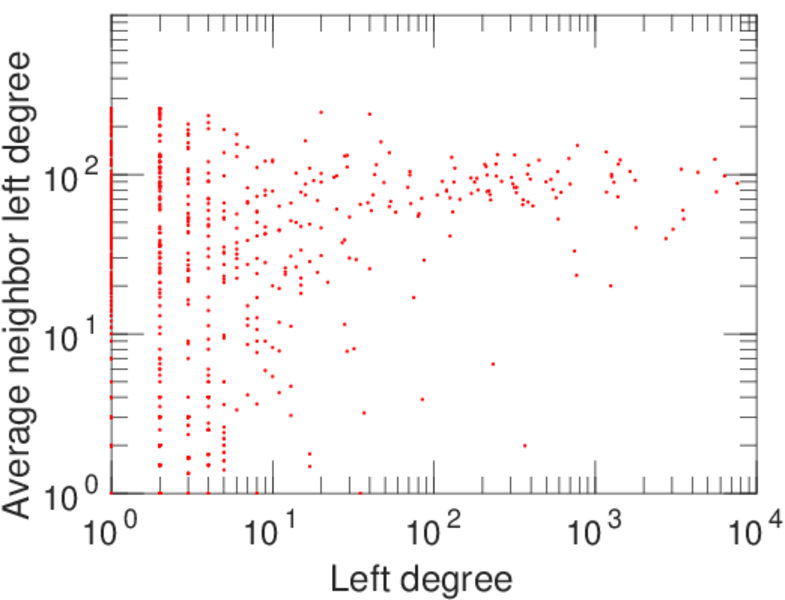
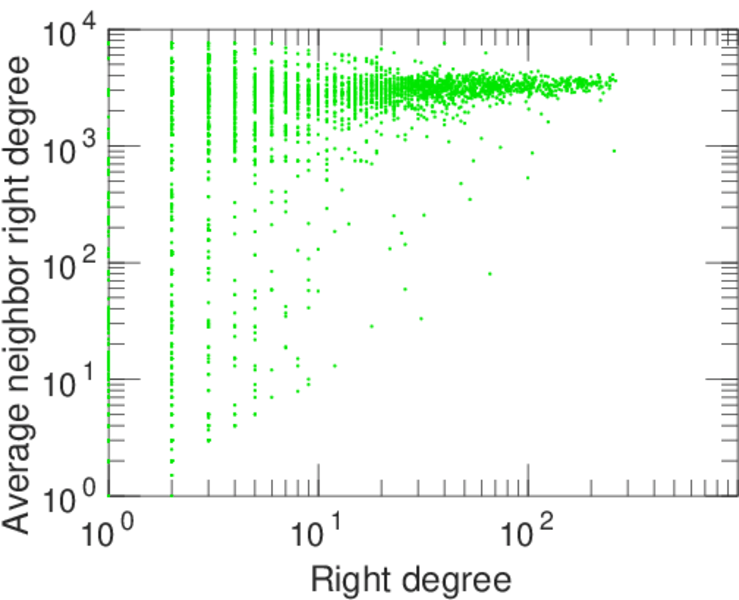
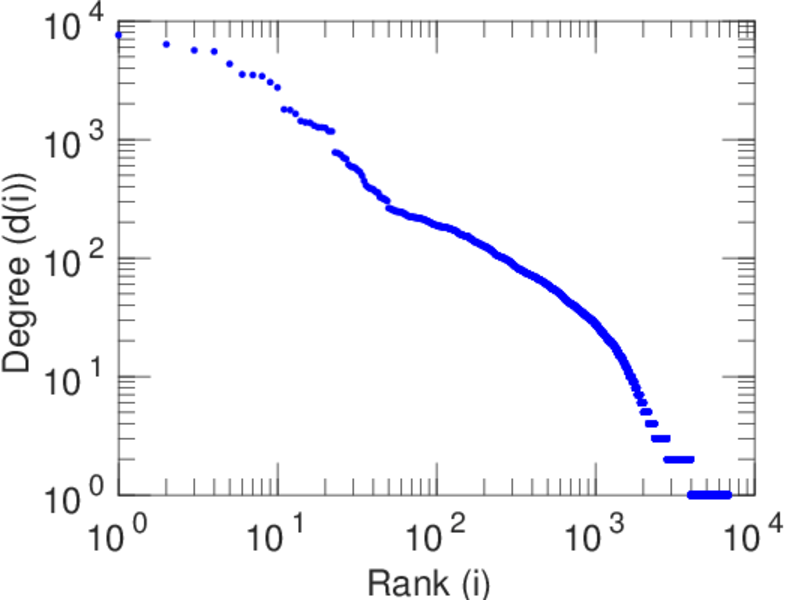
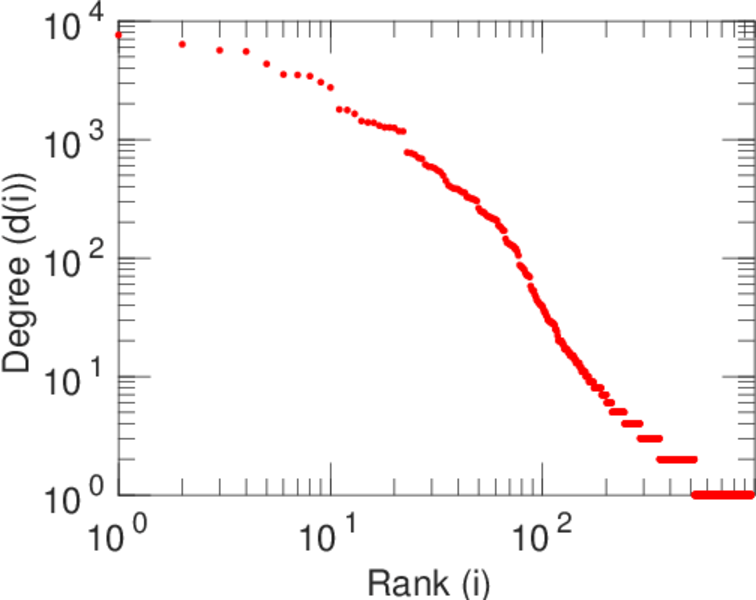
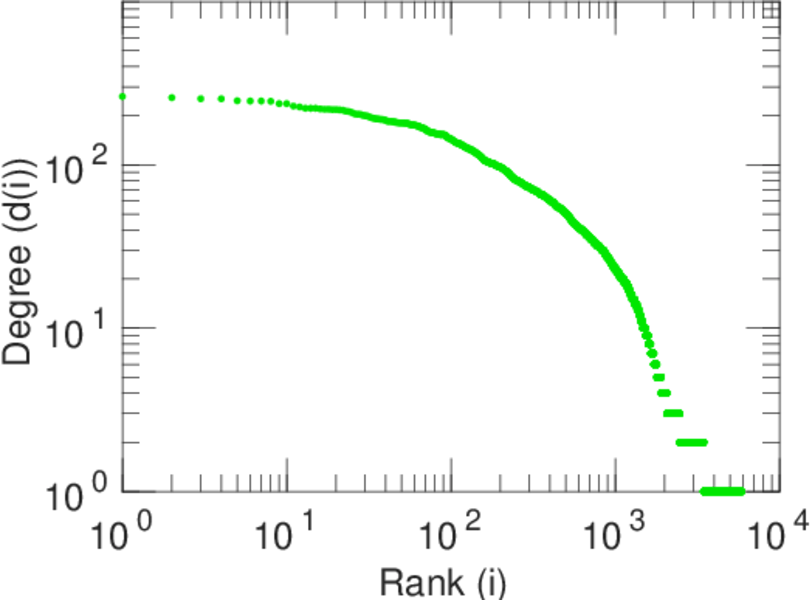
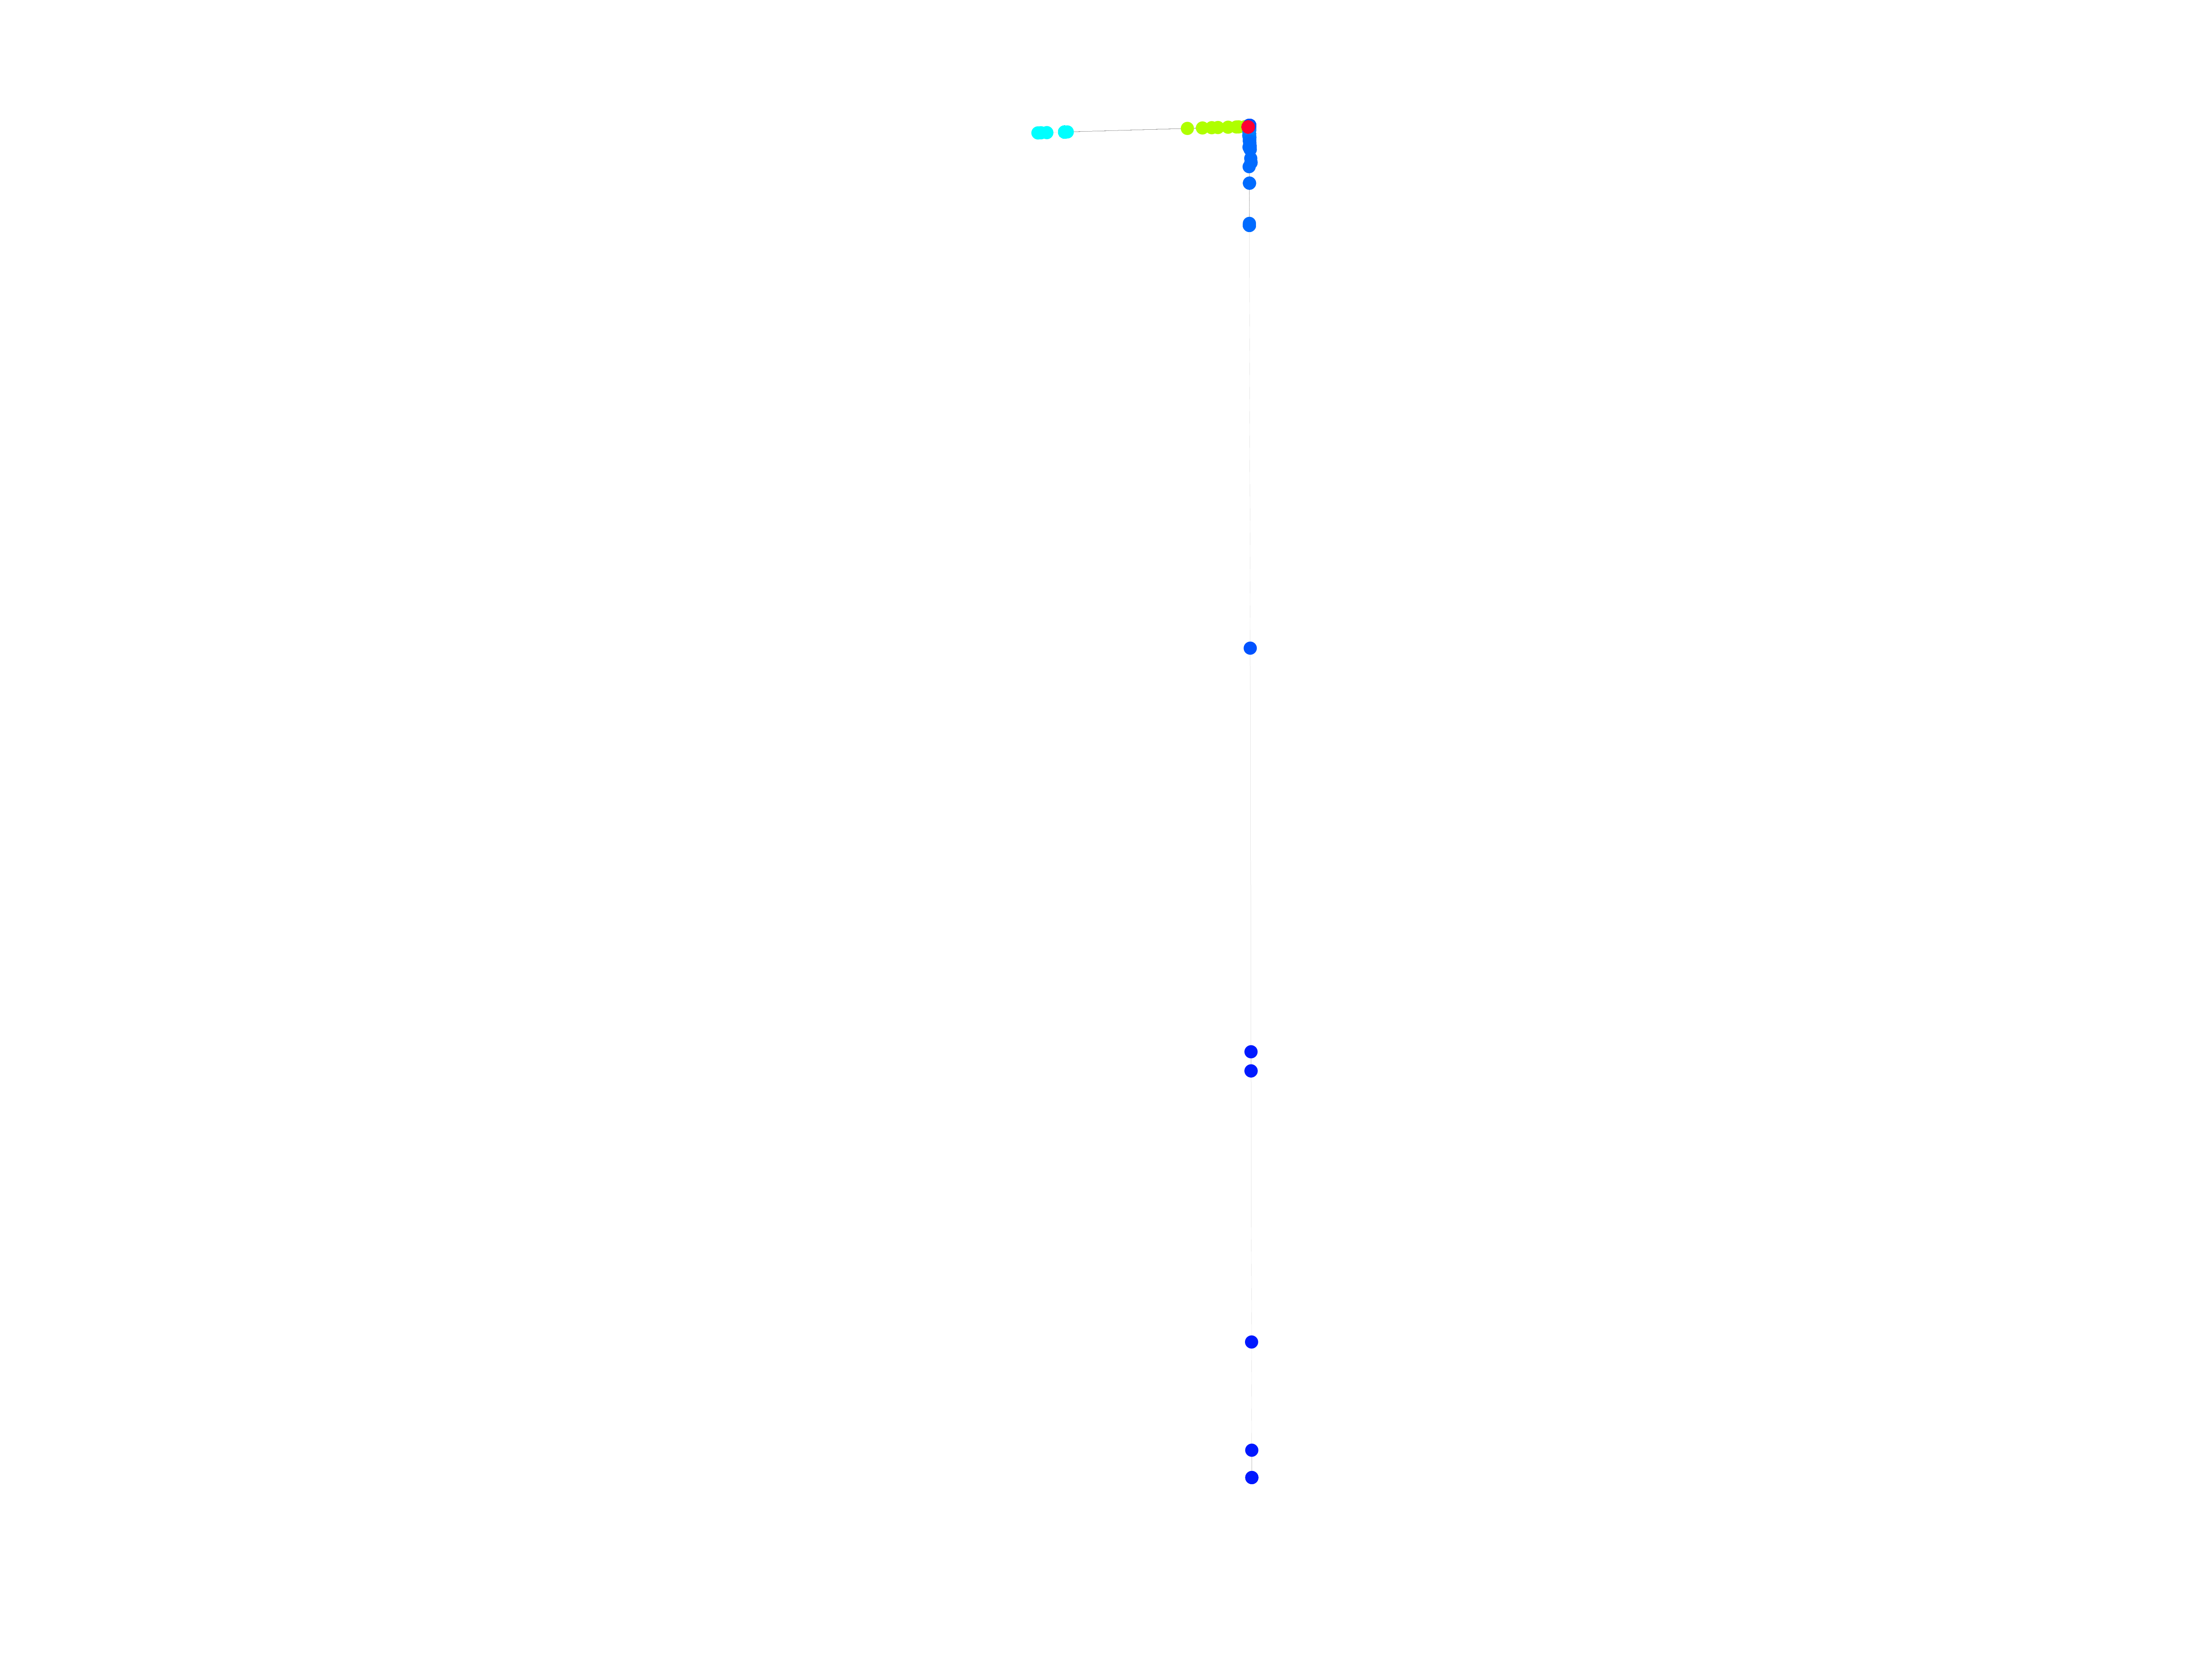
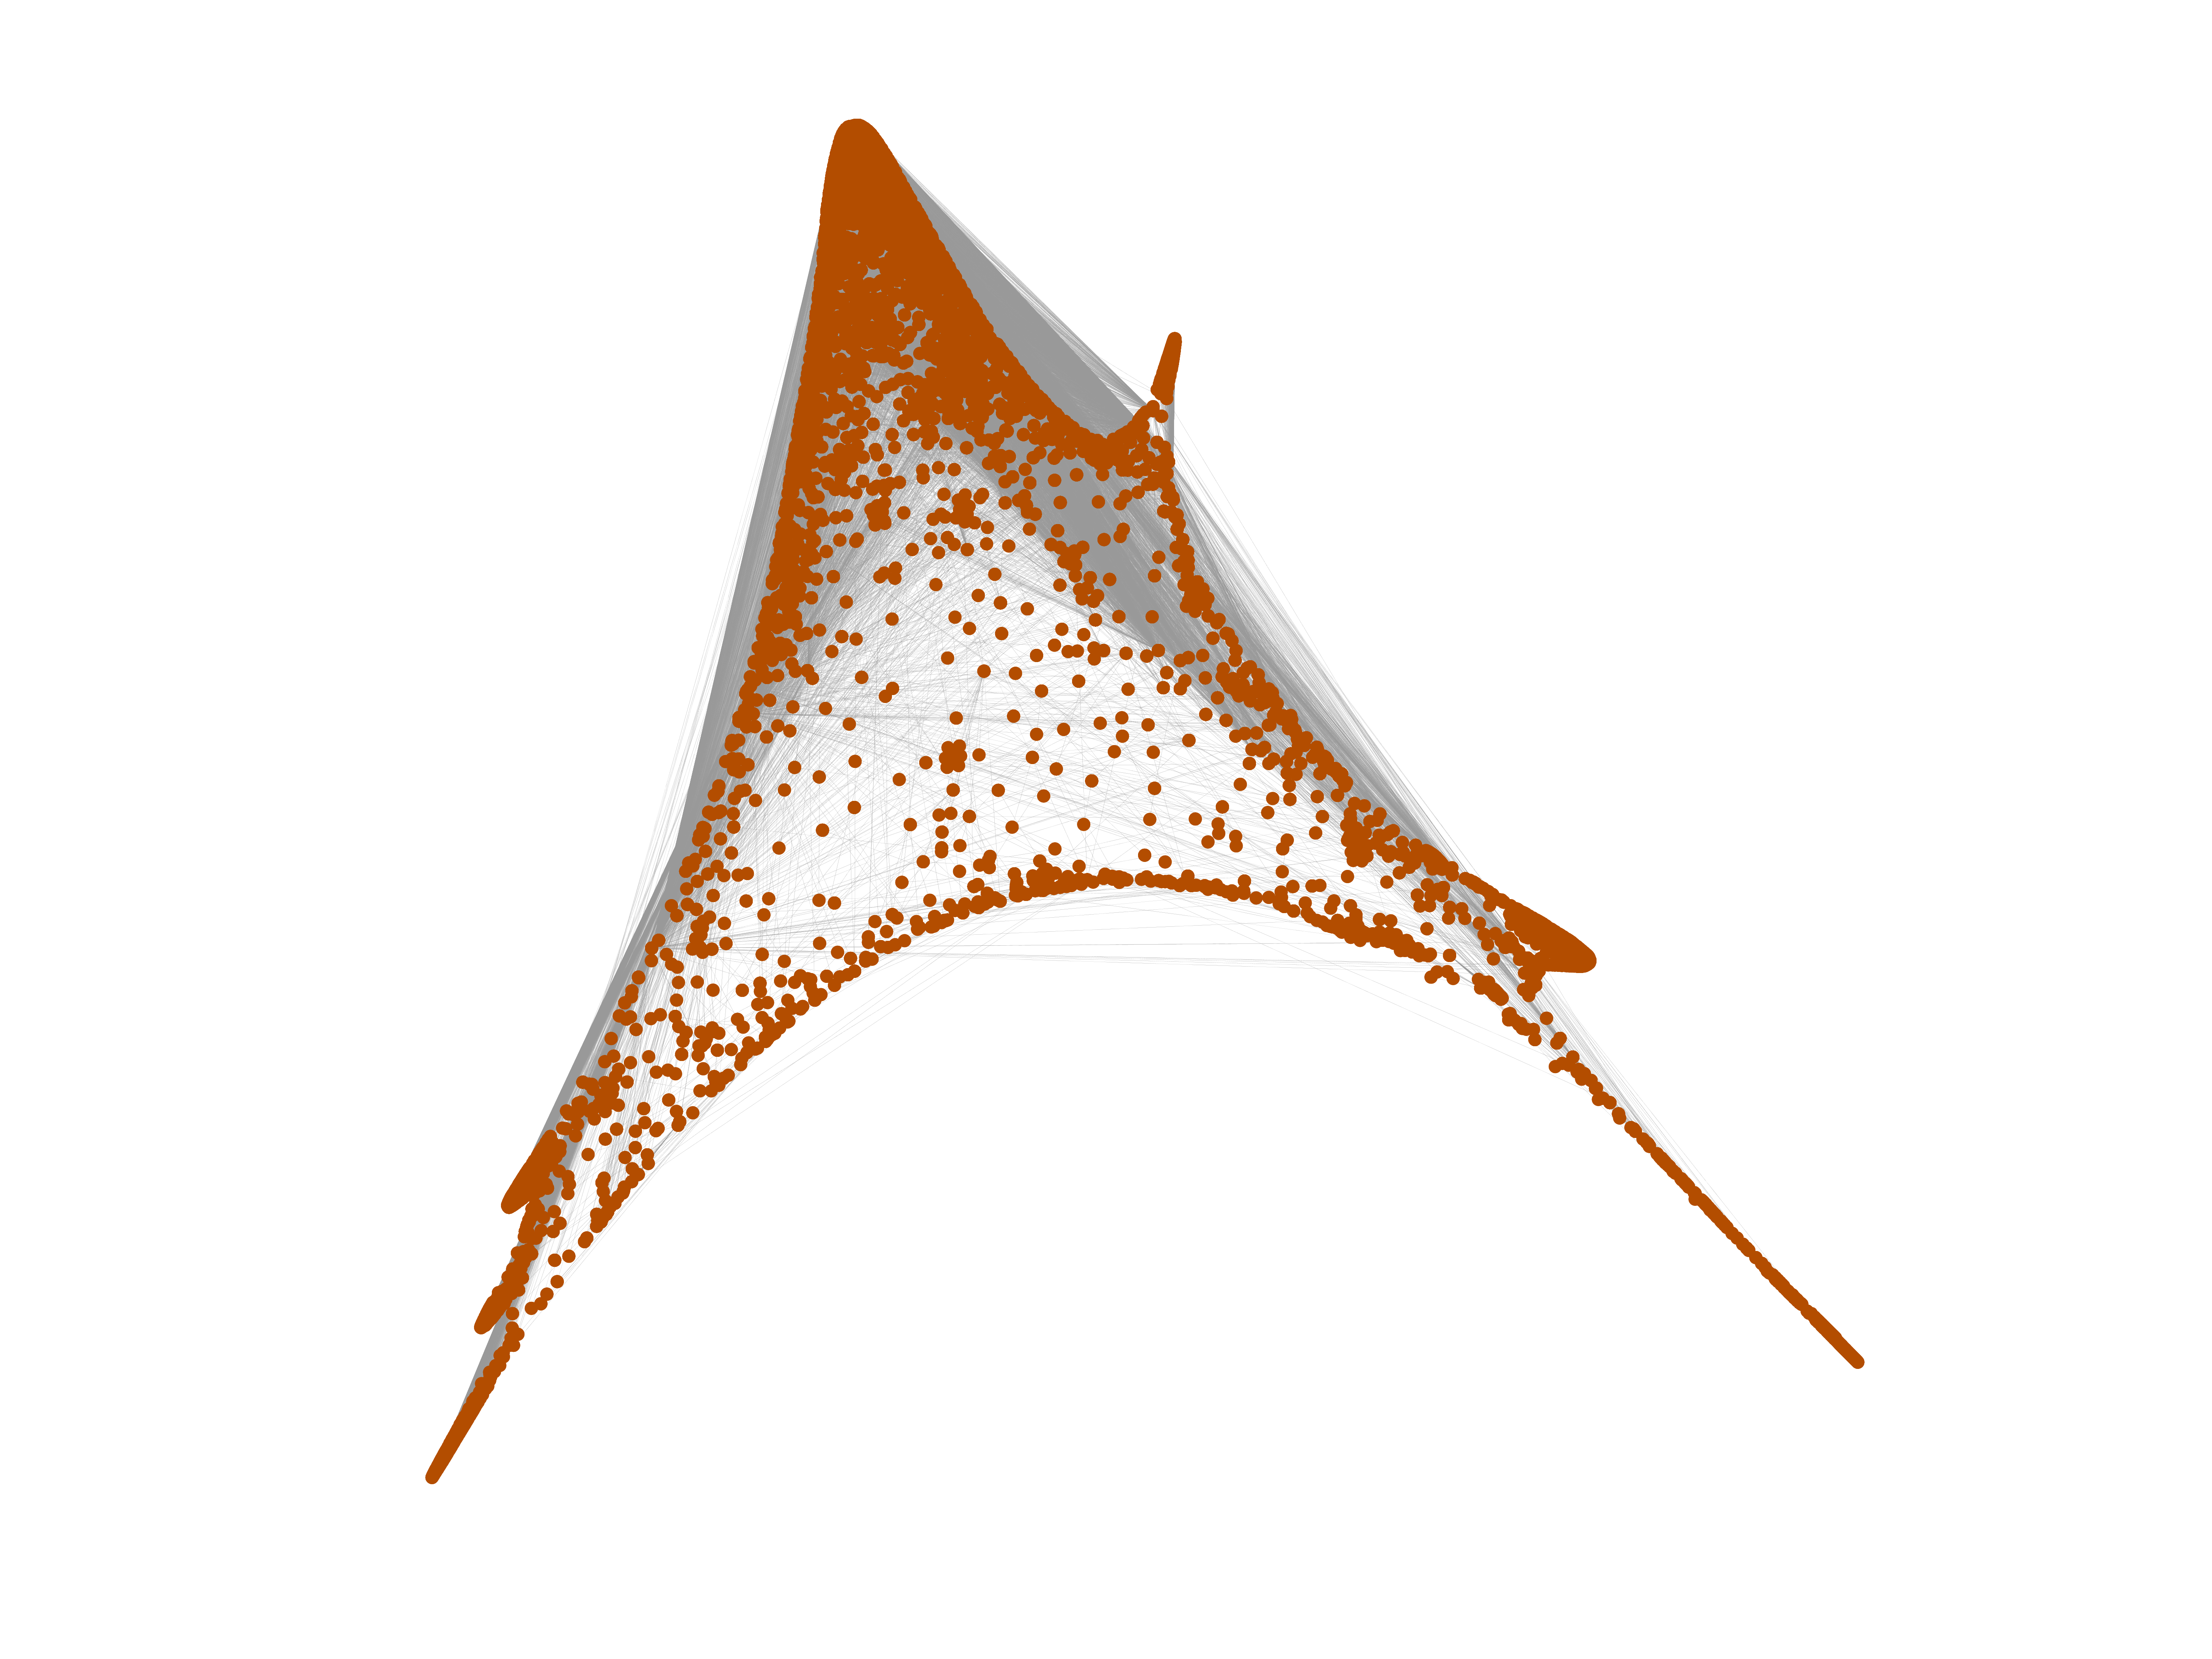
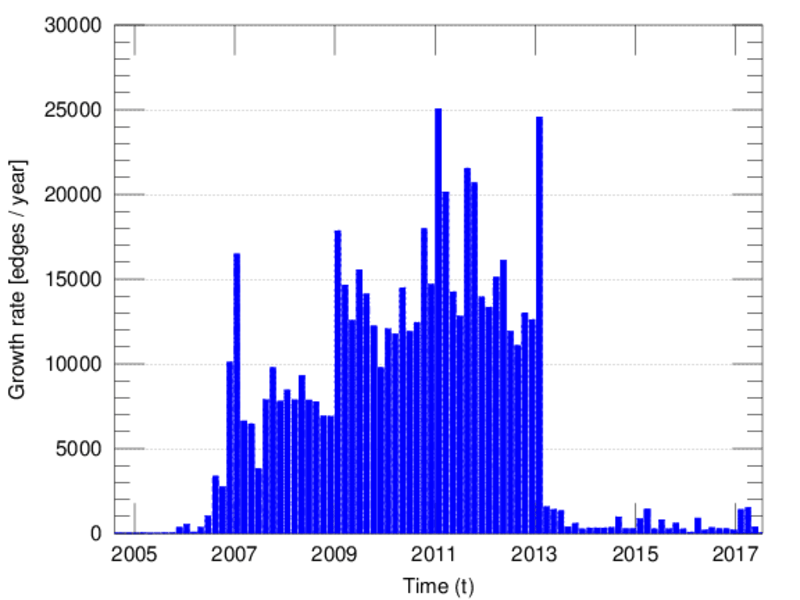
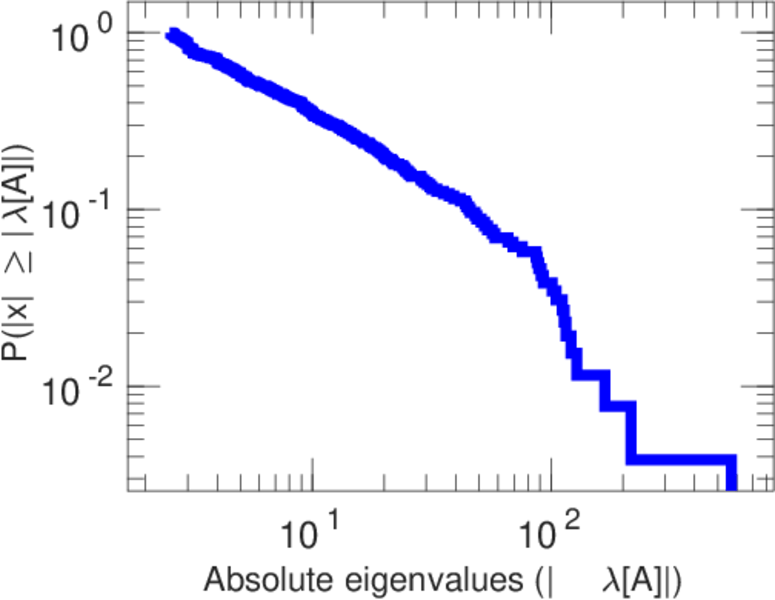
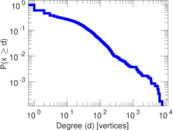
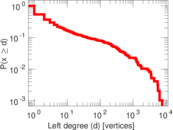
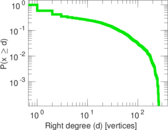
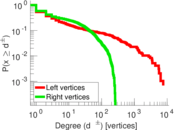
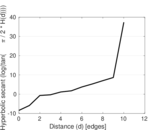
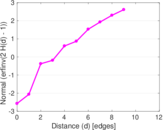
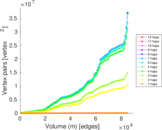
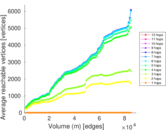
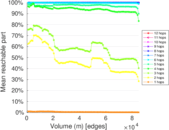
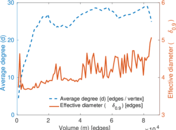
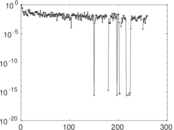
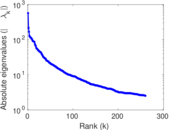
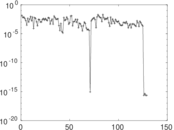
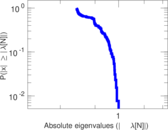
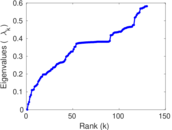
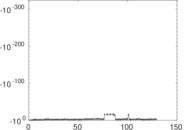
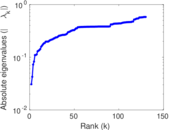
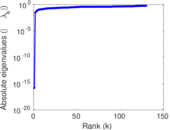
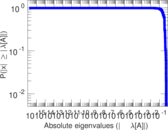
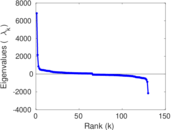
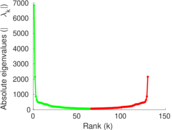
Plots


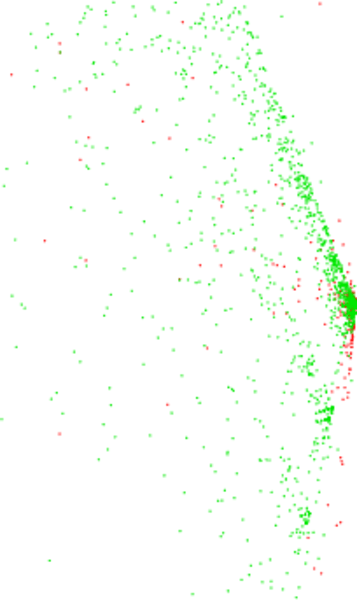
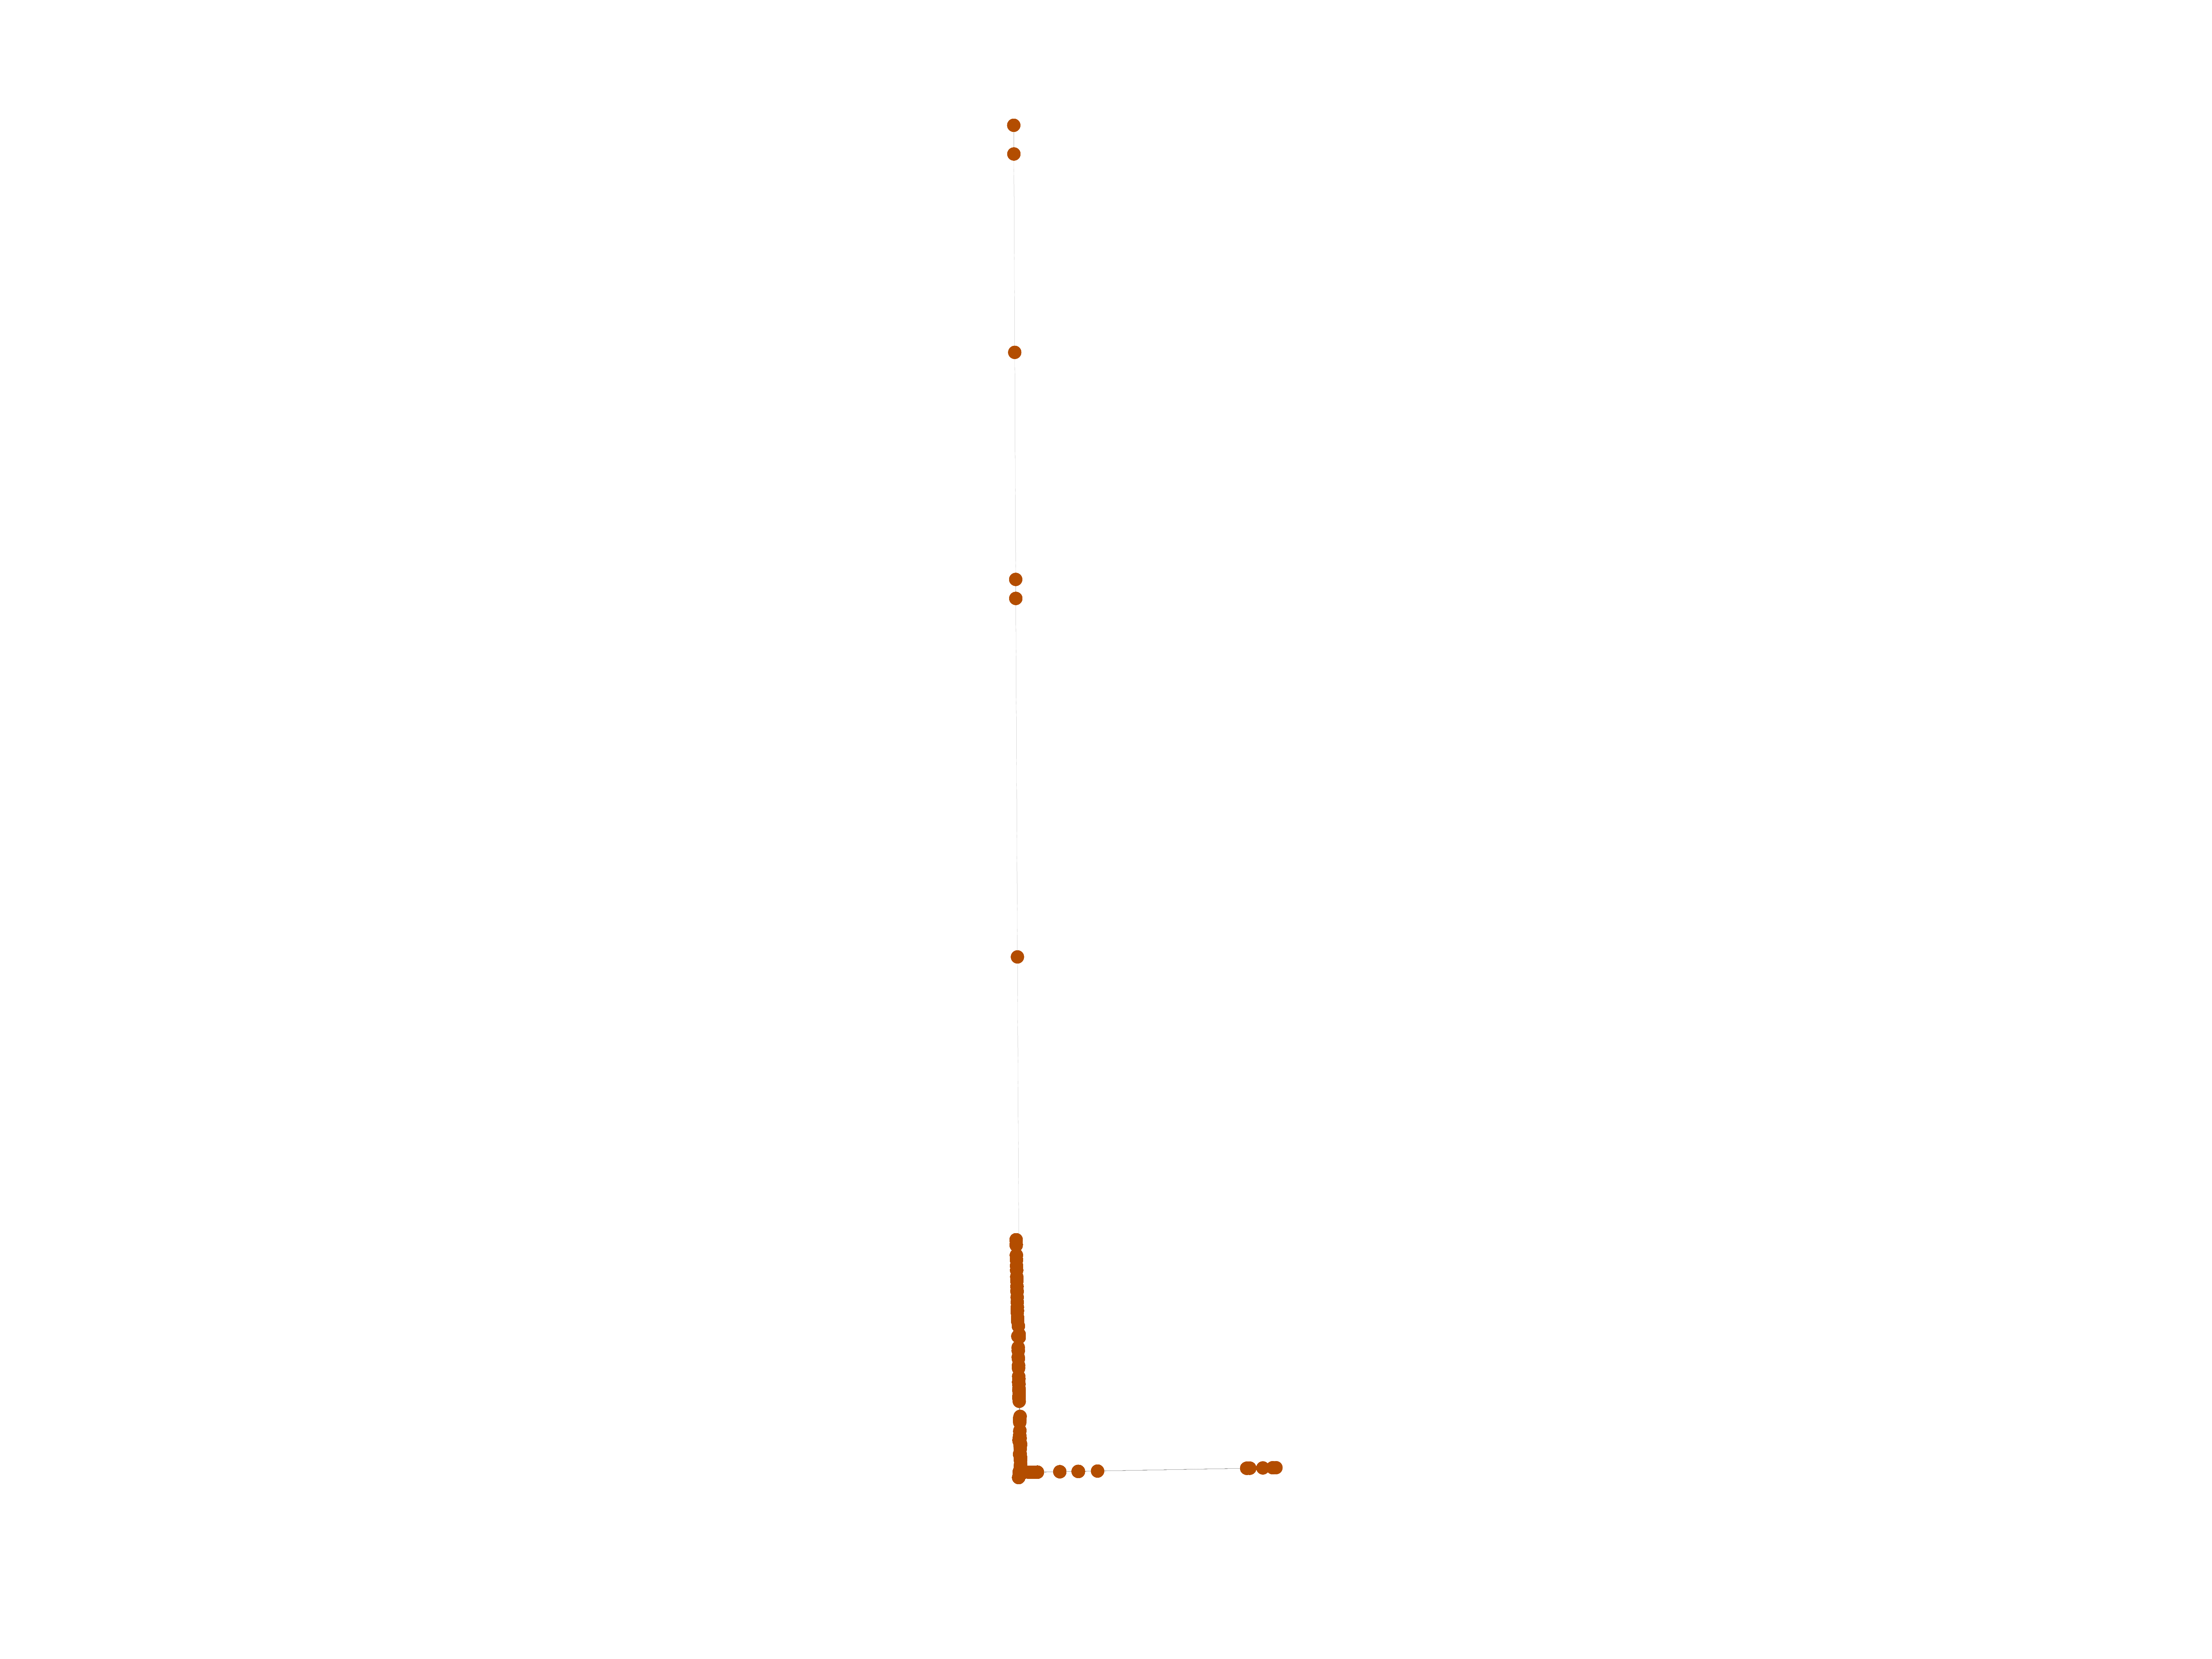
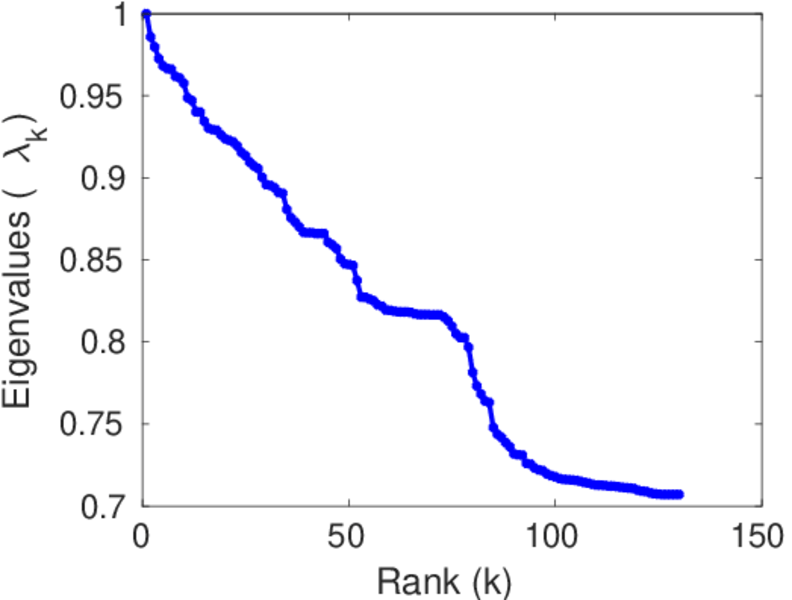
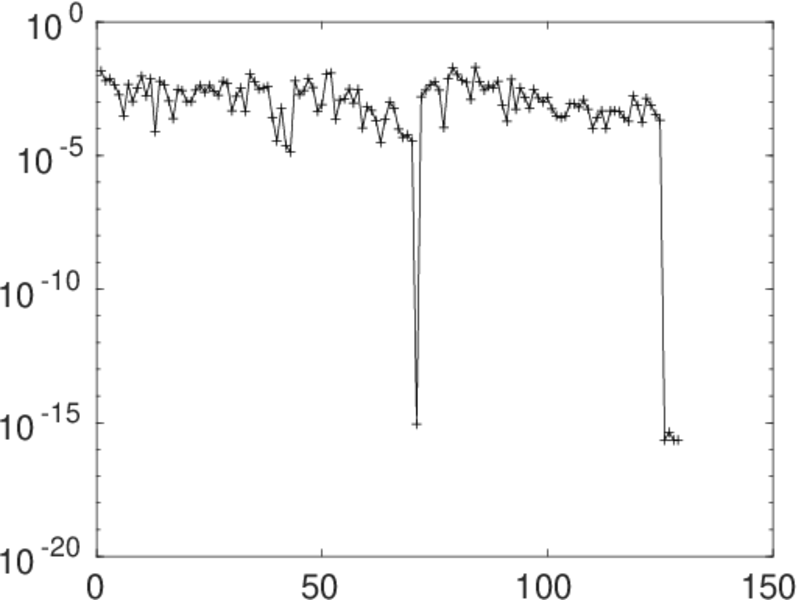
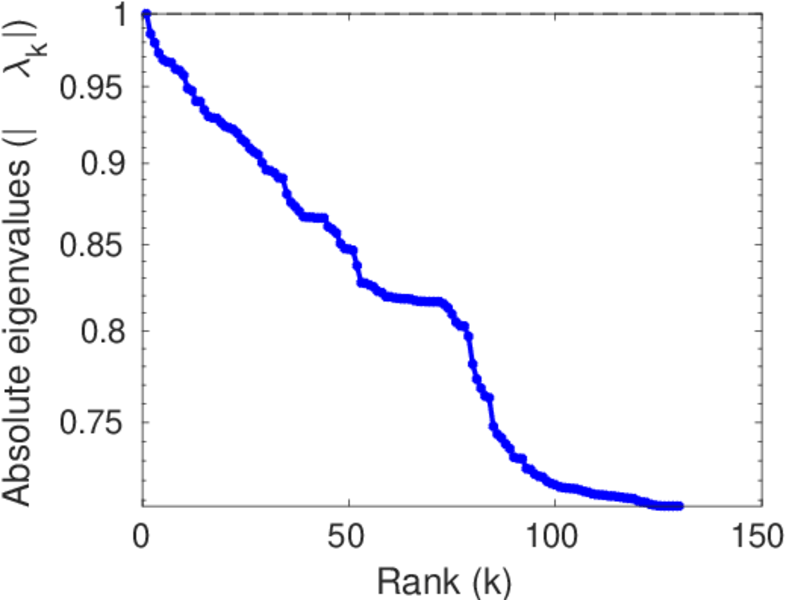
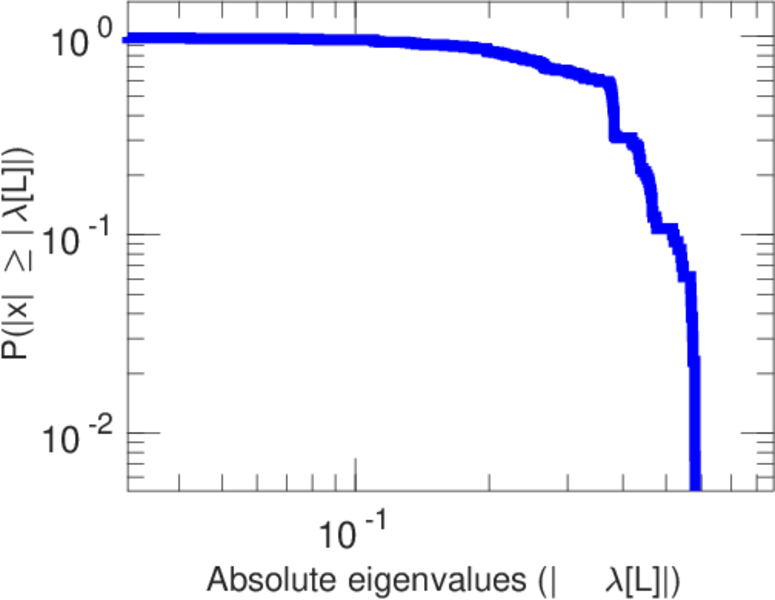
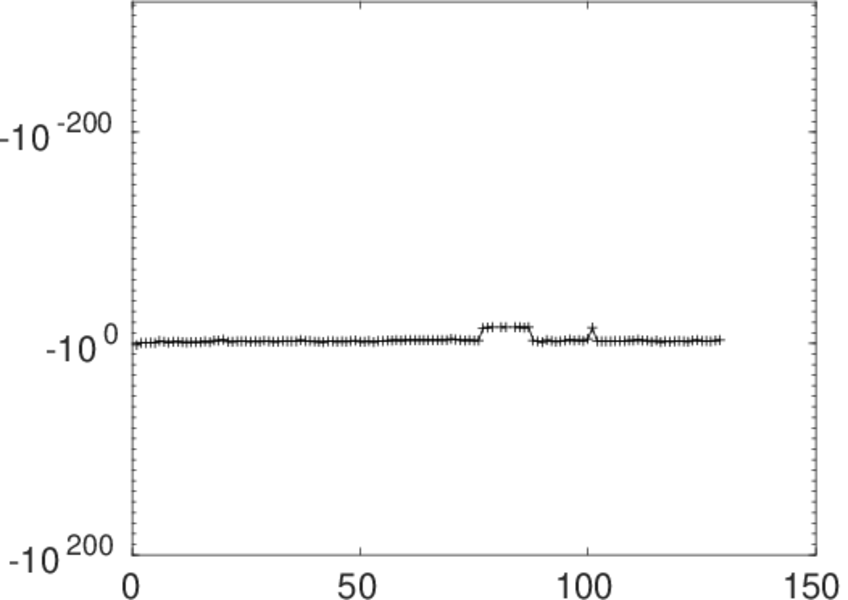
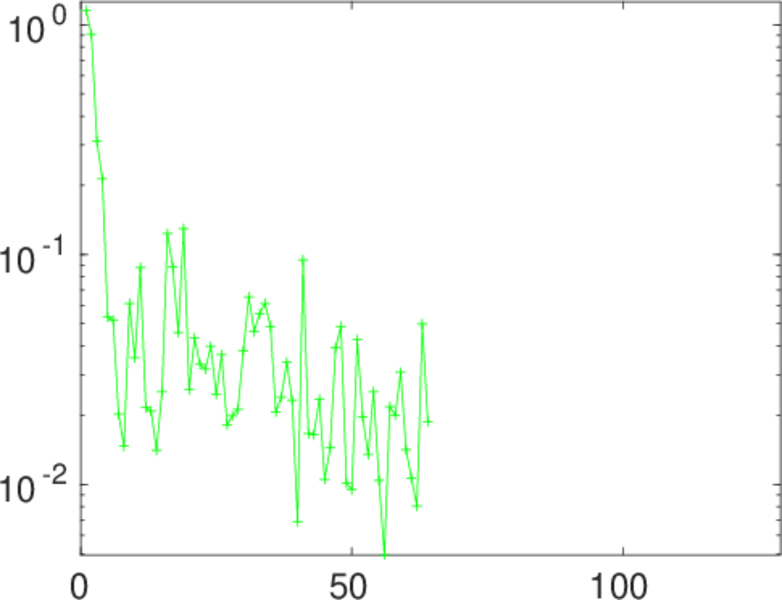
Matrix decompositions plots


Downloads
References
|
[1]
|
Jérôme Kunegis.
KONECT – The Koblenz Network Collection.
In Proc. Int. Conf. on World Wide Web Companion, pages
1343–1350, 2013.
[ http ]
|
|
[2]
|
Wikimedia Foundation.
Wikimedia downloads.
http://dumps.wikimedia.org/, January 2010.
|
 KONECT ‣ Networks ‣
Buy Me a Coffee
KONECT ‣ Networks ‣
Buy Me a Coffee