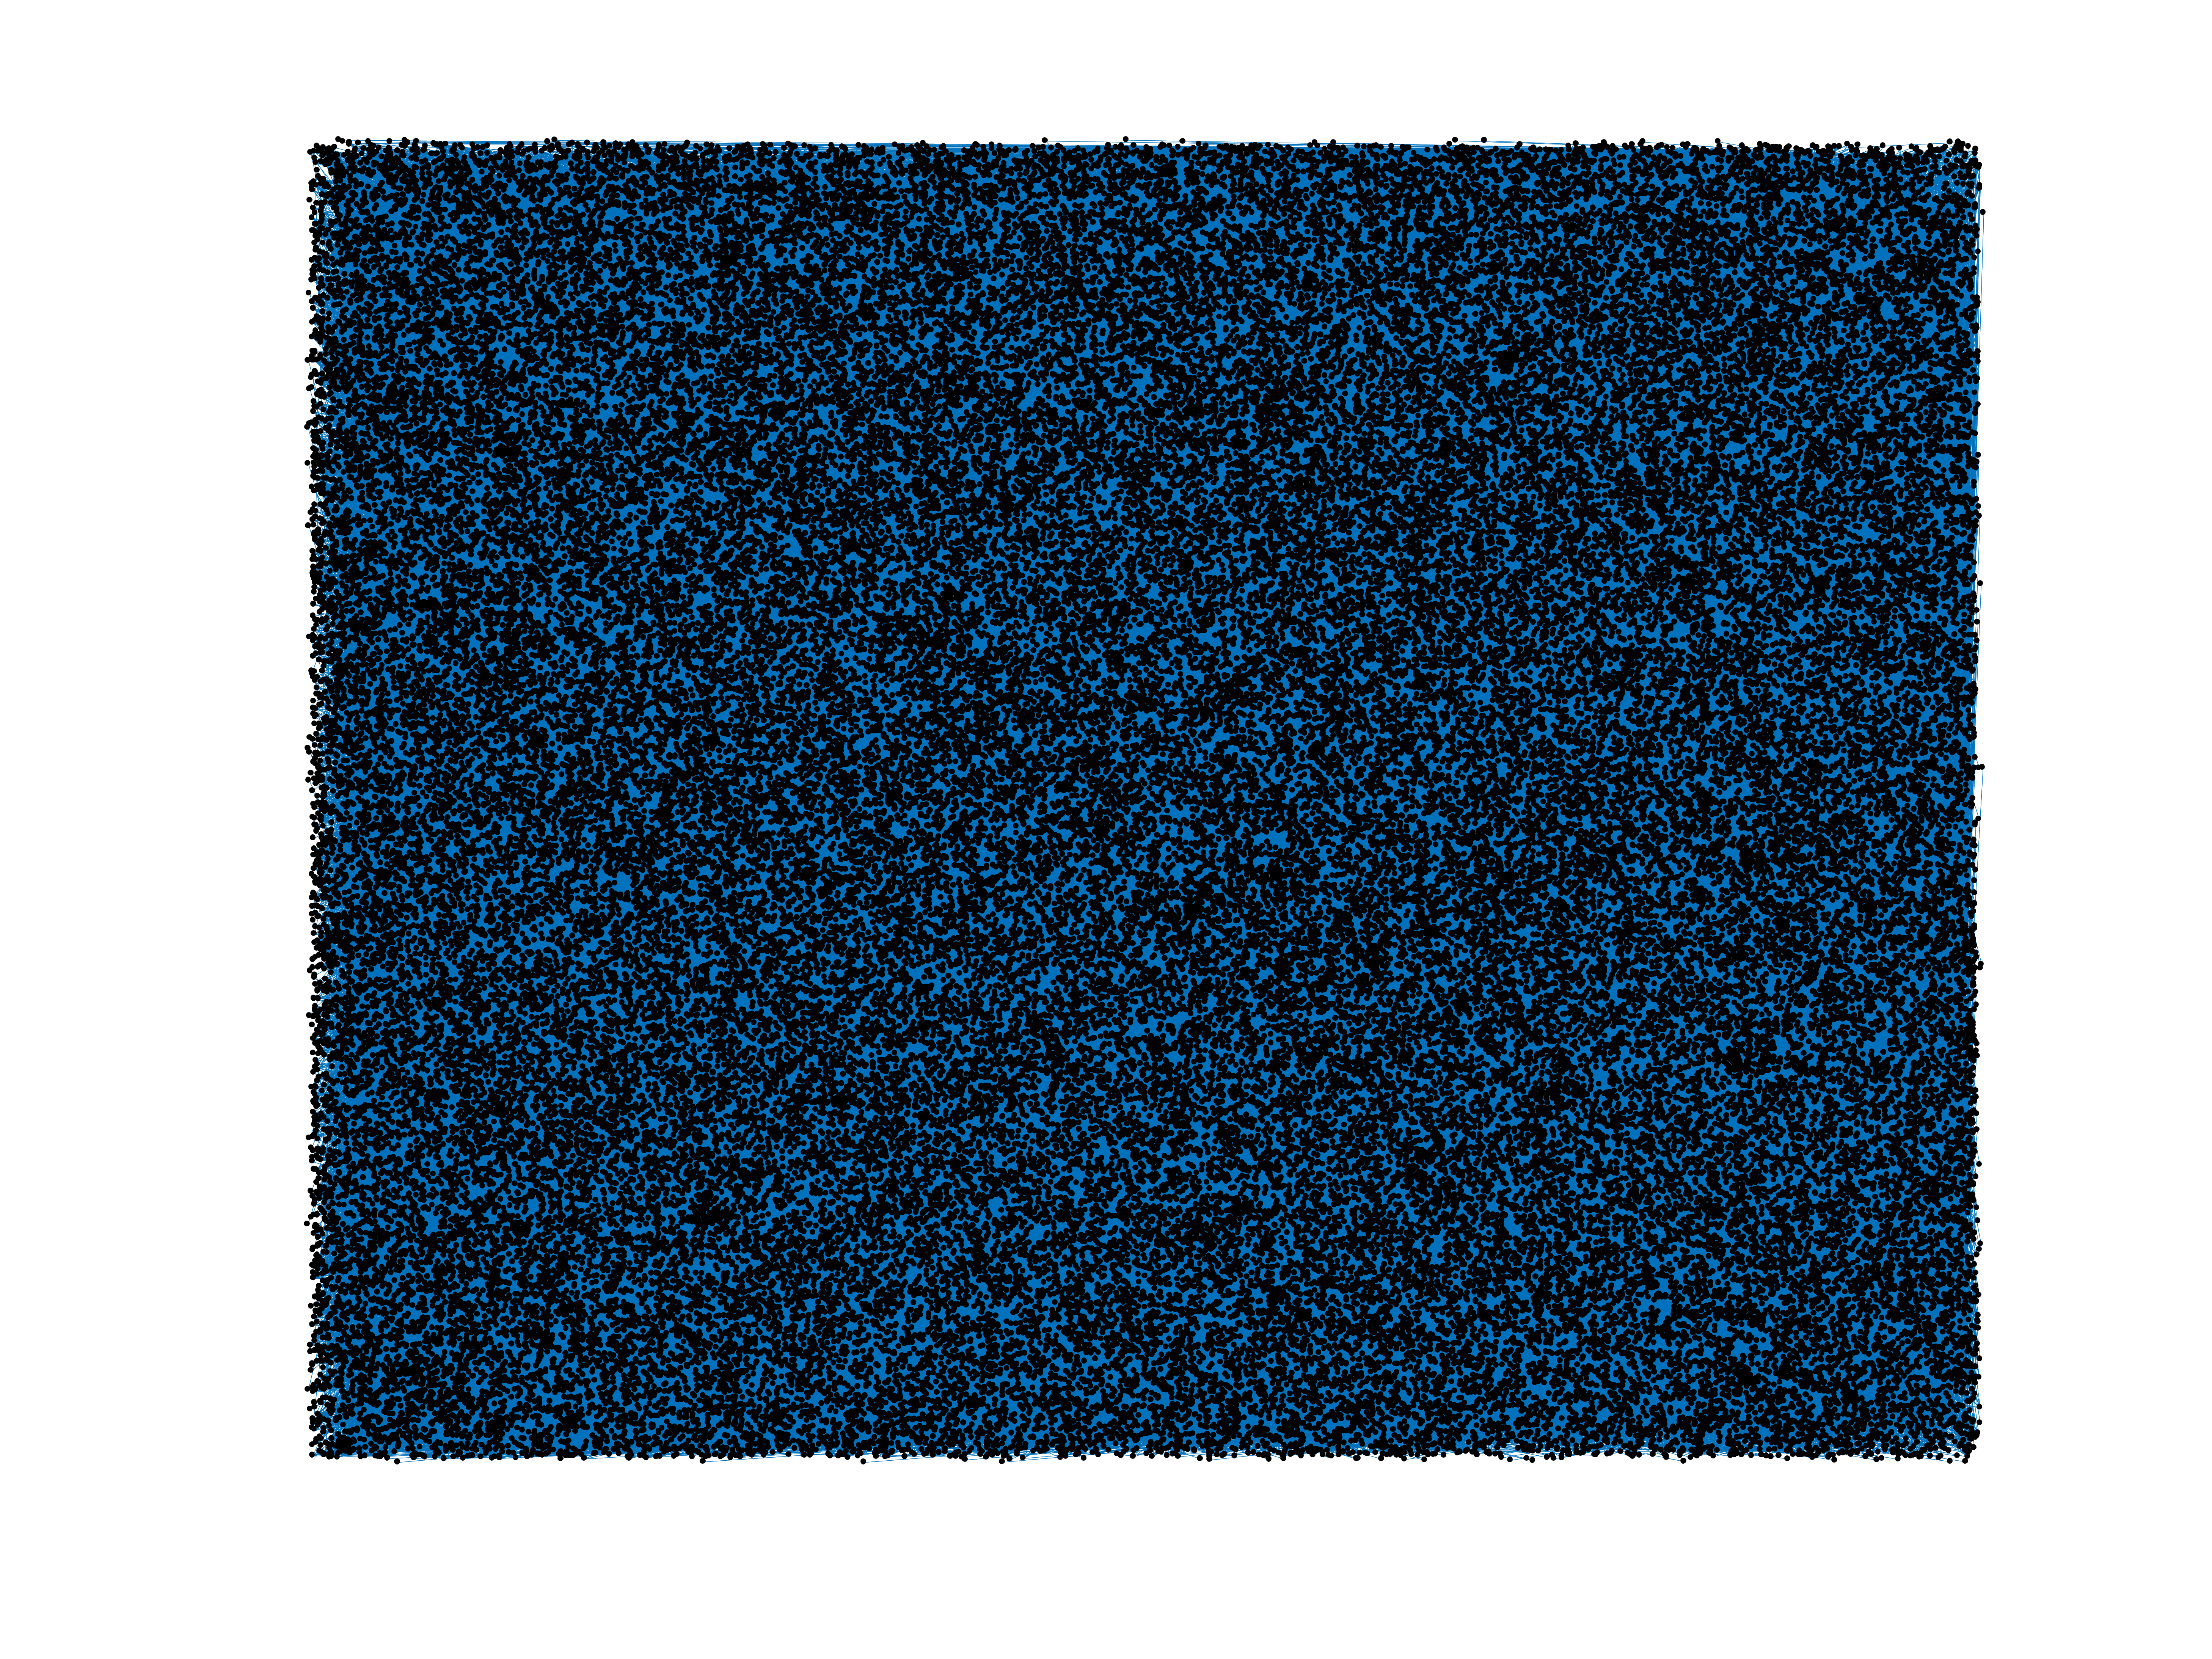
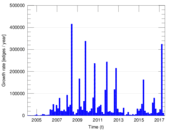
Wiktionary edits (ar)
This is the bipartite edit network of the Arabic Wiktionary. It contains users
and pages from the Arabic Wiktionary, connected by edit events. Each edge
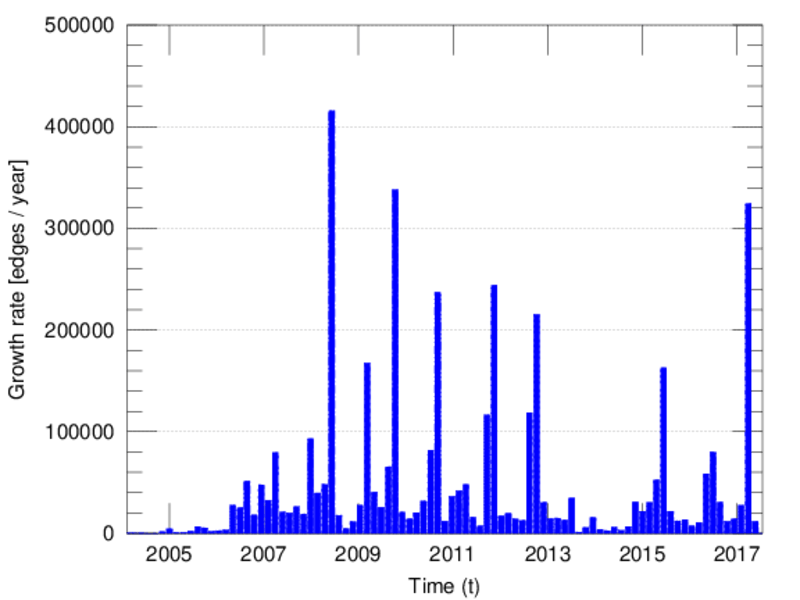
represents an edit. The dataset includes the timestamp of each edit.
Metadata
Statistics
| Size | n = | 97,909
|
| Left size | n1 = | 1,538
|
| Right size | n2 = | 96,371
|
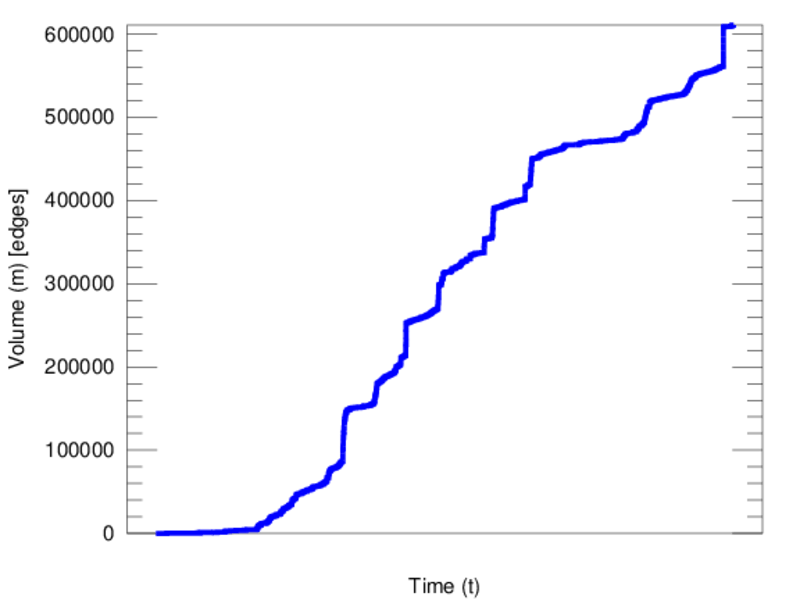
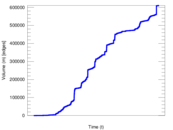
| Volume | m = | 610,765
|
| Unique edge count | m̿ = | 402,431
|
| Wedge count | s = | 5,800,808,551
|
| Claw count | z = | 80,478,623,577,044
|
| Cross count | x = | 930,777,501,422,021,248
|
| Square count | q = | 9,063,618,173
|
| 4-Tour count | T4 = | 95,713,504,934
|
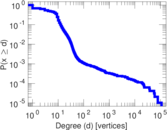
| Maximum degree | dmax = | 109,759
|
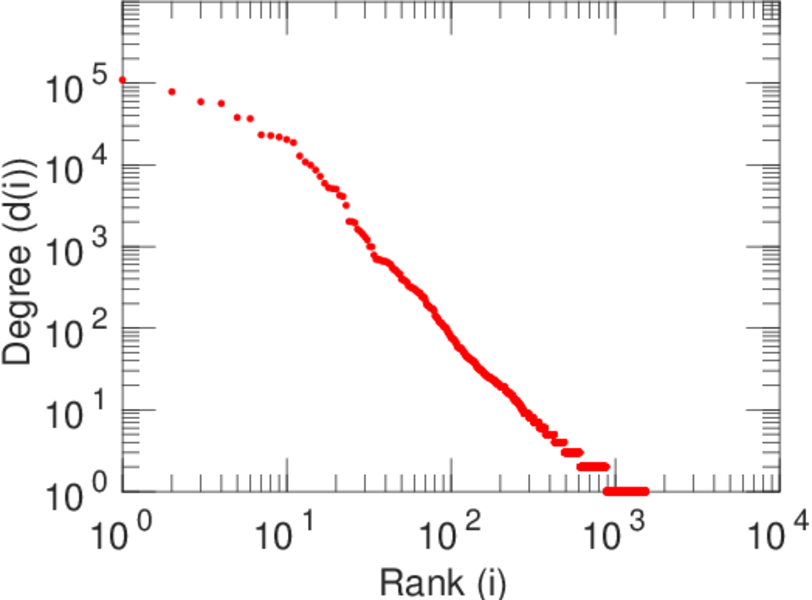
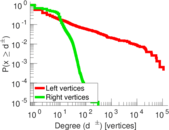
| Maximum left degree | d1max = | 109,759
|
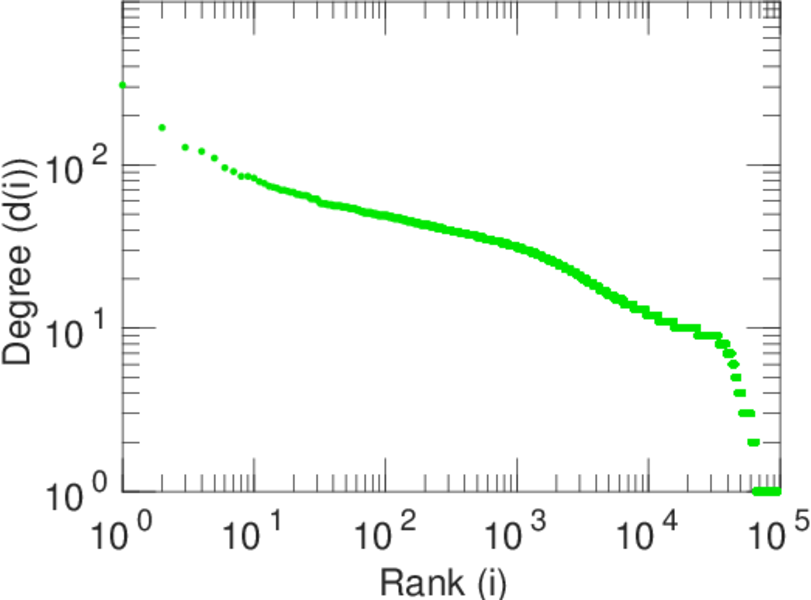
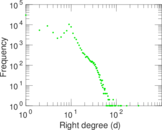
| Maximum right degree | d2max = | 308
|
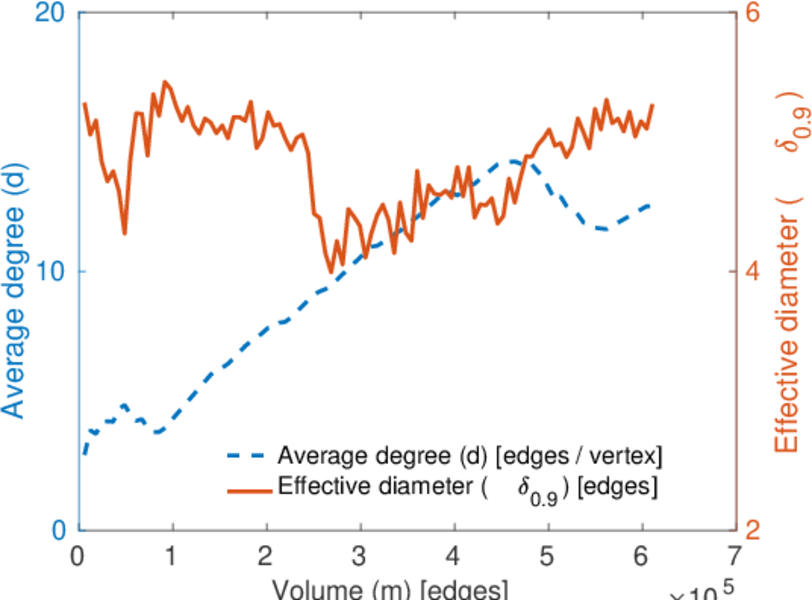
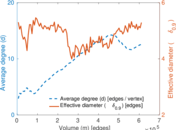
| Average degree | d = | 12.476 2
|
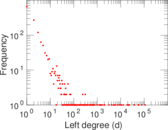
| Average left degree | d1 = | 397.116
|
| Average right degree | d2 = | 6.337 64
|
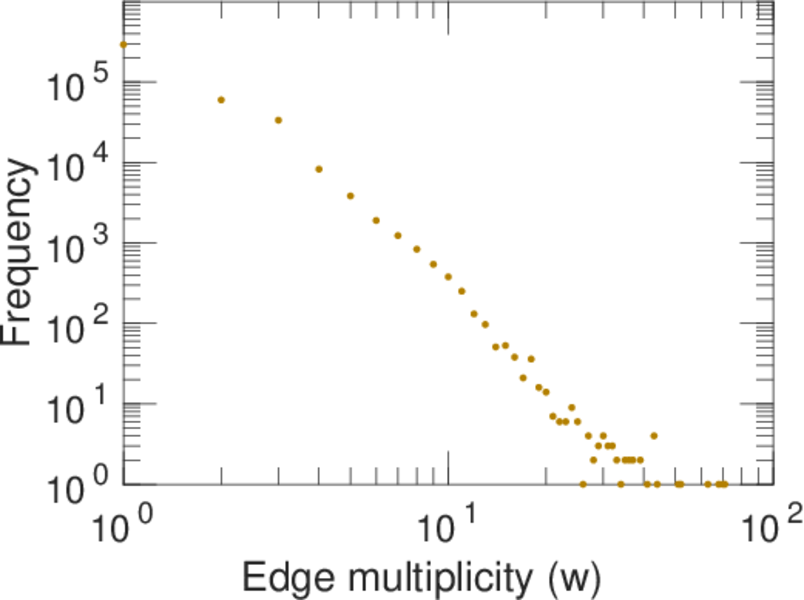
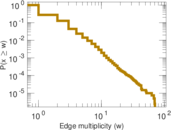
| Average edge multiplicity | m̃ = | 1.517 69
|
| Size of LCC | N = | 96,970
|
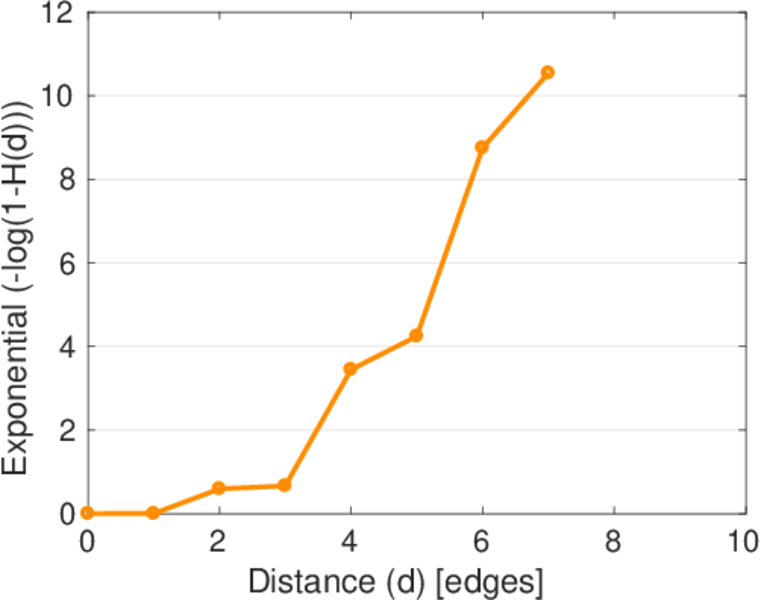
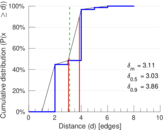
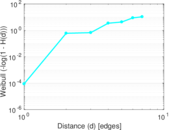
| Diameter | δ = | 10
|
| 50-Percentile effective diameter | δ0.5 = | 3.031 22
|
| 90-Percentile effective diameter | δ0.9 = | 3.859 04
|
| Median distance | δM = | 4
|
| Mean distance | δm = | 3.114 07
|
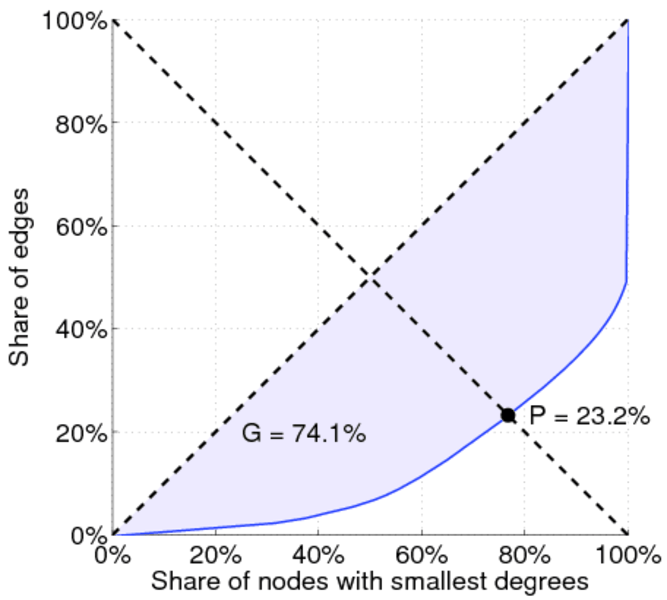
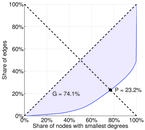
| Gini coefficient | G = | 0.741 628
|
| Balanced inequality ratio | P = | 0.232 084
|
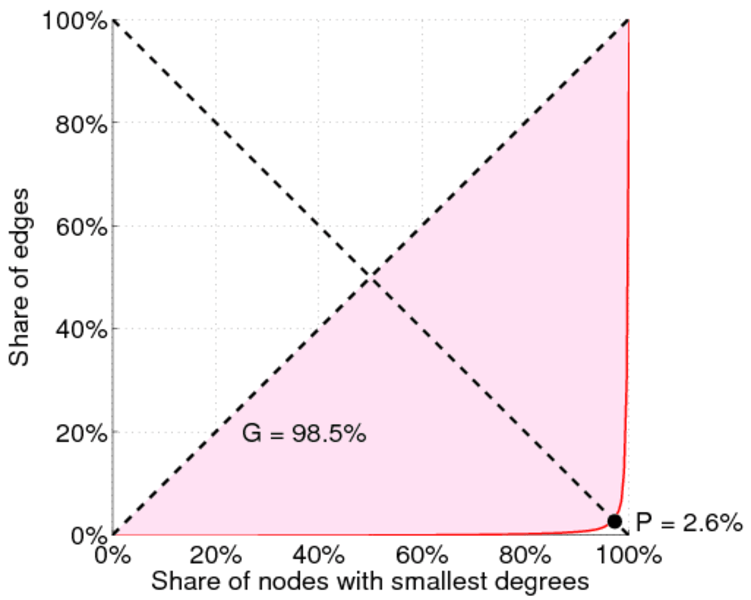
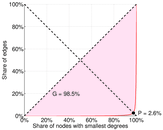
| Left balanced inequality ratio | P1 = | 0.026 032 9
|
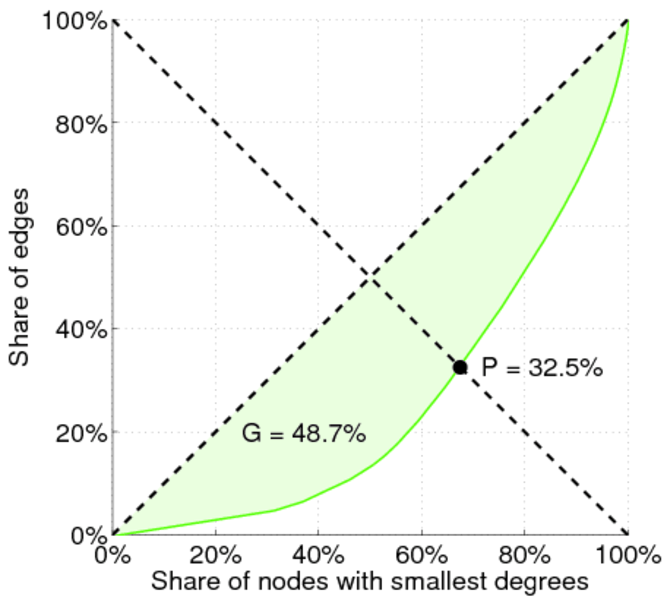
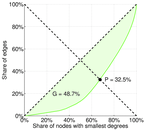
| Right balanced inequality ratio | P2 = | 0.325 227
|
| Relative edge distribution entropy | Her = | 0.685 157
|
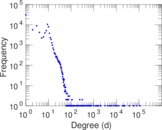
| Power law exponent | γ = | 1.945 64
|
| Tail power law exponent | γt = | 1.441 00
|
| Degree assortativity | ρ = | −0.029 151 8
|
| Degree assortativity p-value | pρ = | 2.181 42 × 10−76
|
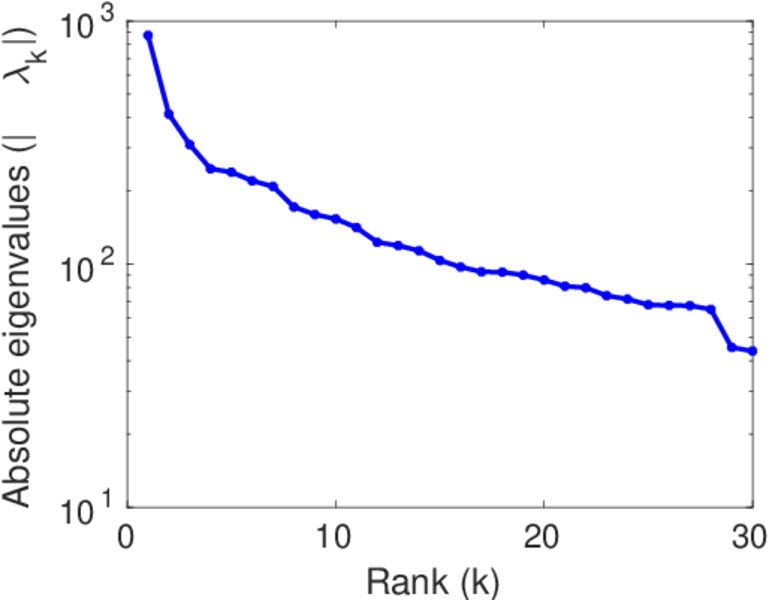
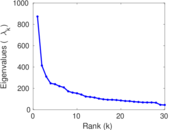
| Spectral norm | α = | 872.932
|
| Algebraic connectivity | a = | 0.030 663 6
|
| Controllability | C = | 94,669
|
| Relative controllability | Cr = | 0.970 019
|
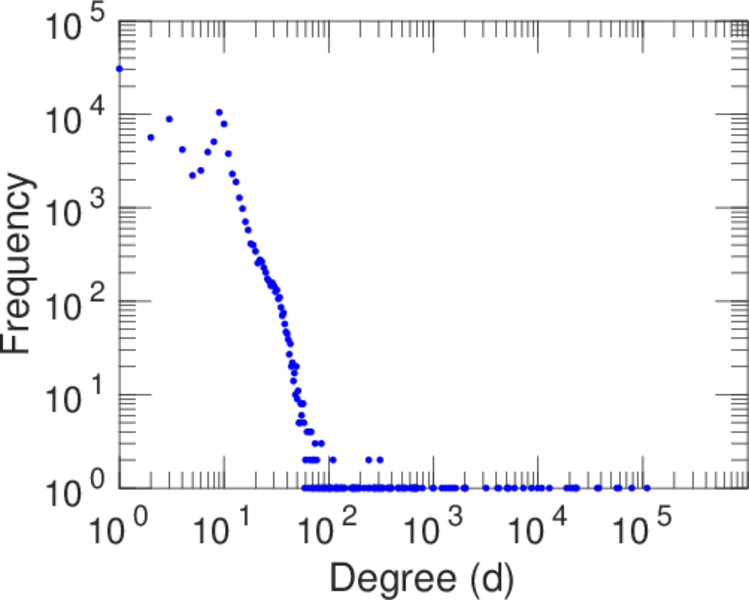
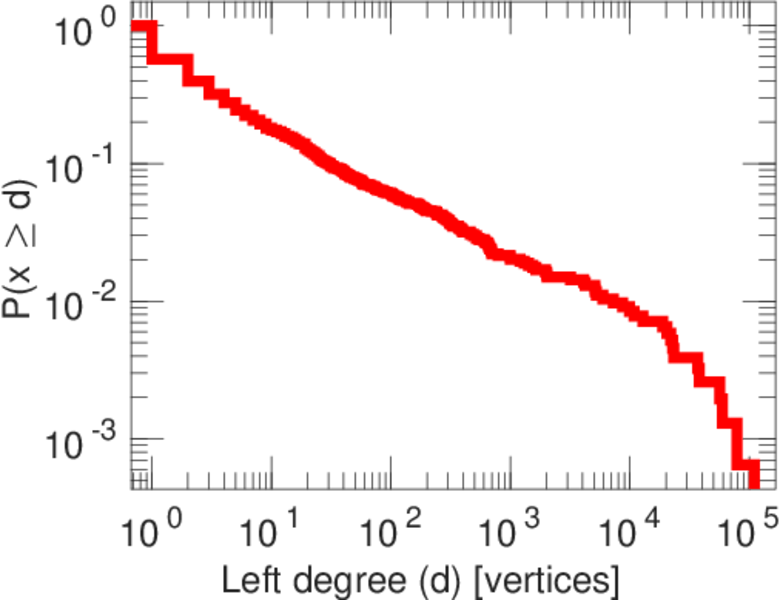
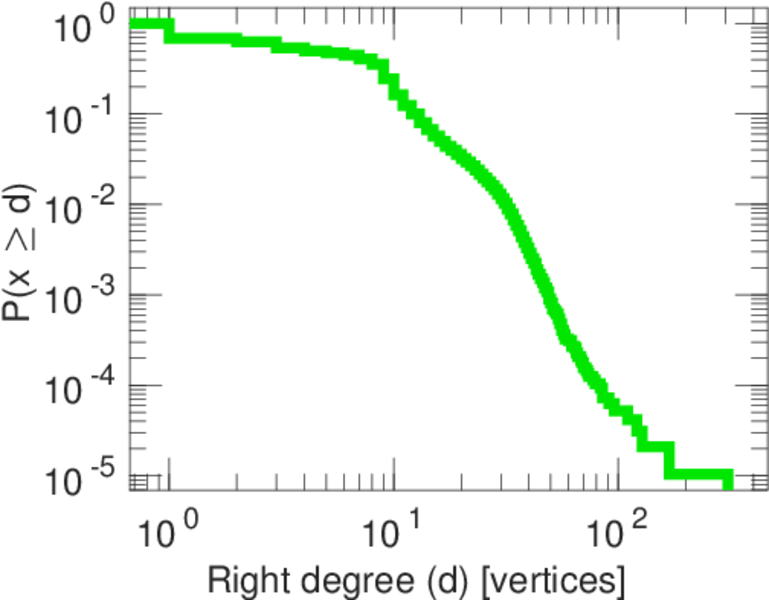
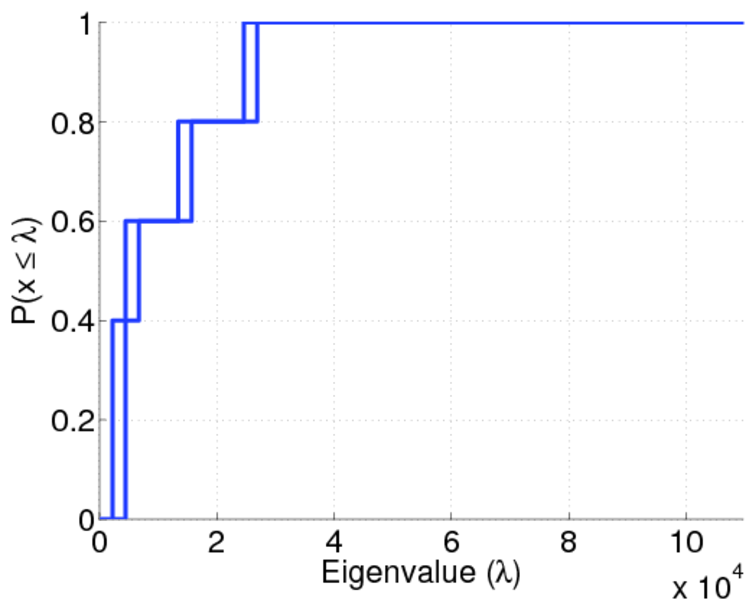
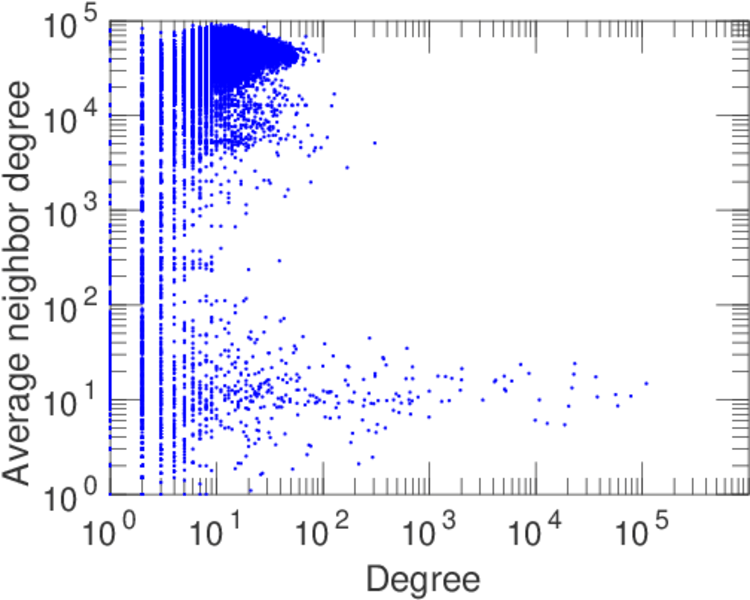
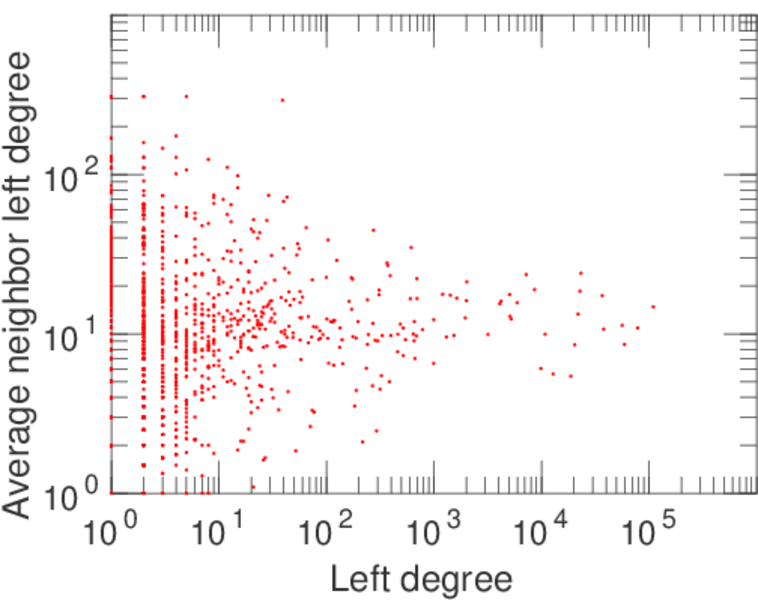
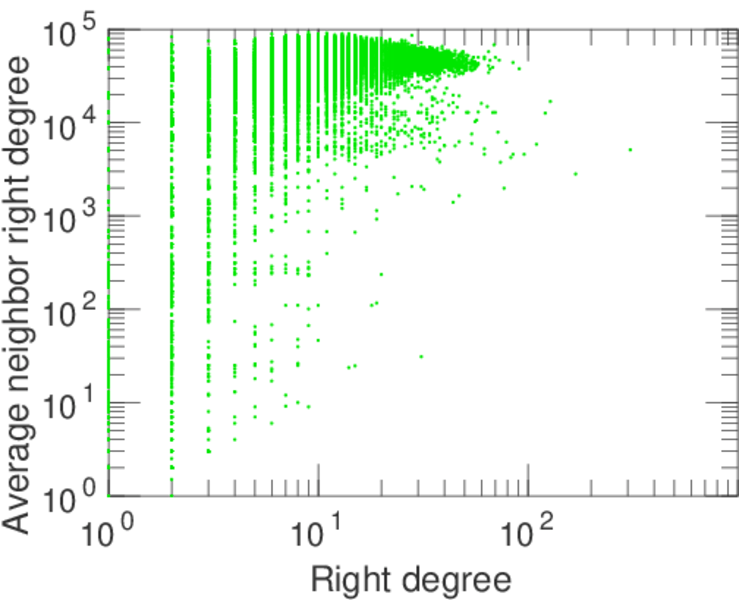
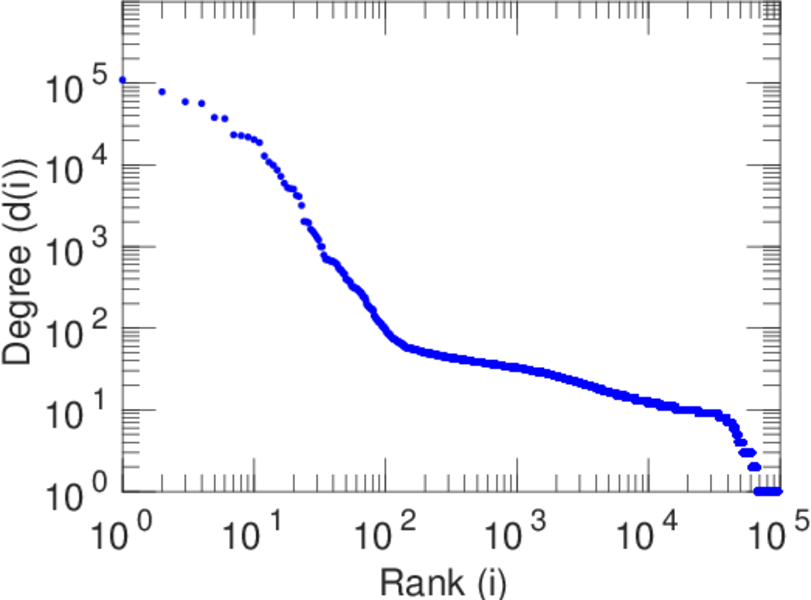
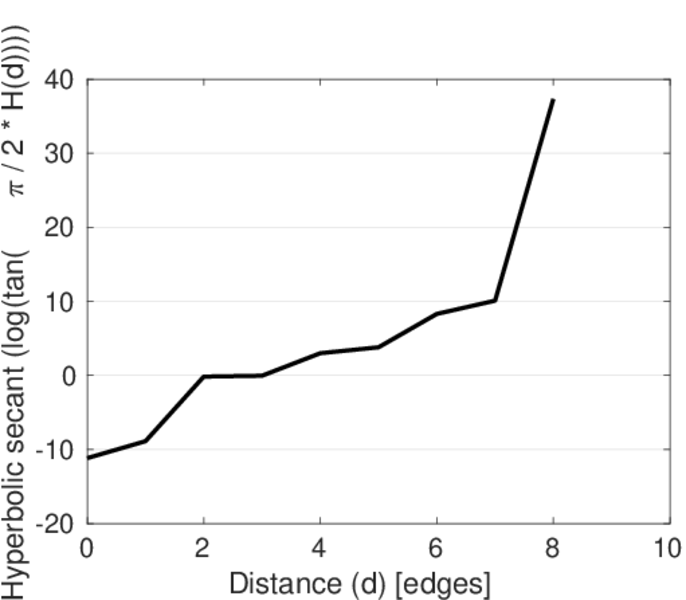
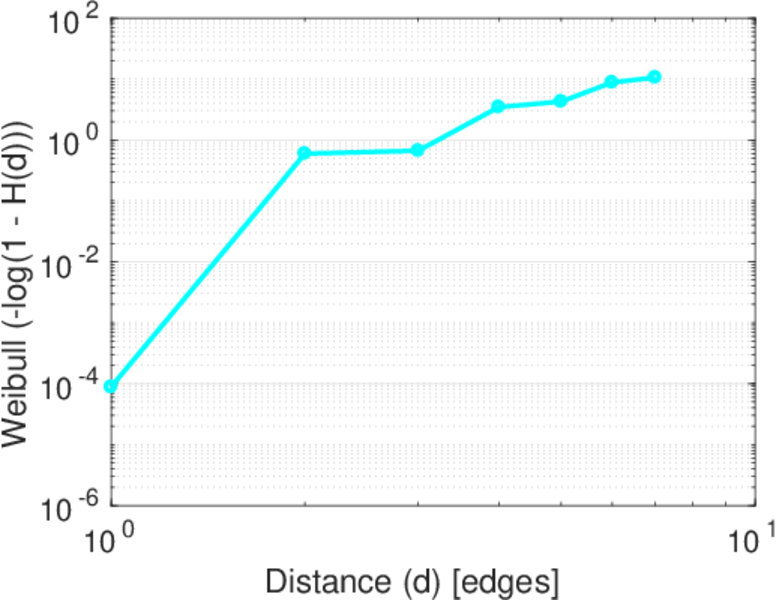
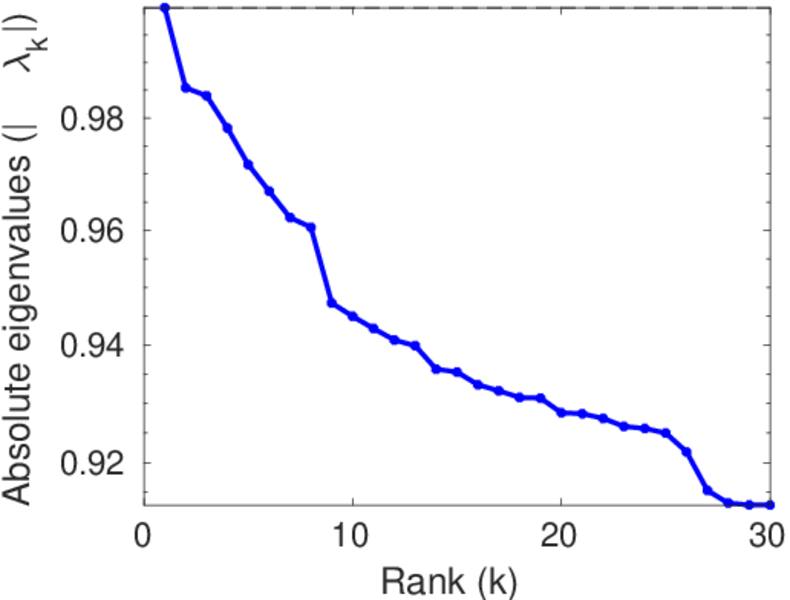
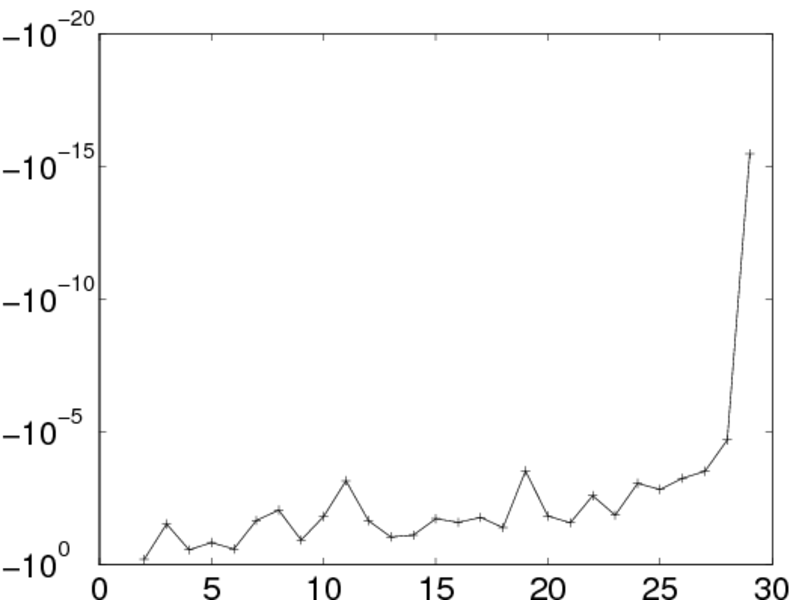
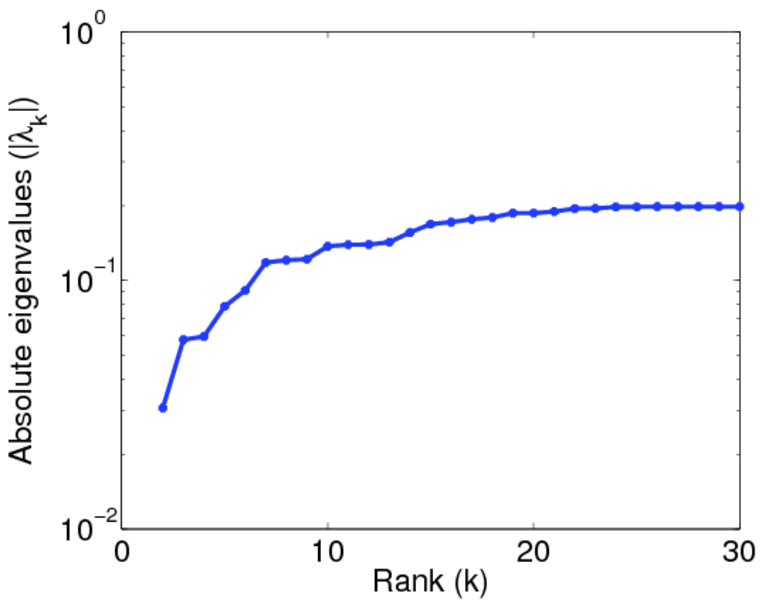
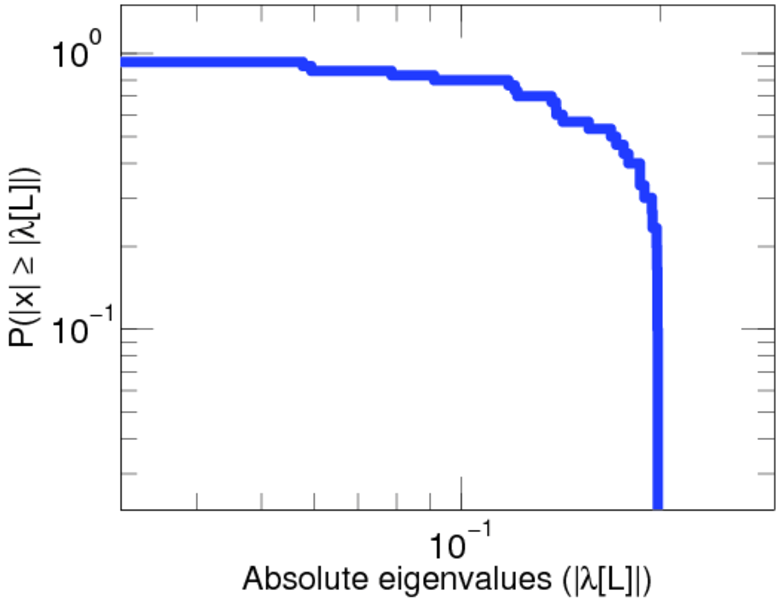
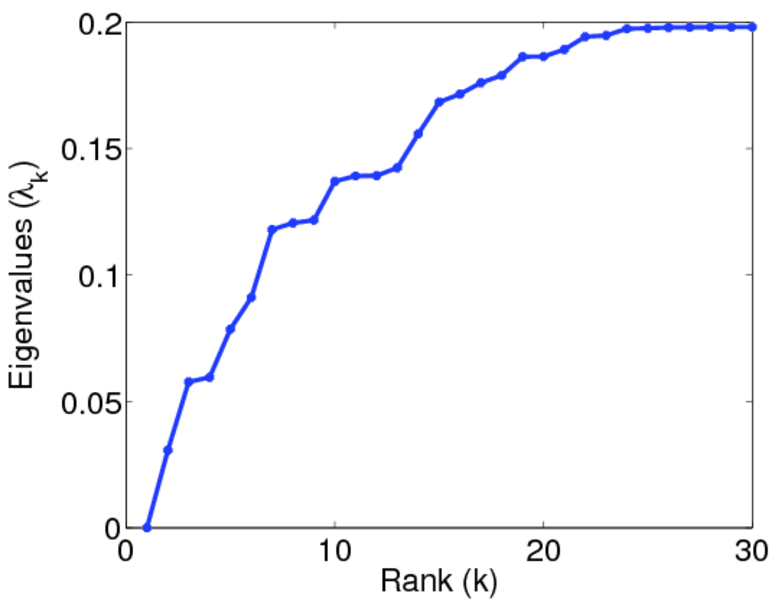
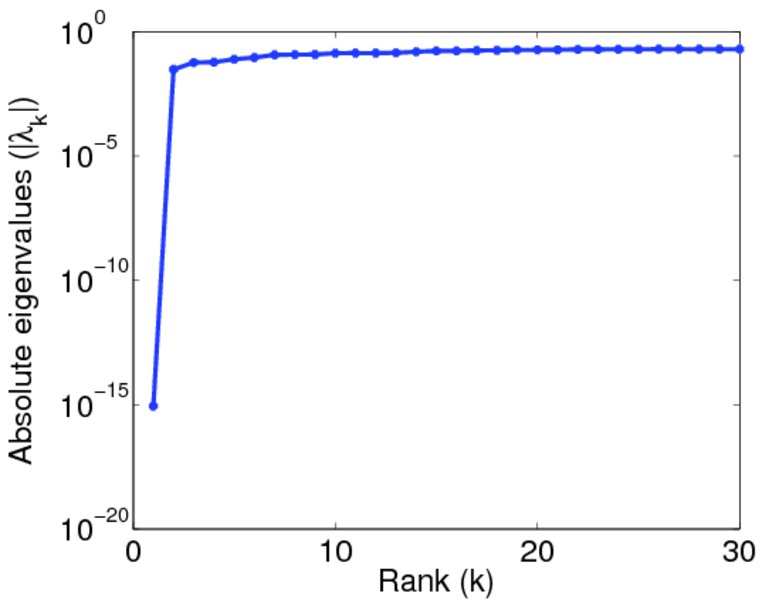
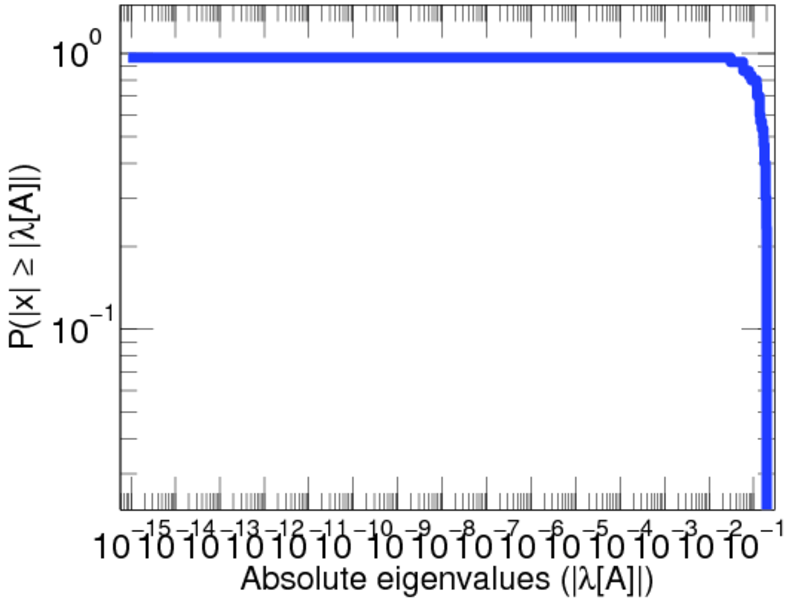
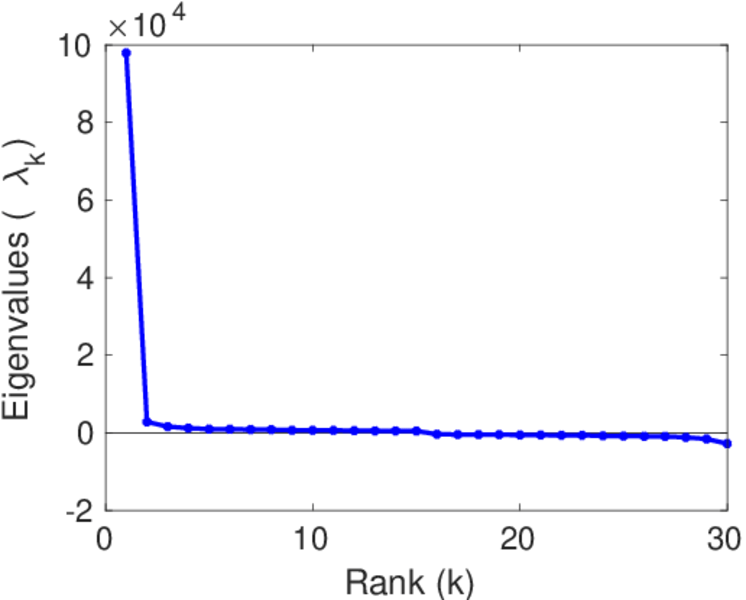
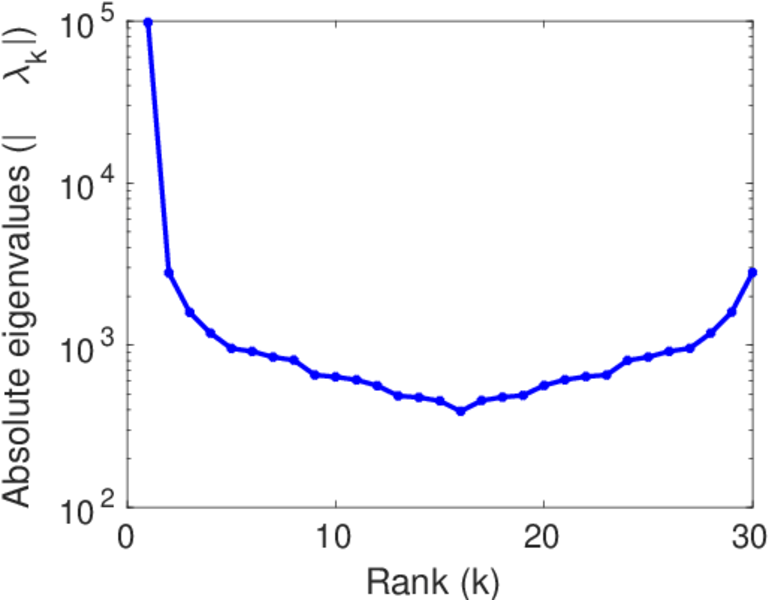
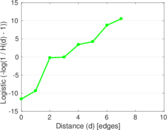
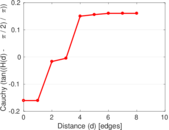
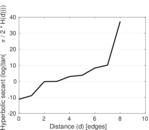
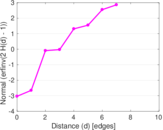
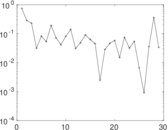
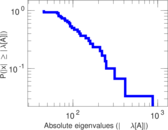
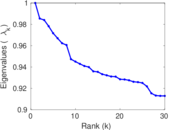
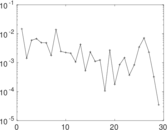
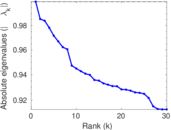
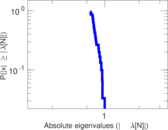
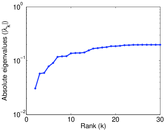
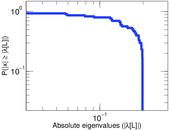
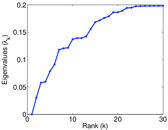
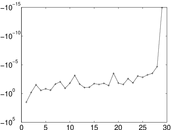
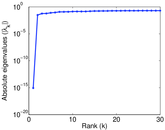
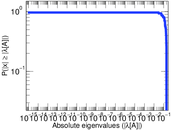
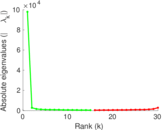
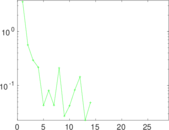
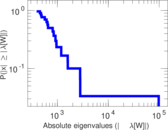
Plots


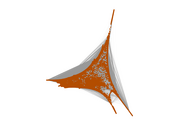

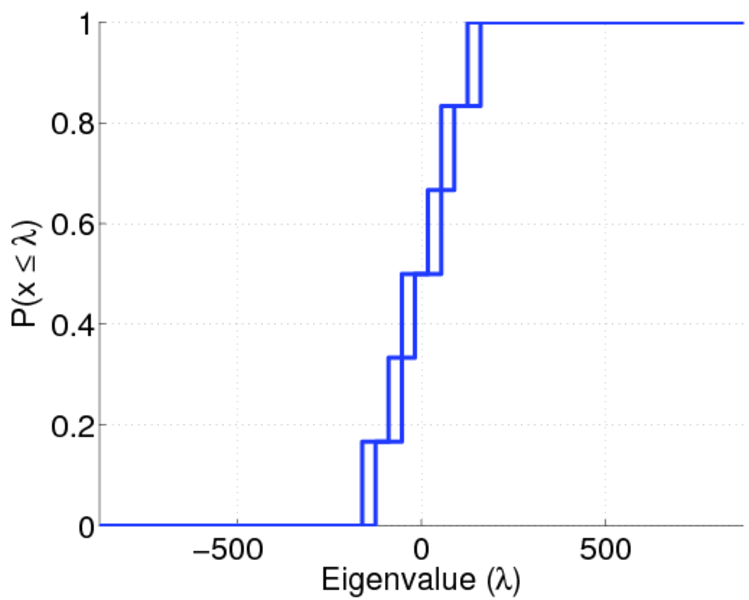
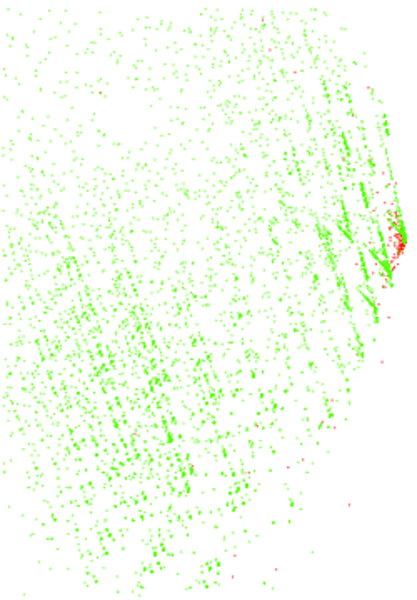
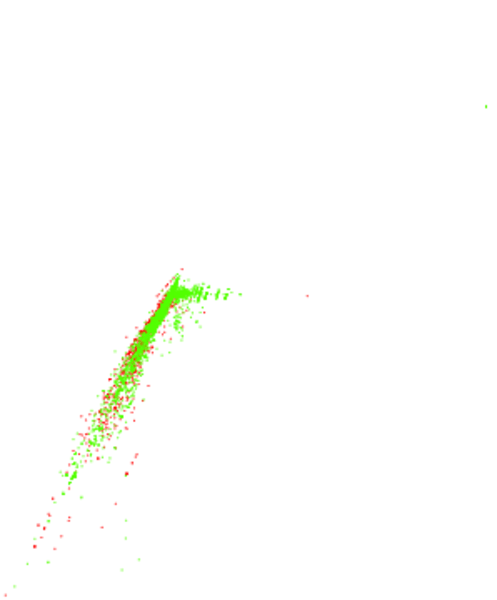
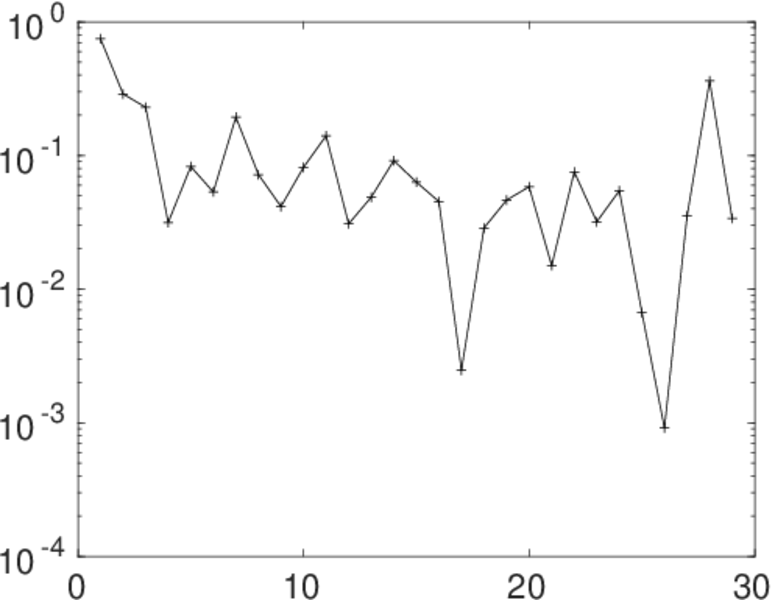
Matrix decompositions plots


Downloads
References
|
[1]
|
Jérôme Kunegis.
KONECT – The Koblenz Network Collection.
In Proc. Int. Conf. on World Wide Web Companion, pages
1343–1350, 2013.
[ http ]
|
|
[2]
|
Wikimedia Foundation.
Wikimedia downloads.
http://dumps.wikimedia.org/, January 2010.
|
 KONECT ‣ Networks ‣
Buy Me a Coffee
KONECT ‣ Networks ‣
Buy Me a Coffee