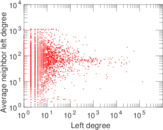
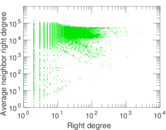
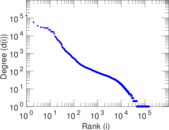
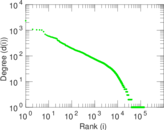
Wikipedia edits (arz)
This is the bipartite edit network of the Egyptian Arabic Wikipedia. It
contains users and pages from the Egyptian Arabic Wikipedia, connected by edit
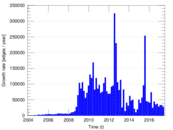
events. Each edge represents an edit. The dataset includes the timestamp of
each edit.
Metadata
Statistics
| Size | n = | 149,412
|
| Left size | n1 = | 8,429
|
| Right size | n2 = | 140,983
|
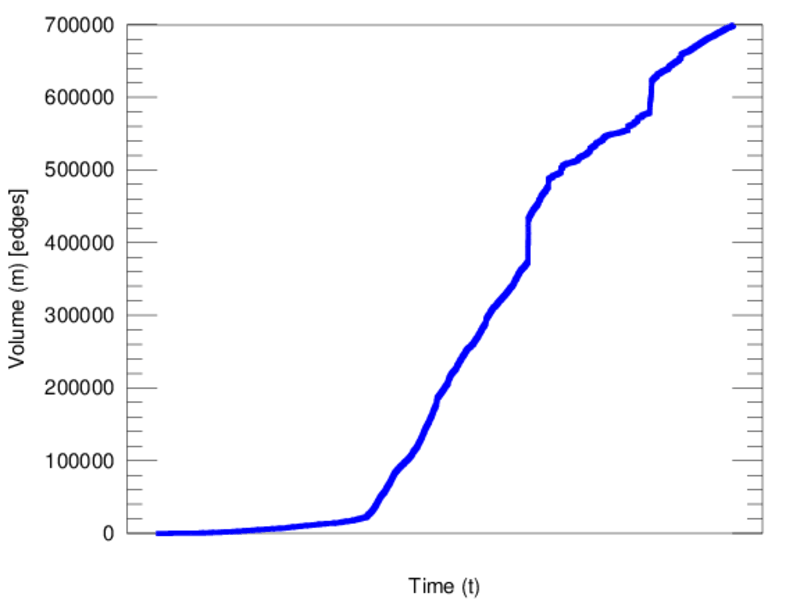
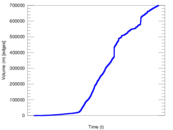
| Volume | m = | 699,444
|
| Unique edge count | m̿ = | 367,653
|
| Wedge count | s = | 7,019,524,542
|
| Claw count | z = | 235,981,309,202,155
|
| Cross count | x = | 6,532,135,814,608,661,504
|
| Square count | q = | 1,543,428,104
|
| 4-Tour count | T4 = | 40,426,308,446
|
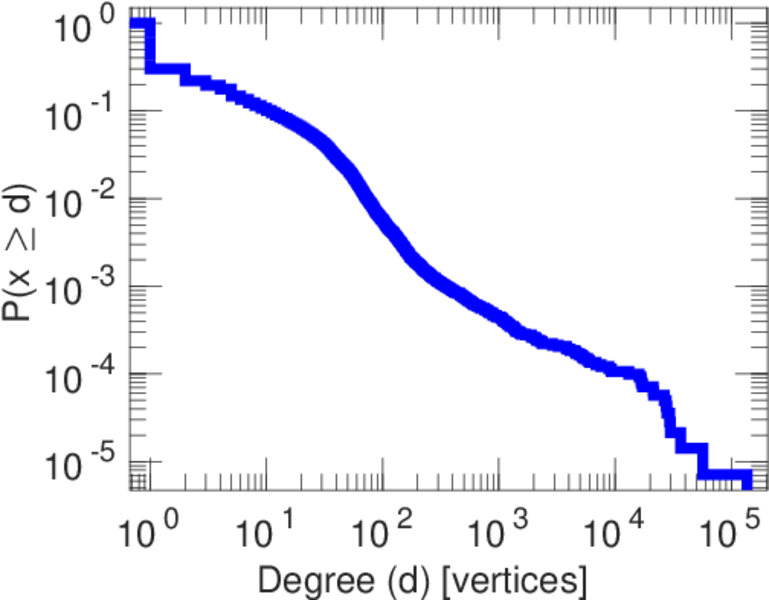
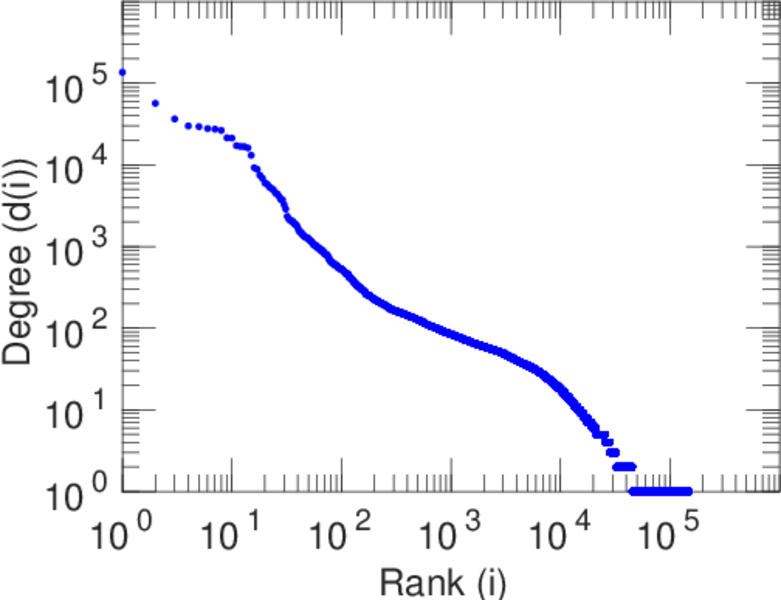
| Maximum degree | dmax = | 136,135
|
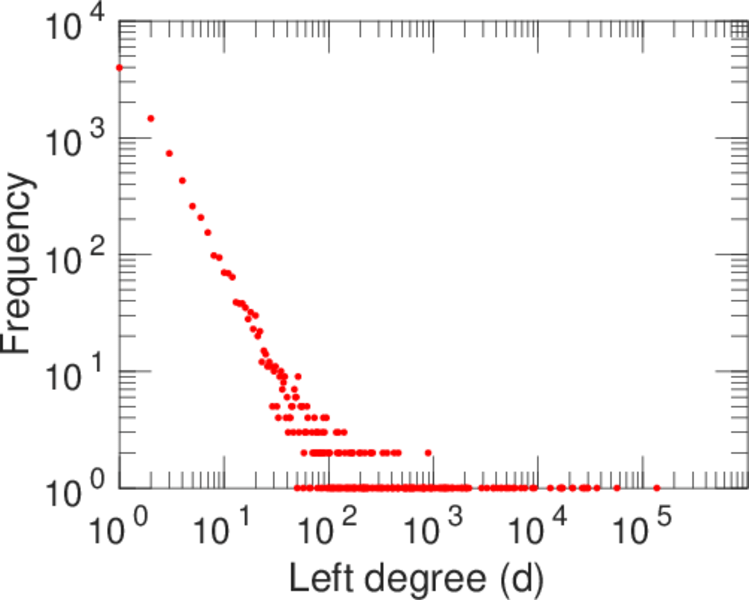
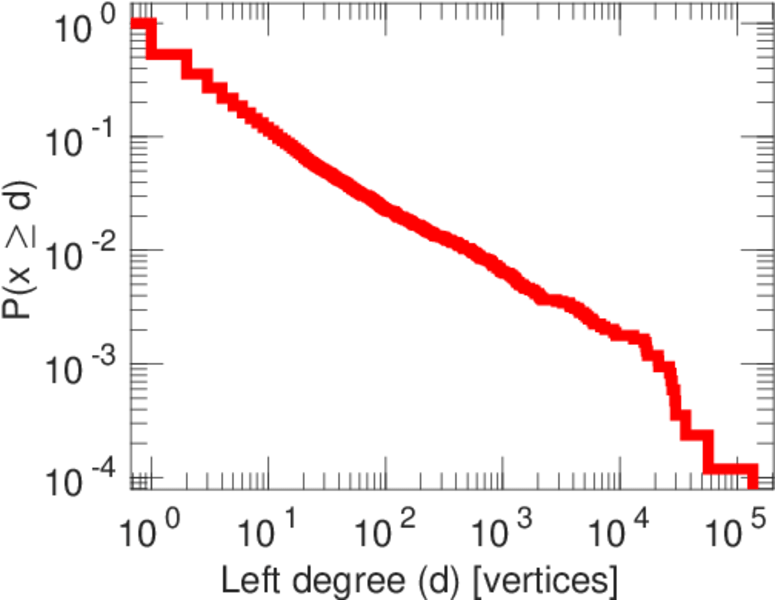
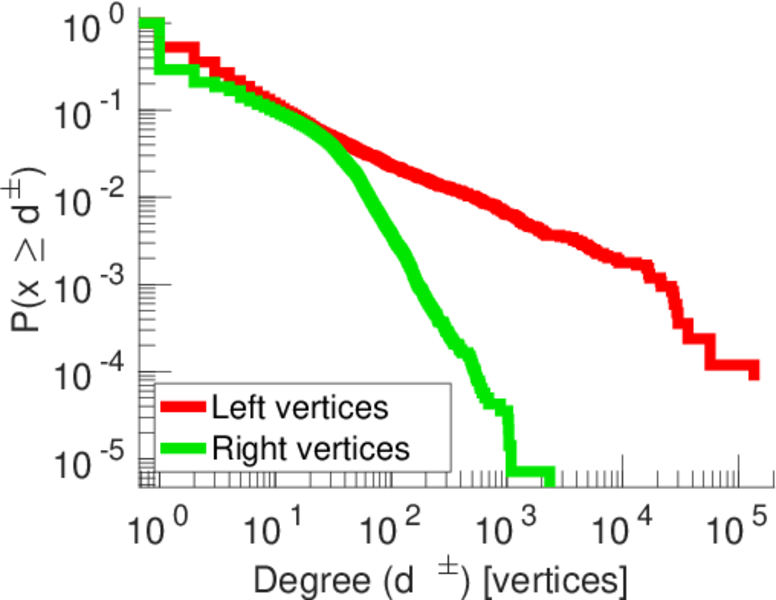
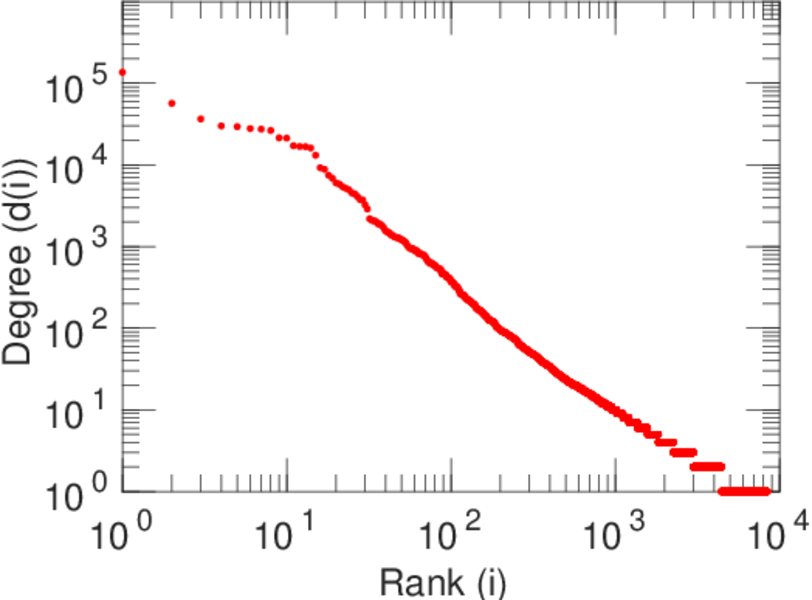
| Maximum left degree | d1max = | 136,135
|
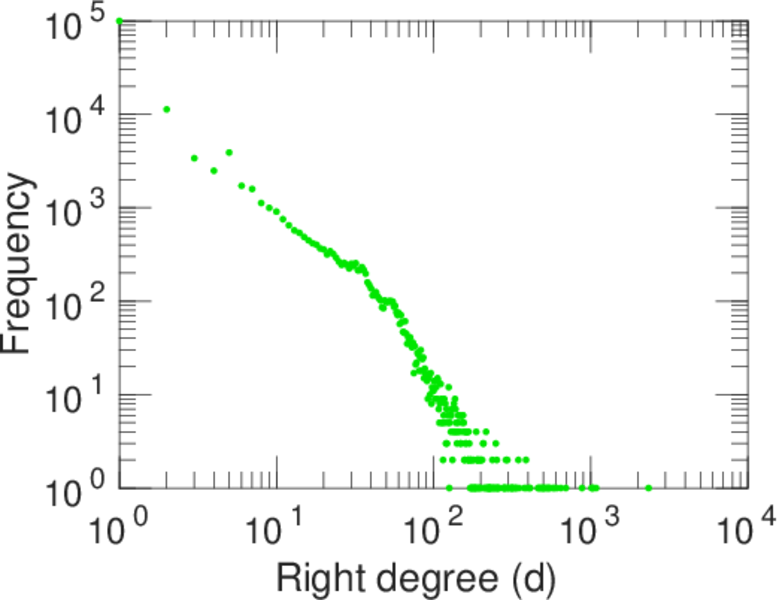
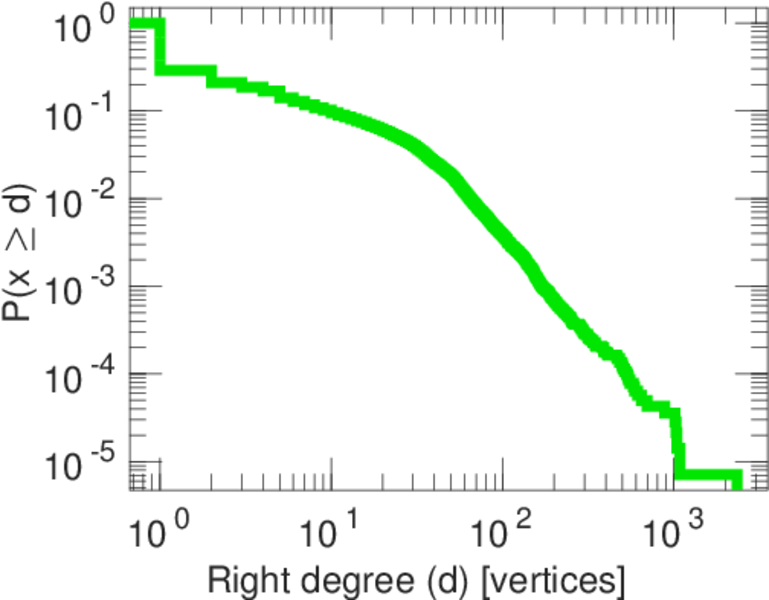
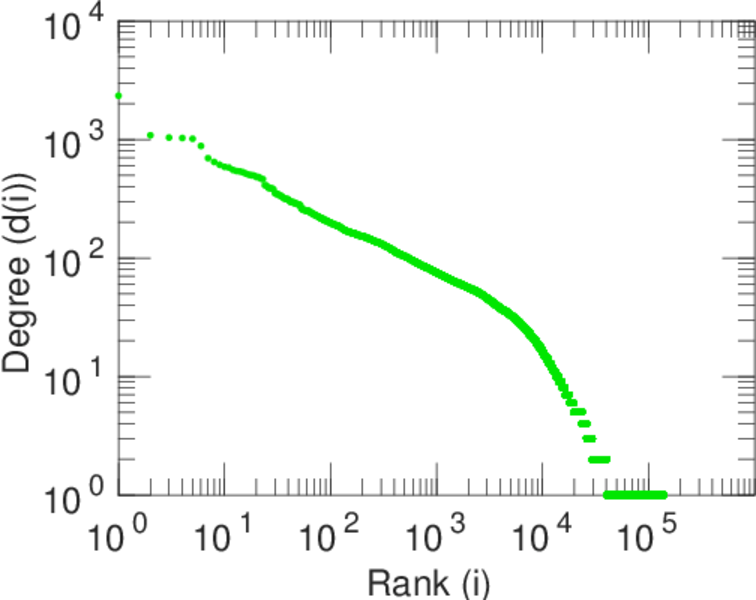
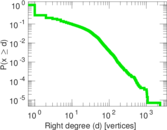
| Maximum right degree | d2max = | 2,341
|
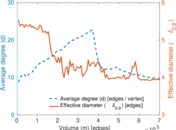
| Average degree | d = | 9.362 62
|
| Average left degree | d1 = | 82.980 7
|
| Average right degree | d2 = | 4.961 19
|
| Fill | p = | 0.000 309 382
|
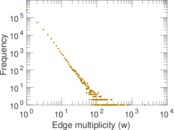
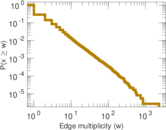
| Average edge multiplicity | m̃ = | 1.902 46
|
| Size of LCC | N = | 147,402
|
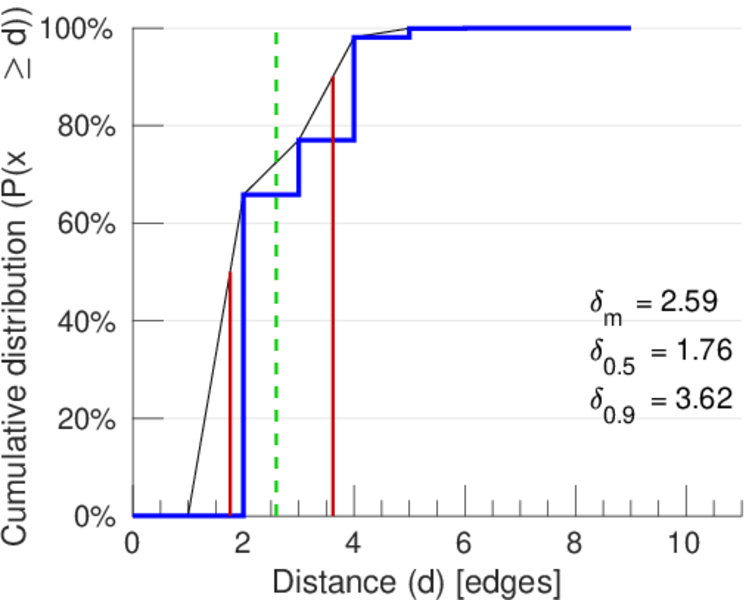
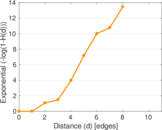
| Diameter | δ = | 12
|
| 50-Percentile effective diameter | δ0.5 = | 1.759 50
|
| 90-Percentile effective diameter | δ0.9 = | 3.615 84
|
| Median distance | δM = | 2
|
| Mean distance | δm = | 2.591 32
|
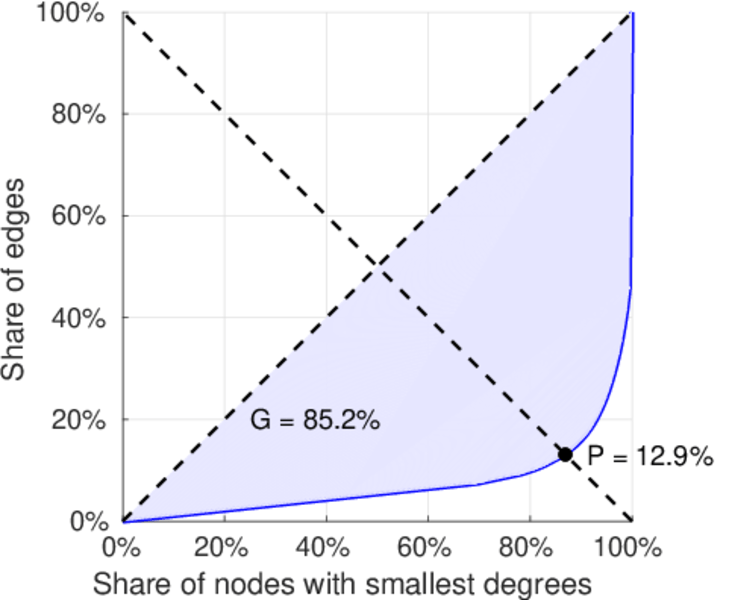
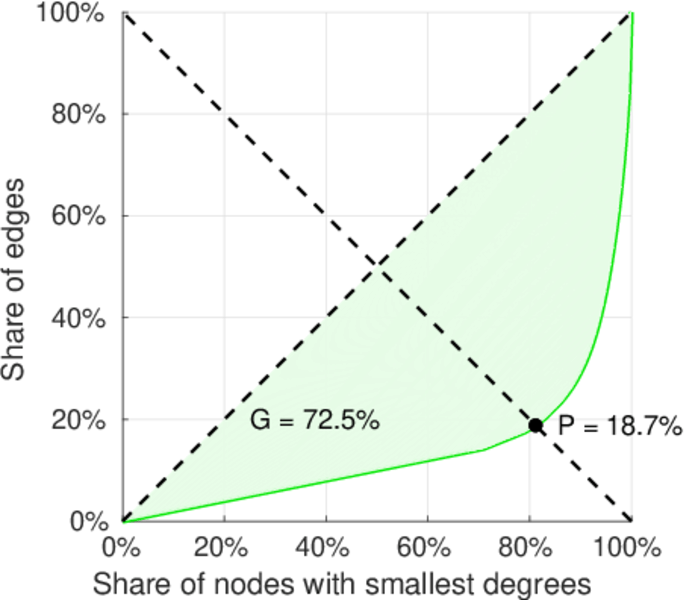
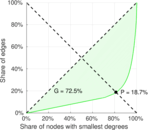
| Gini coefficient | G = | 0.858 073
|
| Balanced inequality ratio | P = | 0.127 197
|
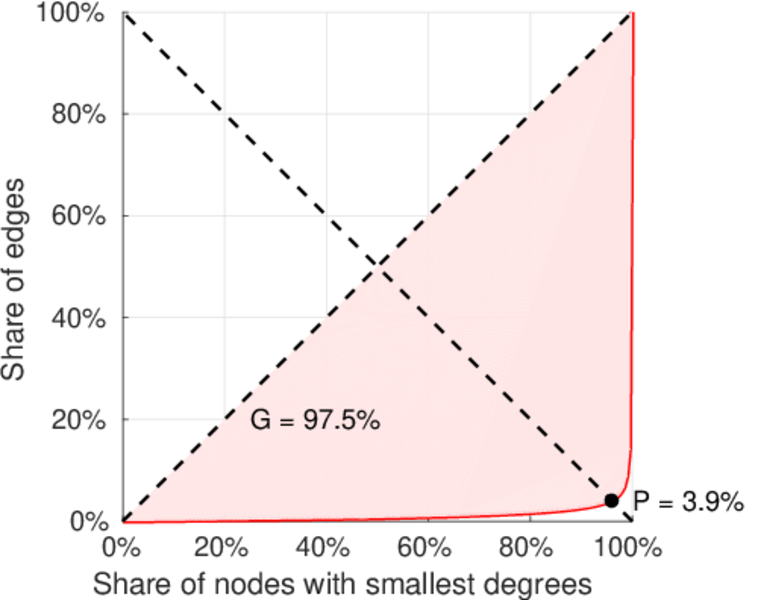
| Left balanced inequality ratio | P1 = | 0.038 873 7
|
| Right balanced inequality ratio | P2 = | 0.186 853
|
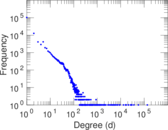
| Power law exponent | γ = | 3.445 55
|
| Tail power law exponent | γt = | 2.001 00
|
| Degree assortativity | ρ = | −0.435 073
|
| Degree assortativity p-value | pρ = | 0.000 00
|
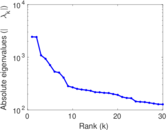
| Spectral norm | α = | 2,438.95
|
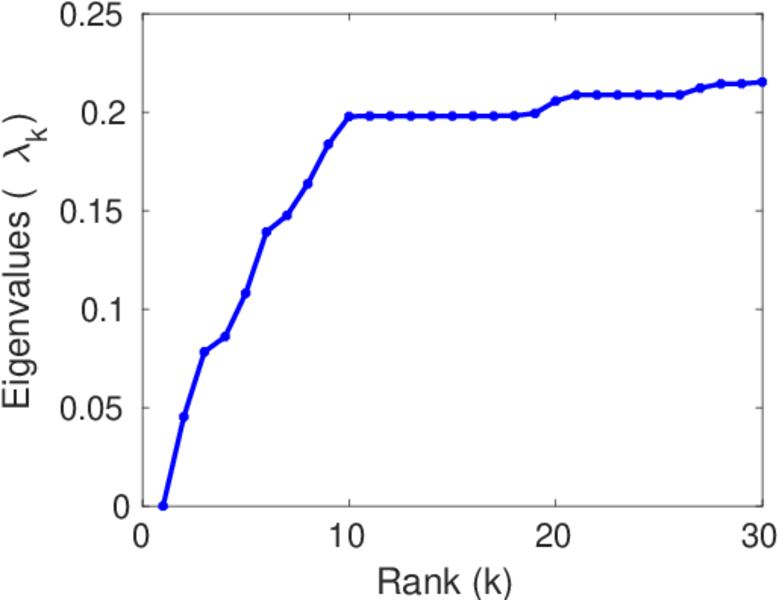
| Algebraic connectivity | a = | 0.045 223 5
|
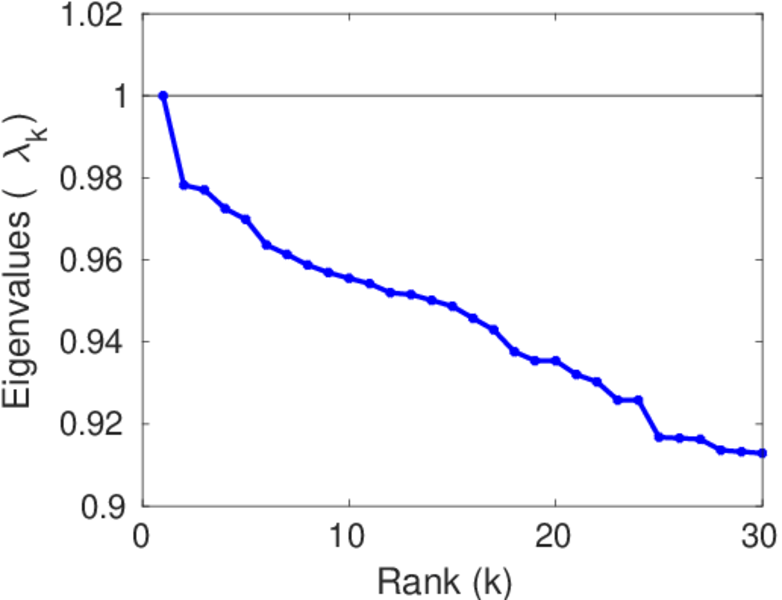
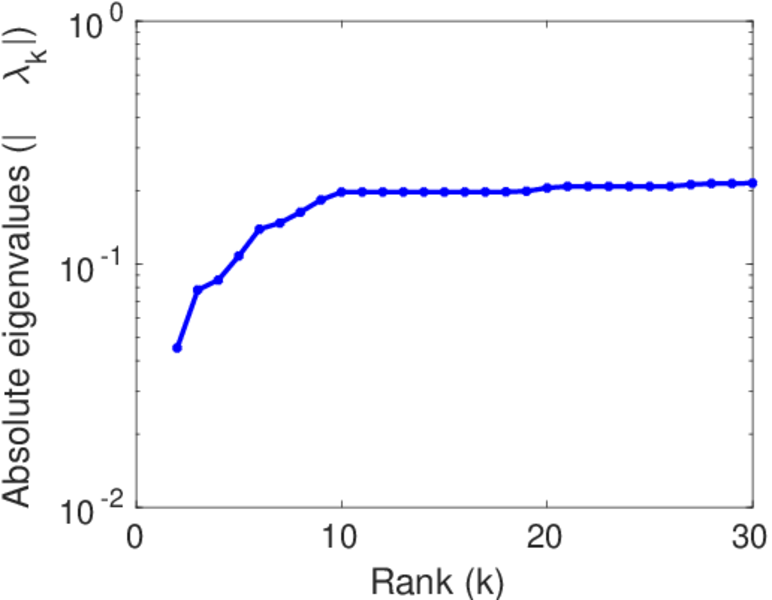
| Spectral separation | |λ1[A] / λ2[A]| = | 1.009 19
|
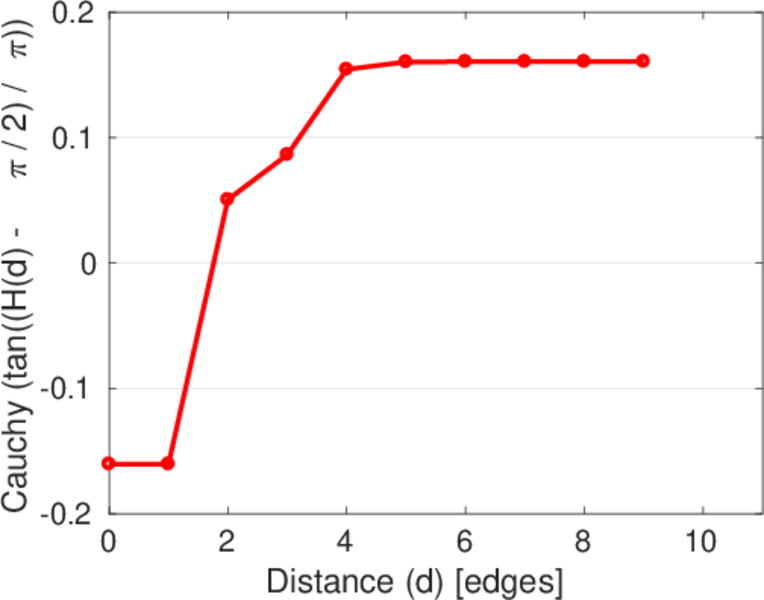
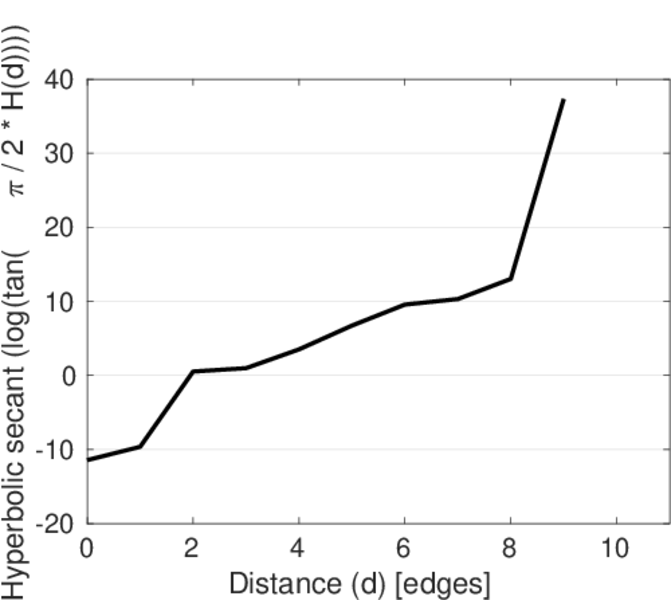
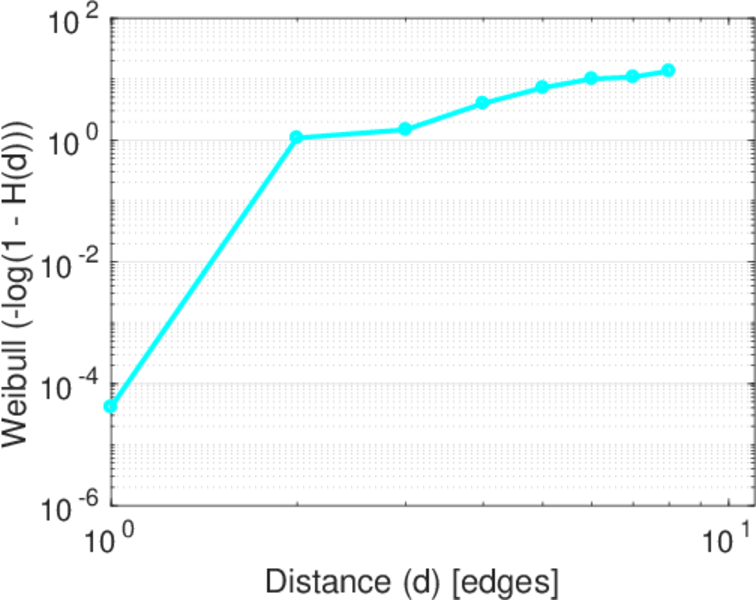
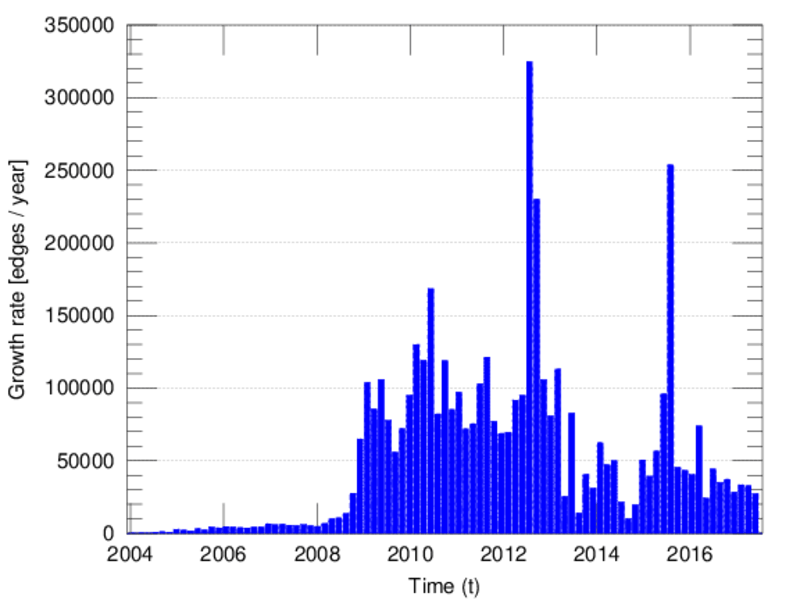
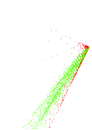
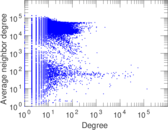
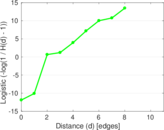
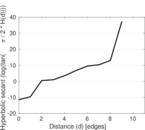
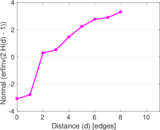
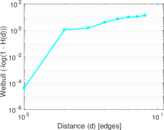
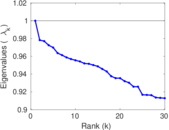
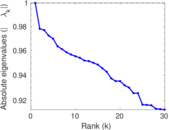
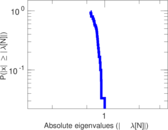
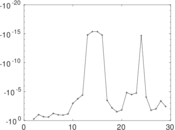
Plots


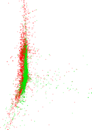
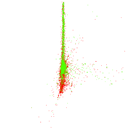


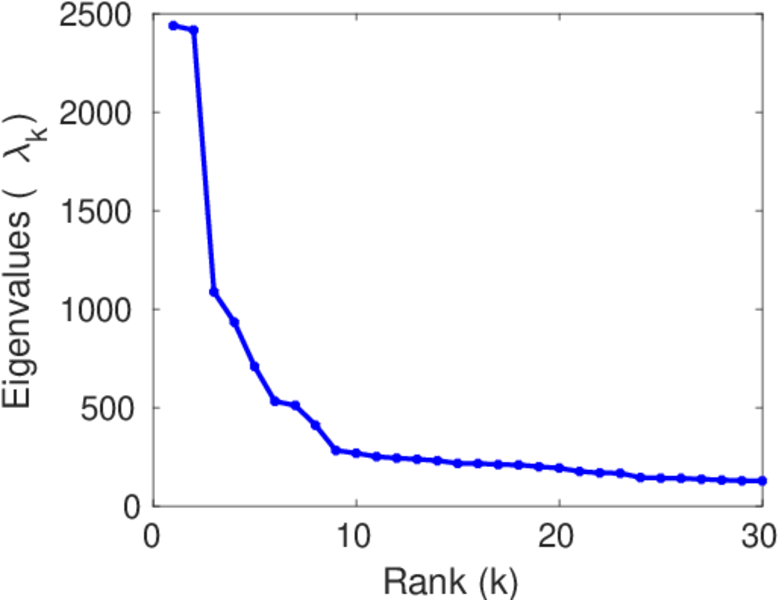
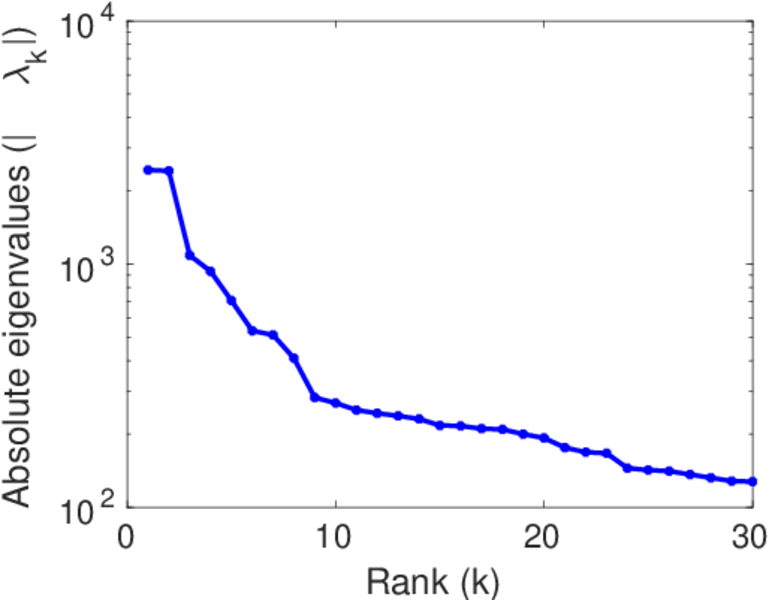
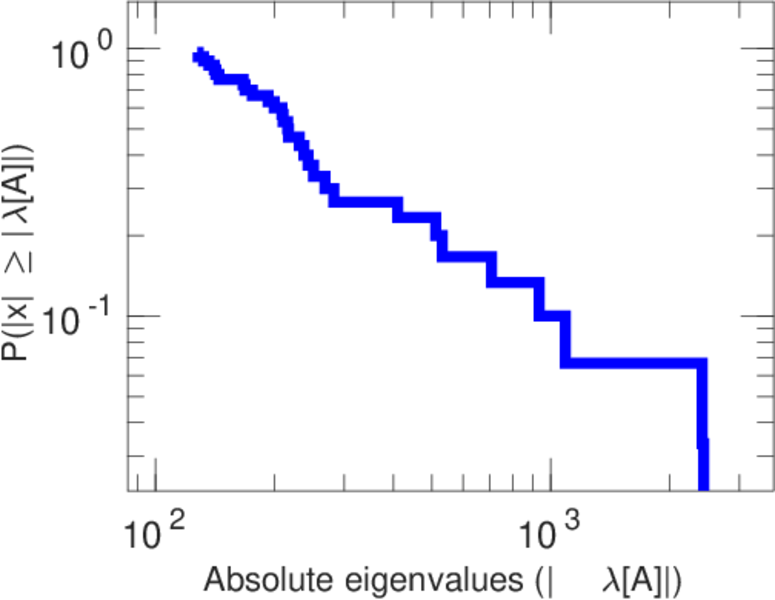
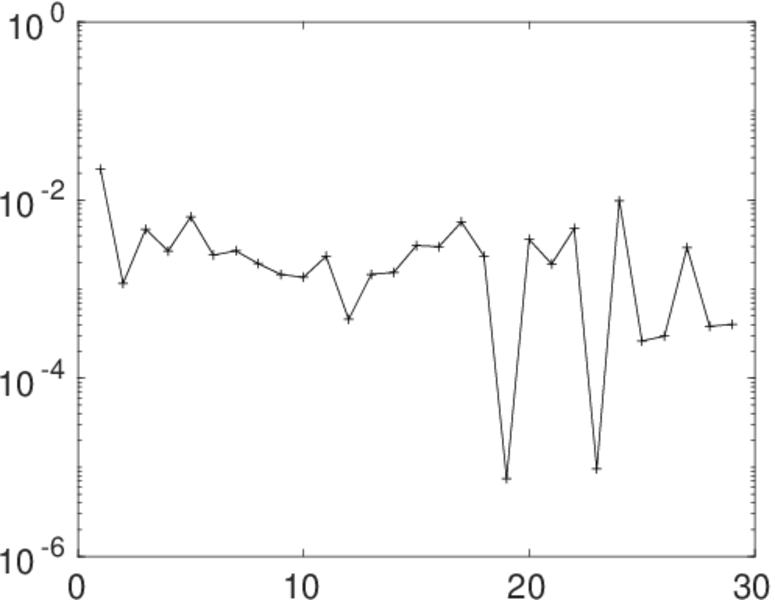
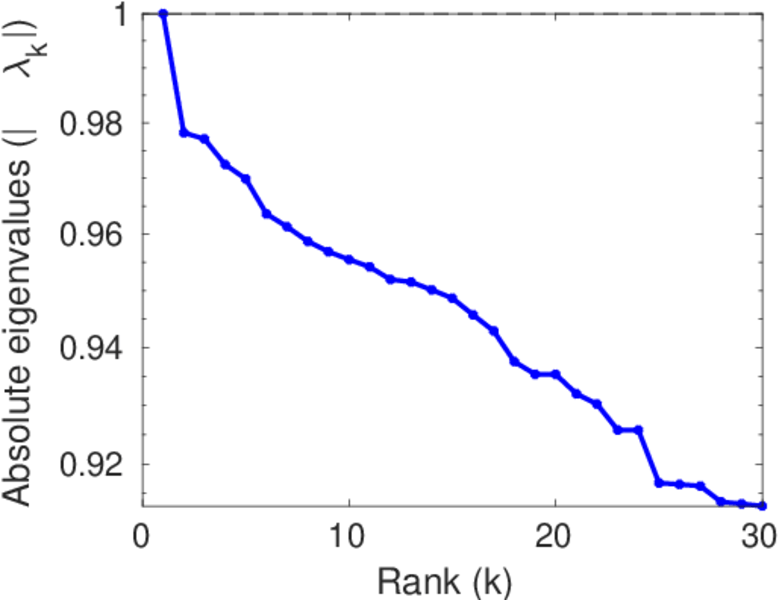
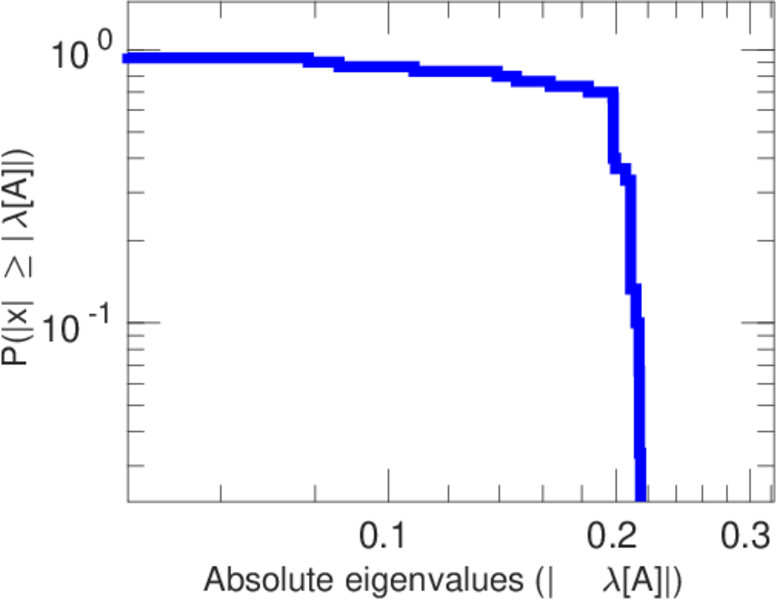
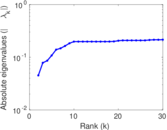
Matrix decompositions plots


Downloads
References
|
[1]
|
Jérôme Kunegis.
KONECT – The Koblenz Network Collection.
In Proc. Int. Conf. on World Wide Web Companion, pages
1343–1350, 2013.
[ http ]
|
|
[2]
|
Wikimedia Foundation.
Wikimedia downloads.
http://dumps.wikimedia.org/, January 2010.
|
 KONECT ‣ Networks ‣
Buy Me a Coffee
KONECT ‣ Networks ‣
Buy Me a Coffee