Wikipedia edits (ast)
This is the bipartite edit network of the Asturian Wikipedia. It contains users
and pages from the Asturian Wikipedia, connected by edit events. Each edge
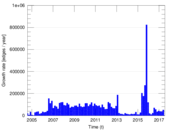
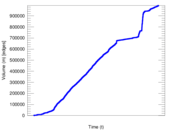
represents an edit. The dataset includes the timestamp of each edit.
Metadata
Statistics
| Size | n = | 81,704
|
| Left size | n1 = | 4,033
|
| Right size | n2 = | 77,671
|
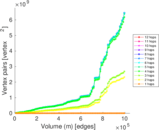
| Volume | m = | 994,558
|
| Unique edge count | m̿ = | 436,676
|
| Wedge count | s = | 2,402,087,150
|
| Claw count | z = | 17,633,789,427,562
|
| Cross count | x = | 121,576,211,435,839,248
|
| Square count | q = | 4,081,465,143
|
| 4-Tour count | T4 = | 42,261,423,196
|
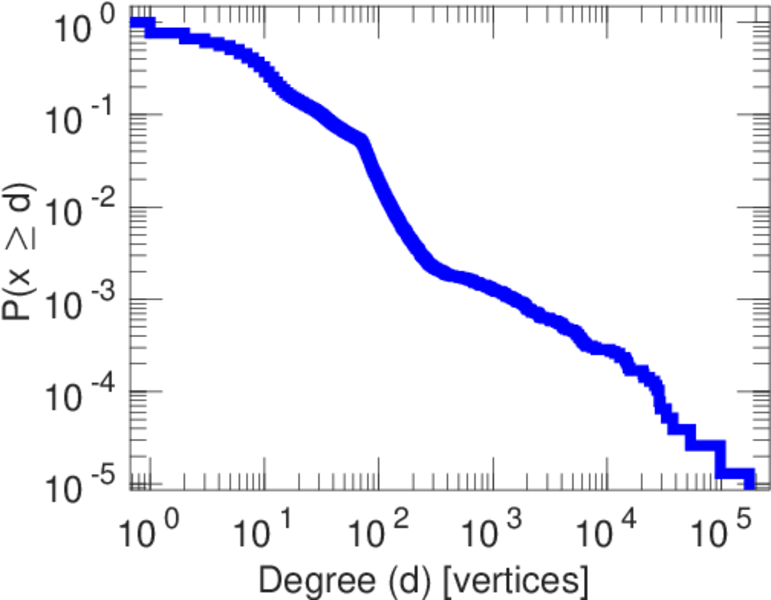
| Maximum degree | dmax = | 175,172
|
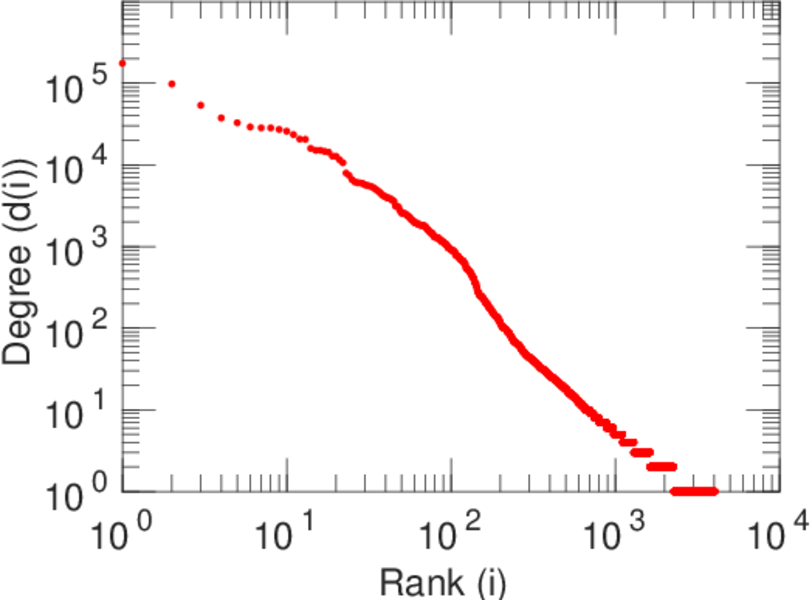
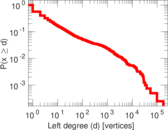
| Maximum left degree | d1max = | 175,172
|
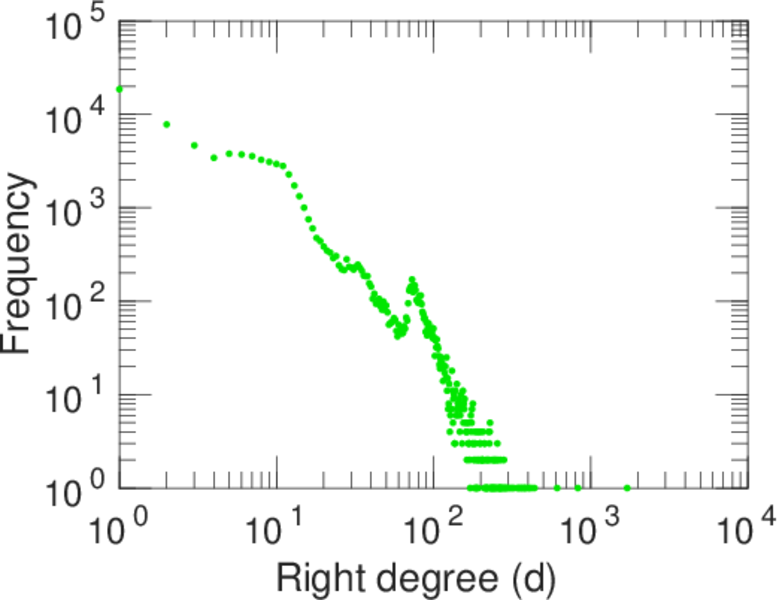
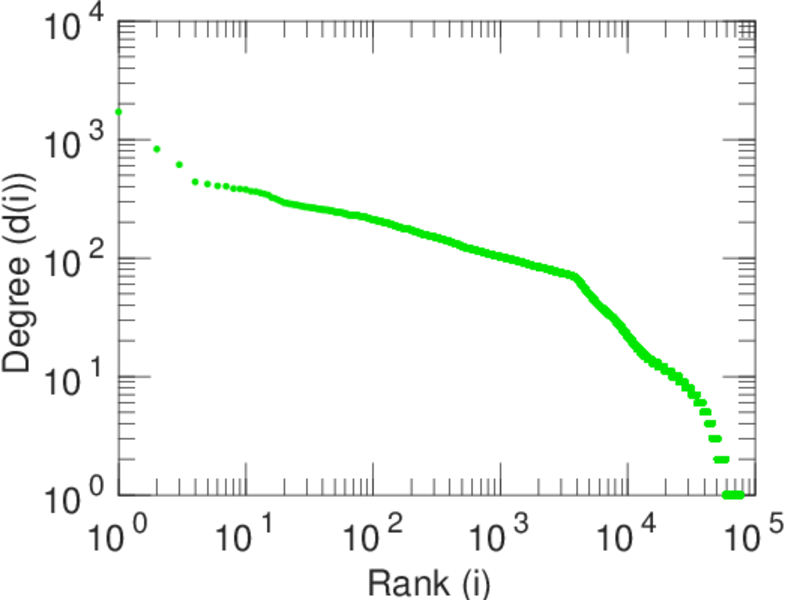
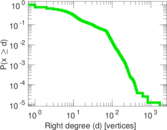
| Maximum right degree | d2max = | 1,711
|
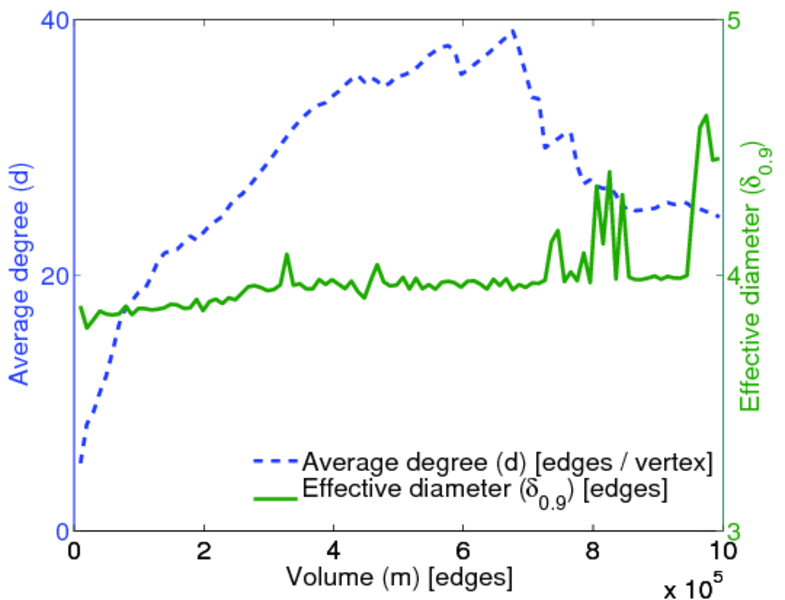
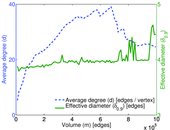
| Average degree | d = | 24.345 4
|
| Average left degree | d1 = | 246.605
|
| Average right degree | d2 = | 12.804 8
|
| Fill | p = | 0.001 394 03
|
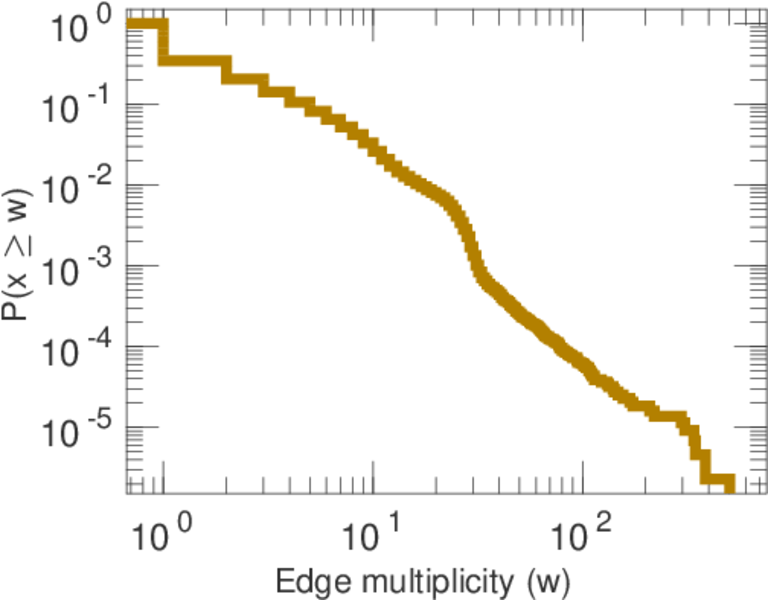
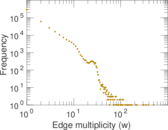
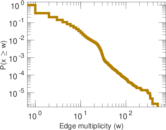
| Average edge multiplicity | m̃ = | 2.277 57
|
| Size of LCC | N = | 80,307
|
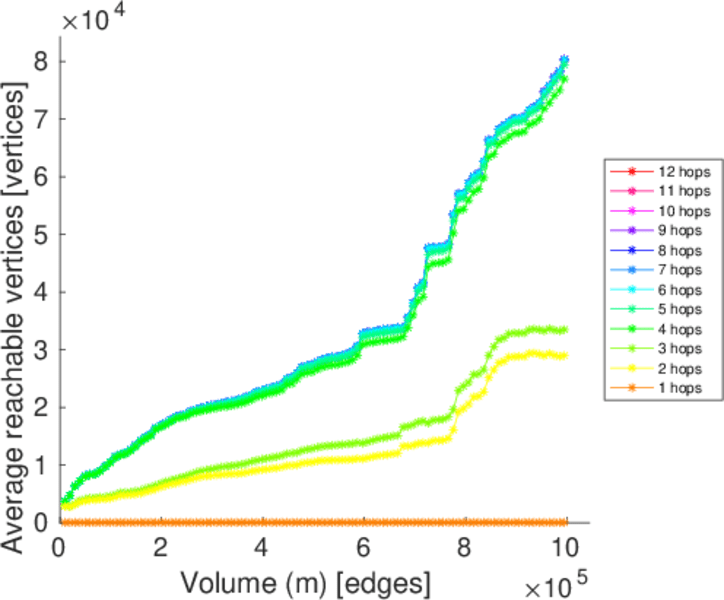
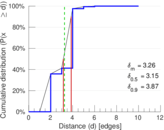
| Diameter | δ = | 12
|
| 50-Percentile effective diameter | δ0.5 = | 3.154 96
|
| 90-Percentile effective diameter | δ0.9 = | 3.866 24
|
| Median distance | δM = | 4
|
| Mean distance | δm = | 3.259 63
|
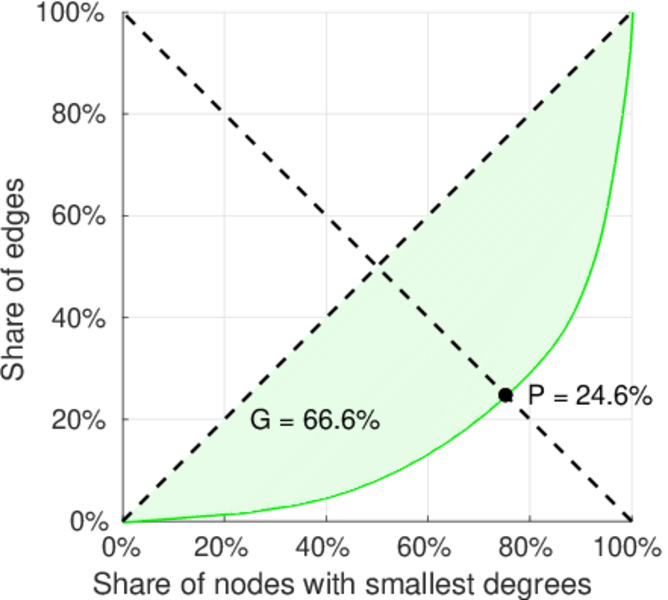
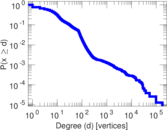
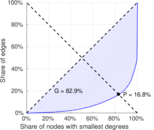
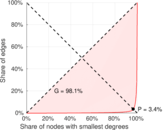
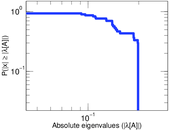
| Gini coefficient | G = | 0.830 293
|
| Balanced inequality ratio | P = | 0.165 777
|
| Left balanced inequality ratio | P1 = | 0.033 717 5
|
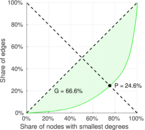
| Right balanced inequality ratio | P2 = | 0.246 428
|
| Relative edge distribution entropy | Her = | 0.726 371
|
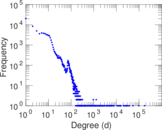
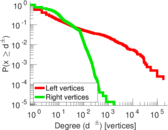
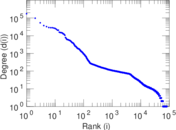
| Power law exponent | γ = | 1.917 29
|
| Tail power law exponent | γt = | 3.091 00
|
| Tail power law exponent with p | γ3 = | 3.091 00
|
| p-value | p = | 0.000 00
|
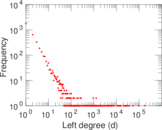
| Left tail power law exponent with p | γ3,1 = | 1.721 00
|
| Left p-value | p1 = | 0.000 00
|
| Right tail power law exponent with p | γ3,2 = | 4.991 00
|
| Right p-value | p2 = | 0.000 00
|
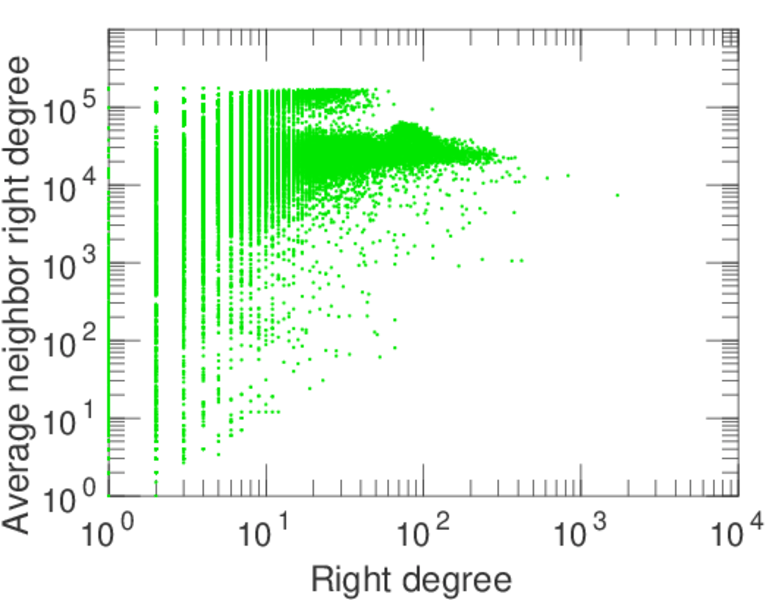
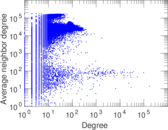
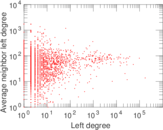
| Degree assortativity | ρ = | −0.441 800
|
| Degree assortativity p-value | pρ = | 0.000 00
|
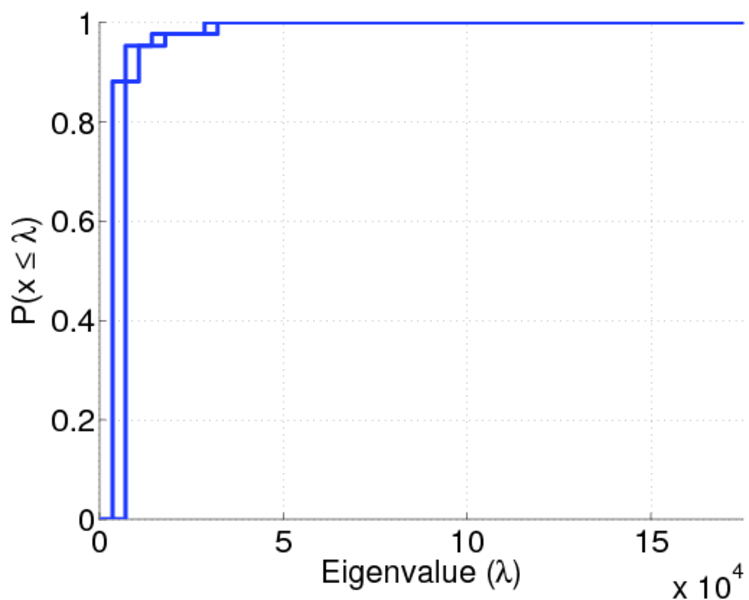
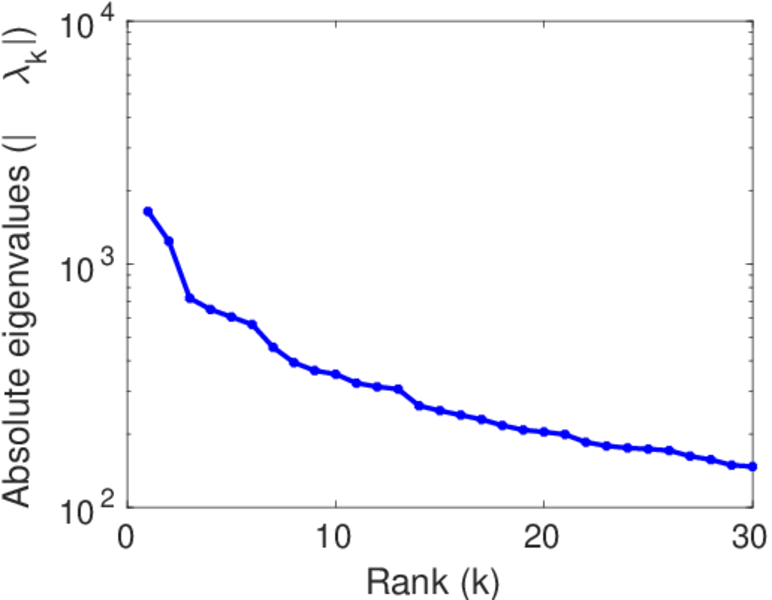
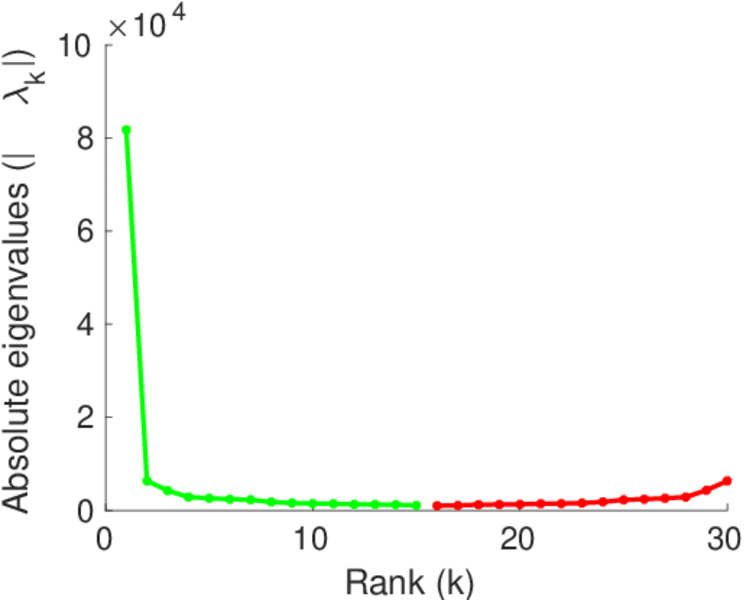
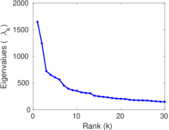
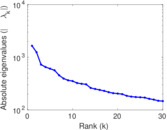
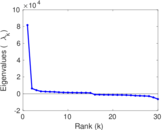
| Spectral norm | α = | 1,646.66
|
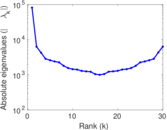
| Algebraic connectivity | a = | 0.042 999 9
|
| Spectral separation | |λ1[A] / λ2[A]| = | 1.324 35
|
| Controllability | C = | 73,772
|
| Relative controllability | Cr = | 0.909 564
|
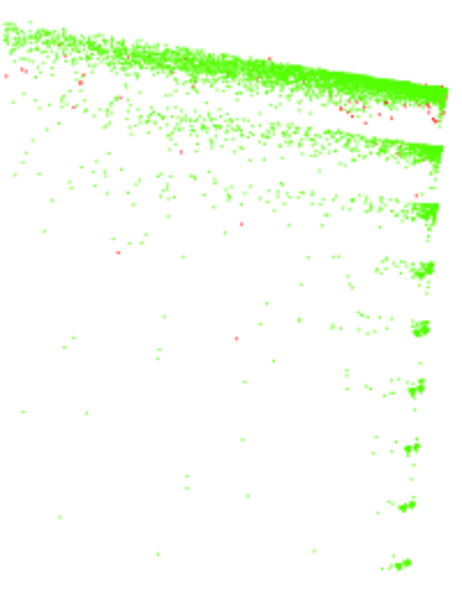
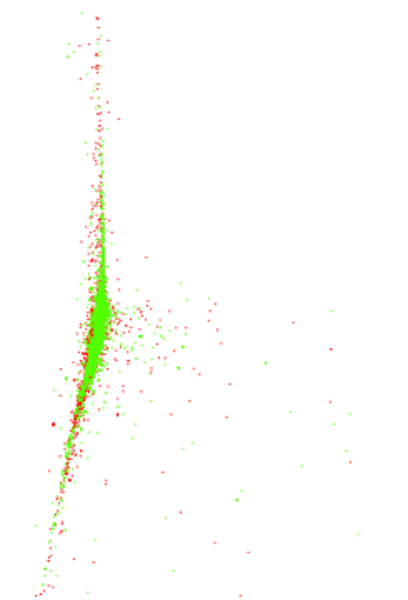
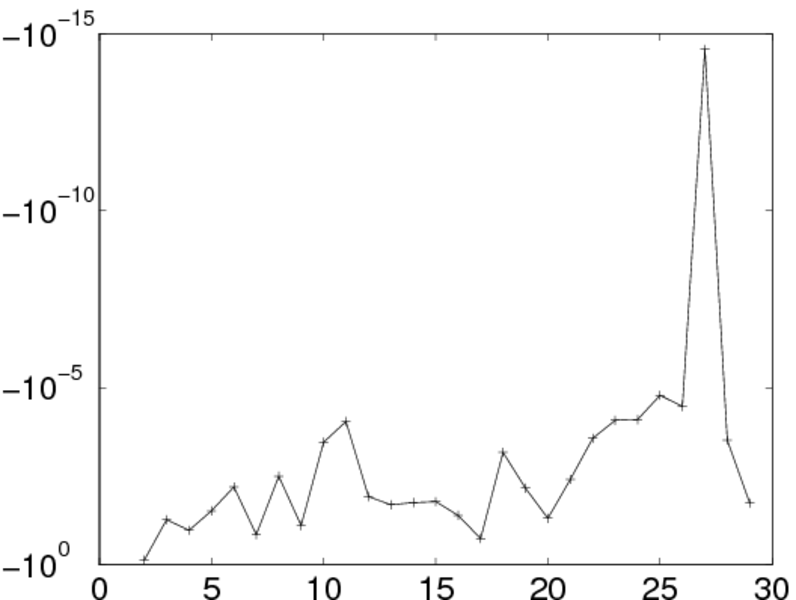
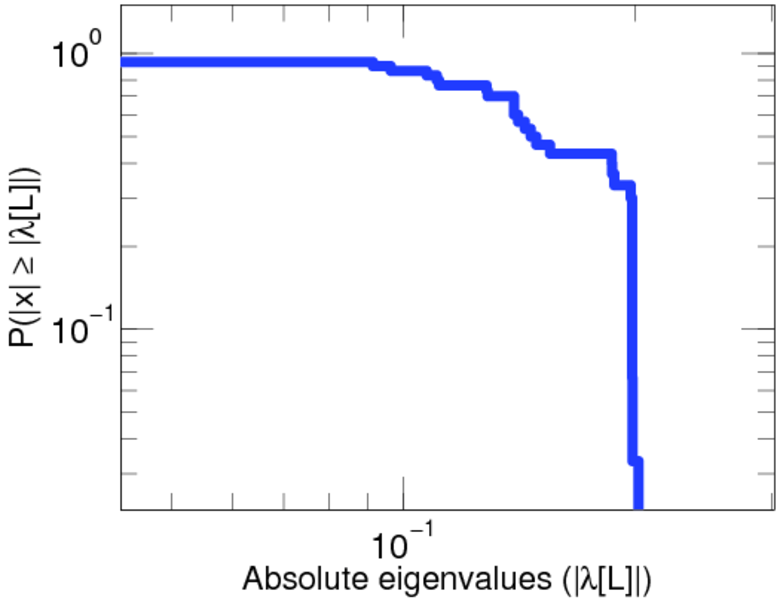
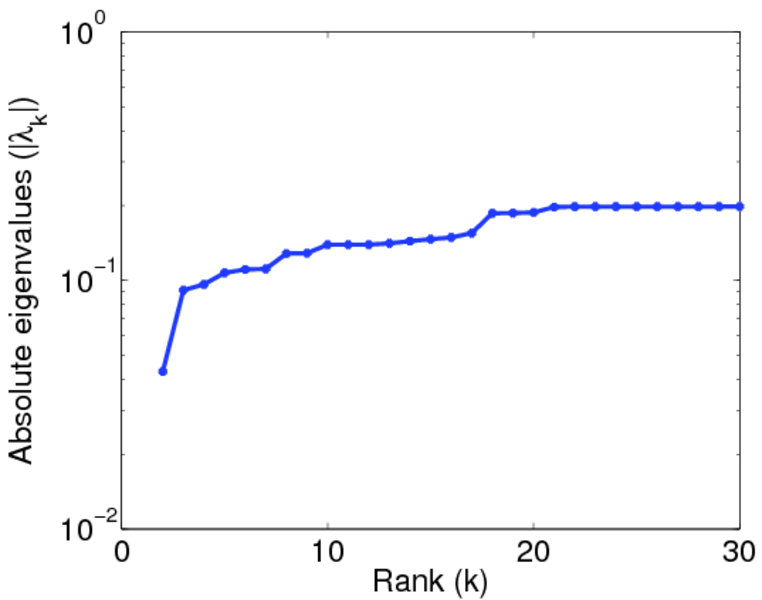
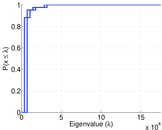
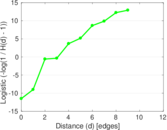
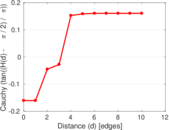
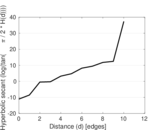
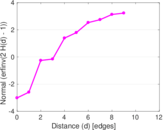
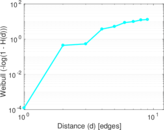
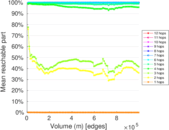
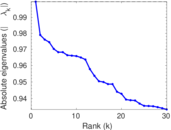
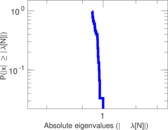
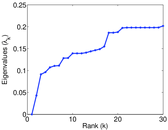
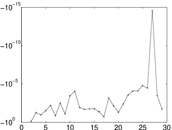
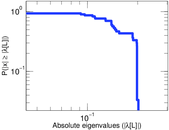
Plots


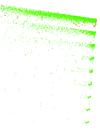
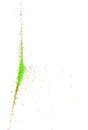
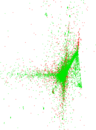


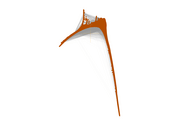

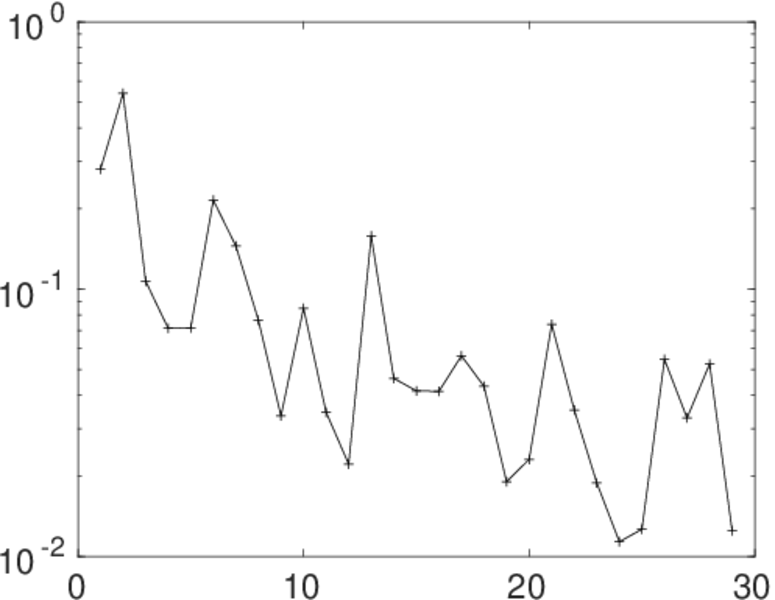
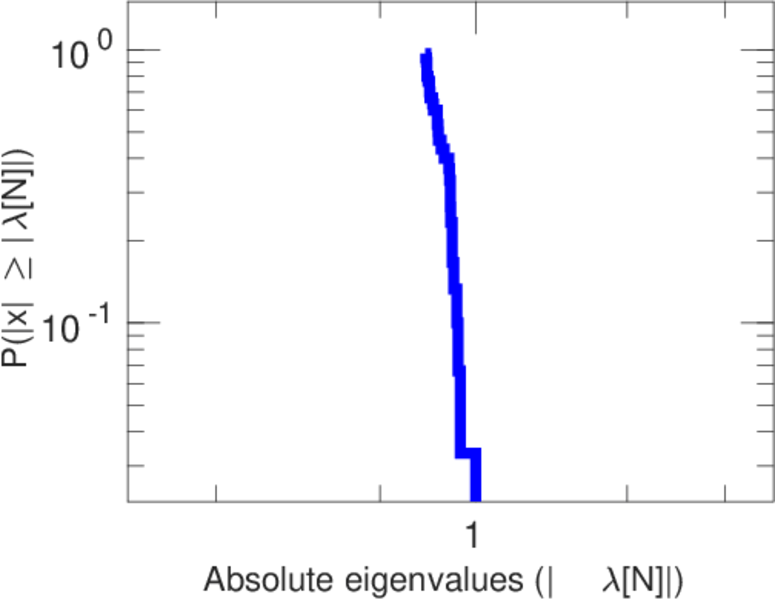
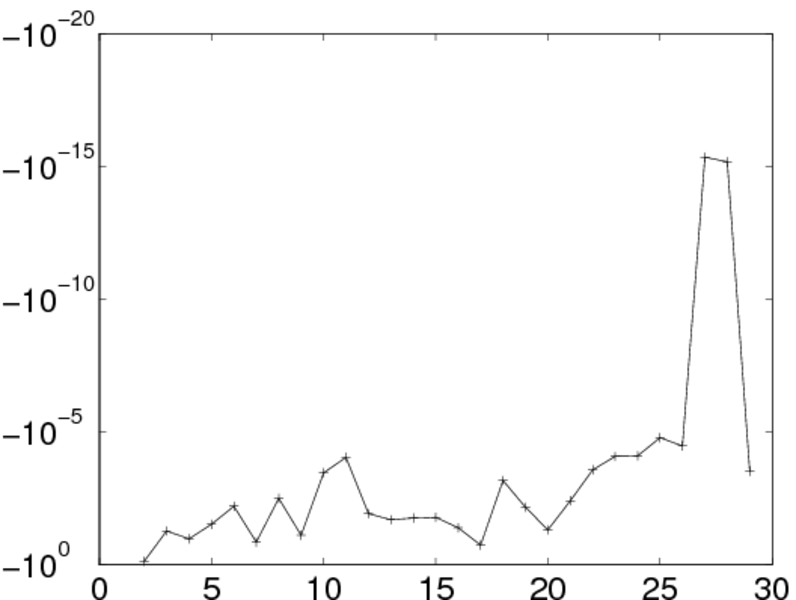
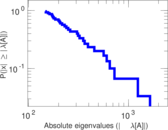
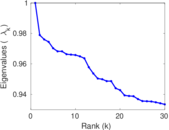
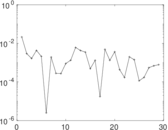
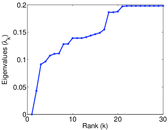
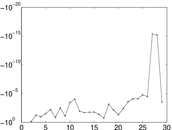
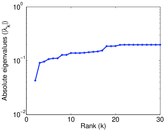
Matrix decompositions plots


Downloads
References
|
[1]
|
Jérôme Kunegis.
KONECT – The Koblenz Network Collection.
In Proc. Int. Conf. on World Wide Web Companion, pages
1343–1350, 2013.
[ http ]
|
|
[2]
|
Wikimedia Foundation.
Wikimedia downloads.
http://dumps.wikimedia.org/, January 2010.
|
 KONECT ‣ Networks ‣
Buy Me a Coffee
KONECT ‣ Networks ‣
Buy Me a Coffee