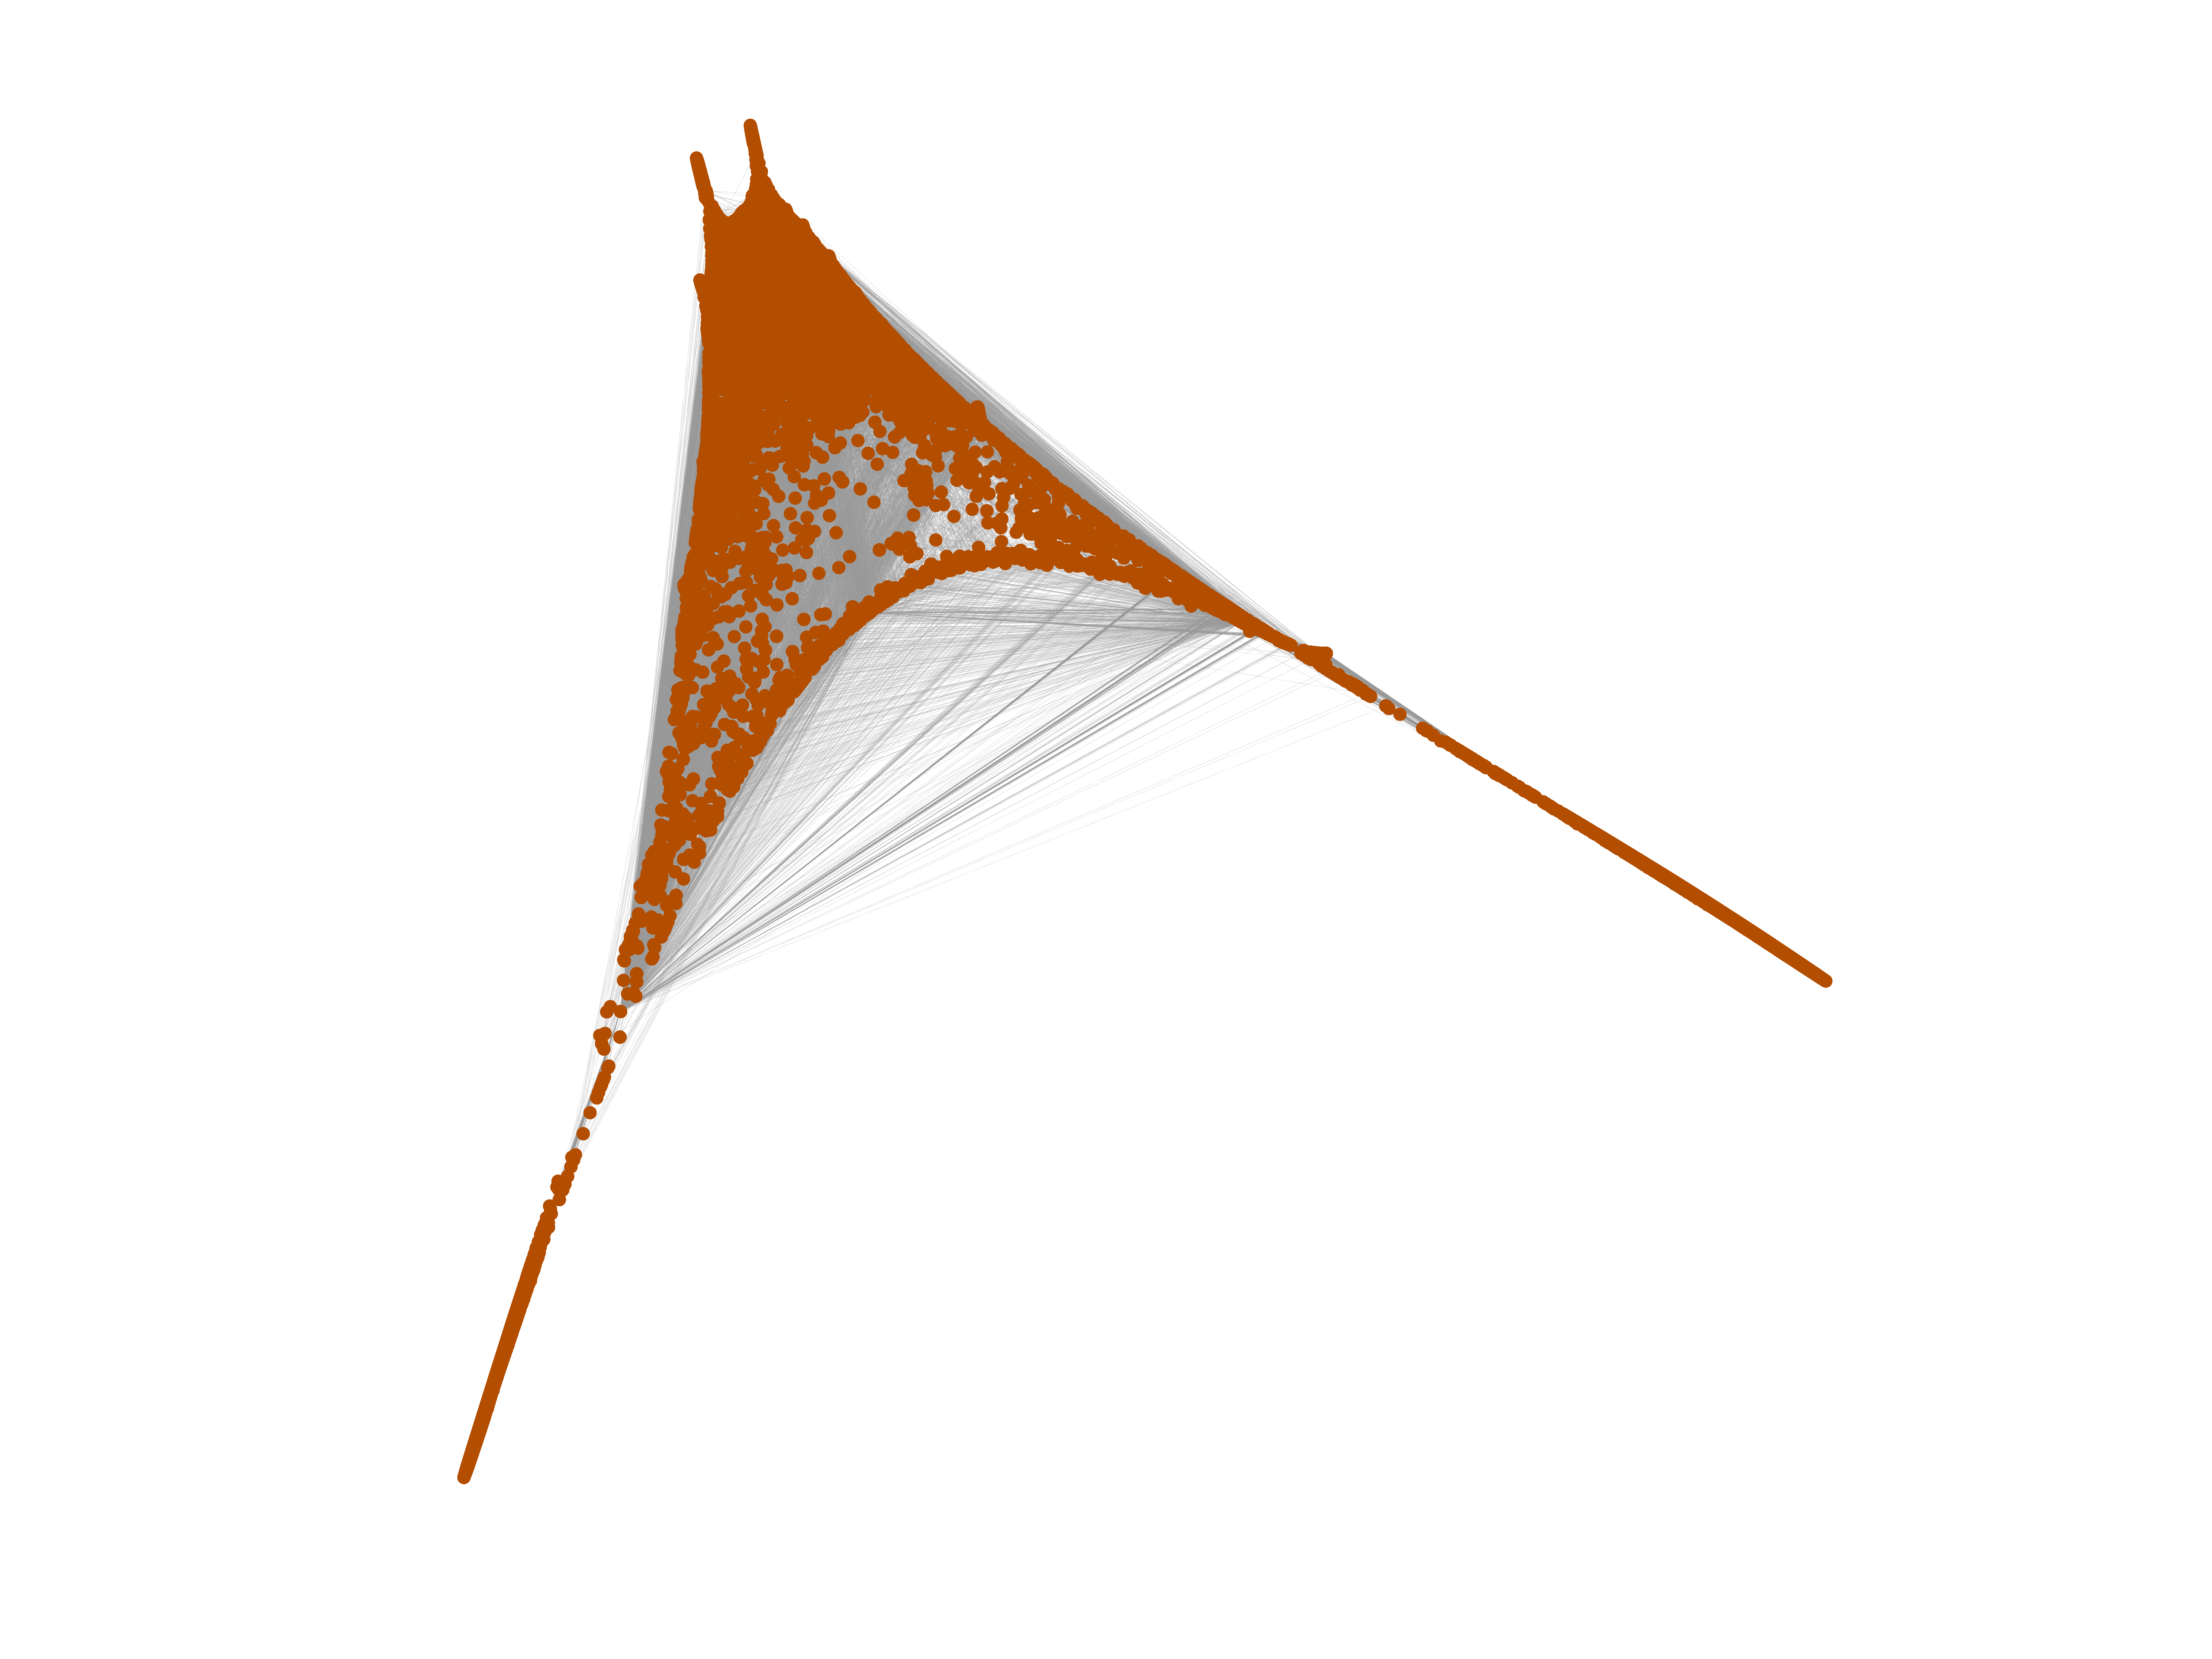
Wikipedia edits (as)
This is the bipartite edit network of the Assamese Wikipedia. It contains users
and pages from the Assamese Wikipedia, connected by edit events. Each edge
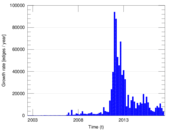
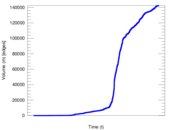
represents an edit. The dataset includes the timestamp of each edit.
Metadata
Statistics
| Size | n = | 39,264
|
| Left size | n1 = | 1,745
|
| Right size | n2 = | 37,519
|
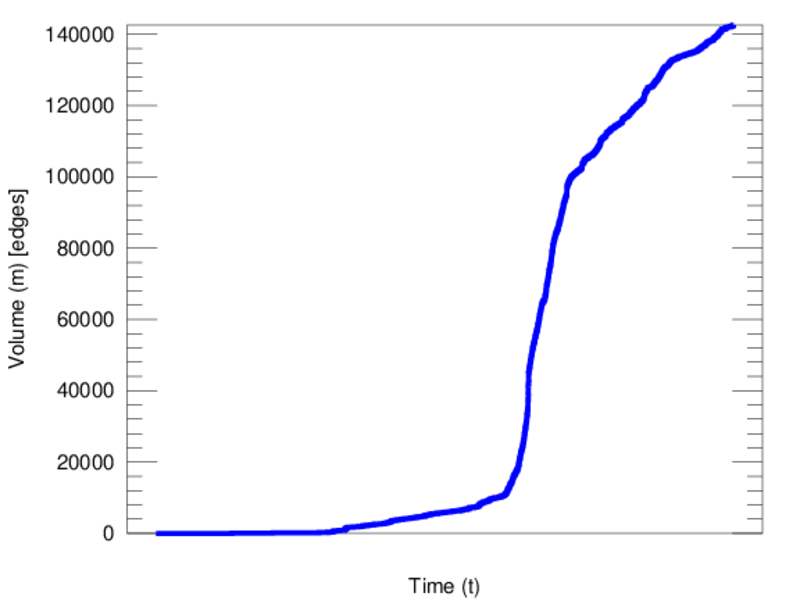
| Volume | m = | 142,592
|
| Unique edge count | m̿ = | 71,348
|
| Wedge count | s = | 177,085,359
|
| Claw count | z = | 654,577,557,615
|
| Cross count | x = | 2,144,934,309,192,093
|
| Square count | q = | 15,325,657
|
| 4-Tour count | T4 = | 831,148,532
|
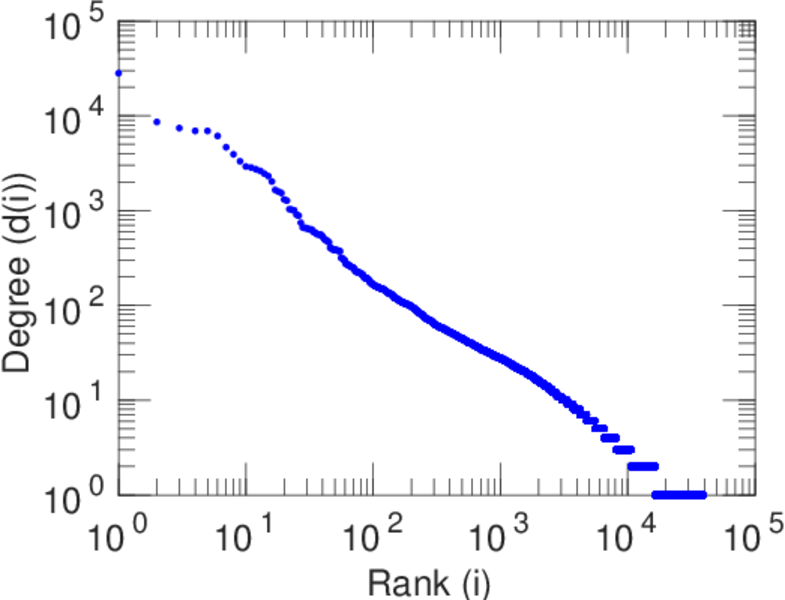
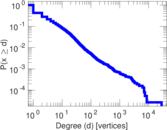
| Maximum degree | dmax = | 28,101
|
| Maximum left degree | d1max = | 28,101
|
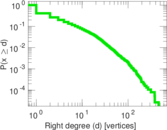
| Maximum right degree | d2max = | 462
|
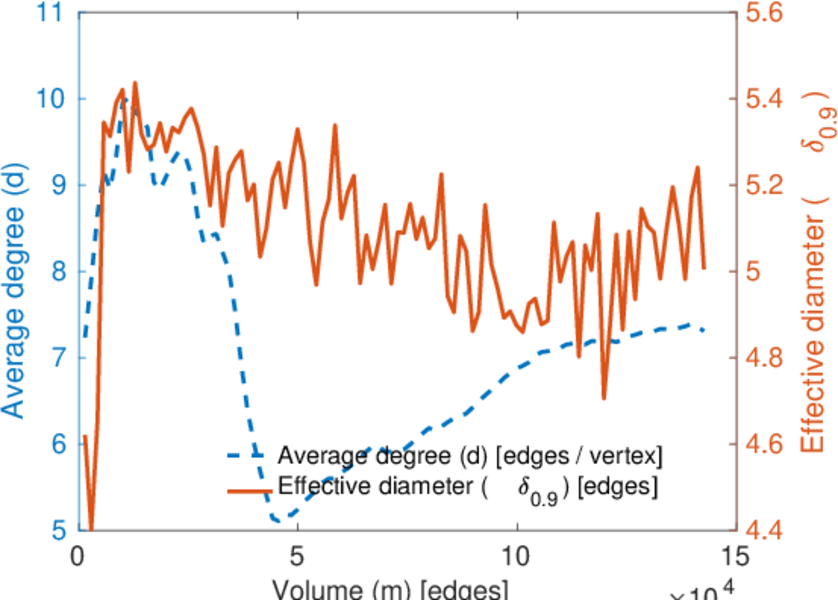
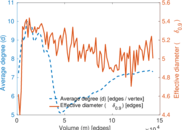
| Average degree | d = | 7.263 24
|
| Average left degree | d1 = | 81.714 6
|
| Average right degree | d2 = | 3.800 53
|
| Fill | p = | 0.001 089 77
|
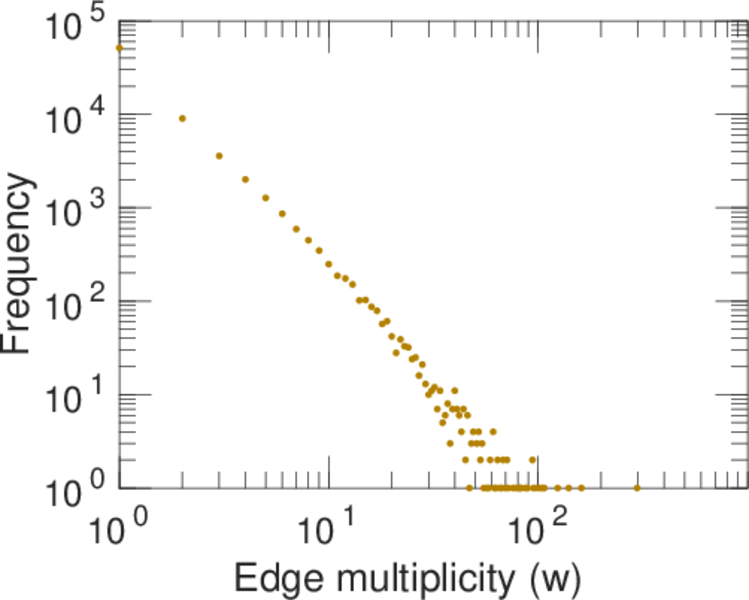
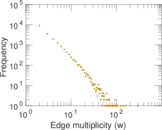
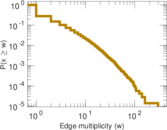
| Average edge multiplicity | m̃ = | 1.998 54
|
| Size of LCC | N = | 38,189
|
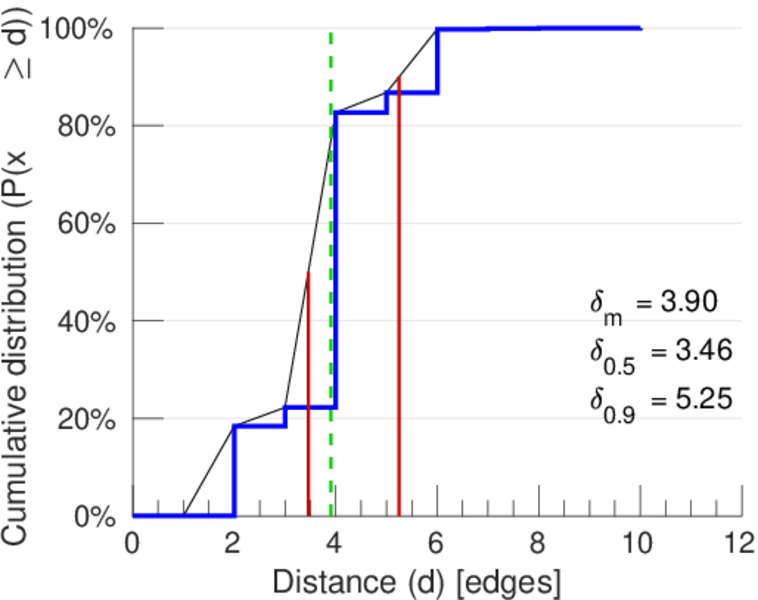
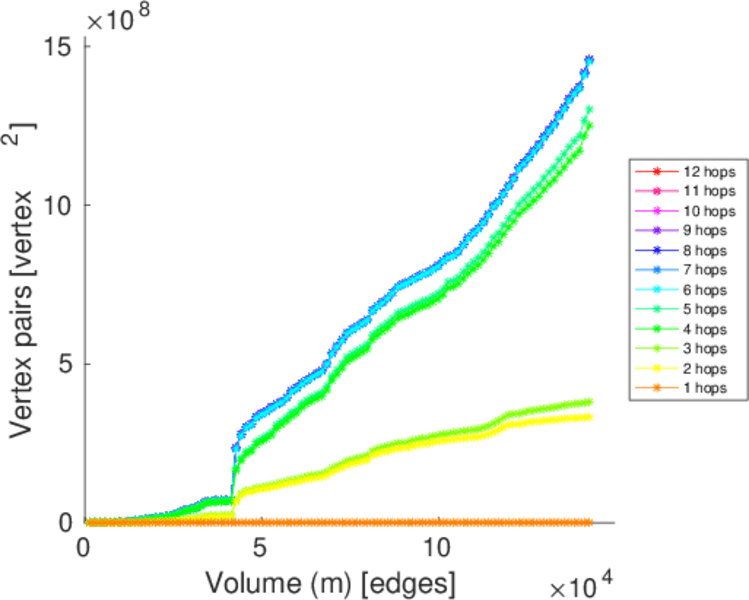
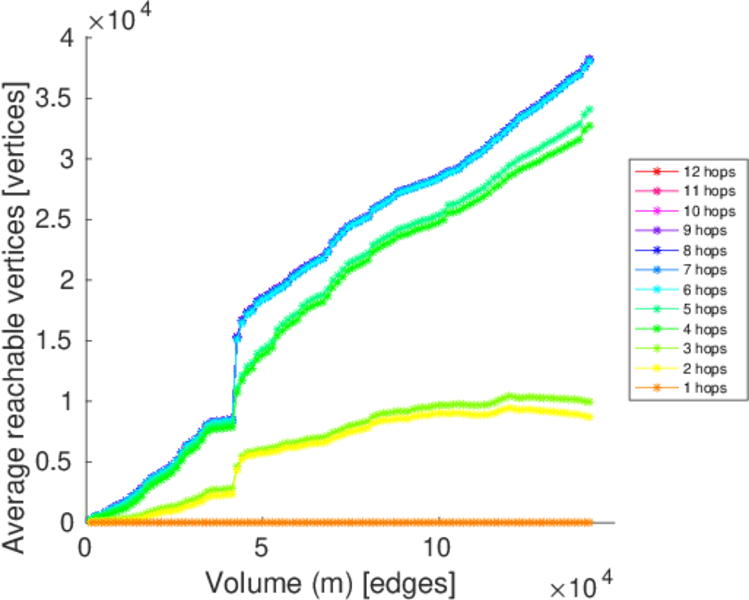
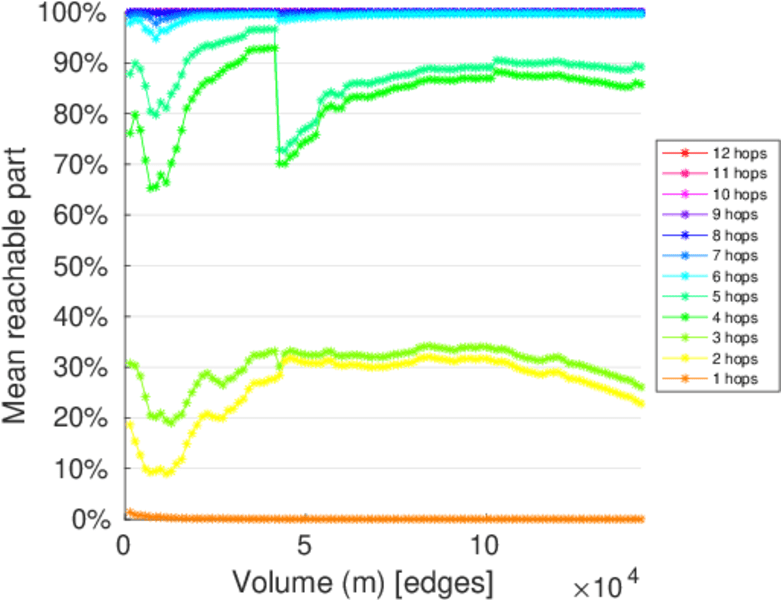
| Diameter | δ = | 12
|
| 50-Percentile effective diameter | δ0.5 = | 3.459 32
|
| 90-Percentile effective diameter | δ0.9 = | 5.249 10
|
| Median distance | δM = | 4
|
| Mean distance | δm = | 3.902 22
|
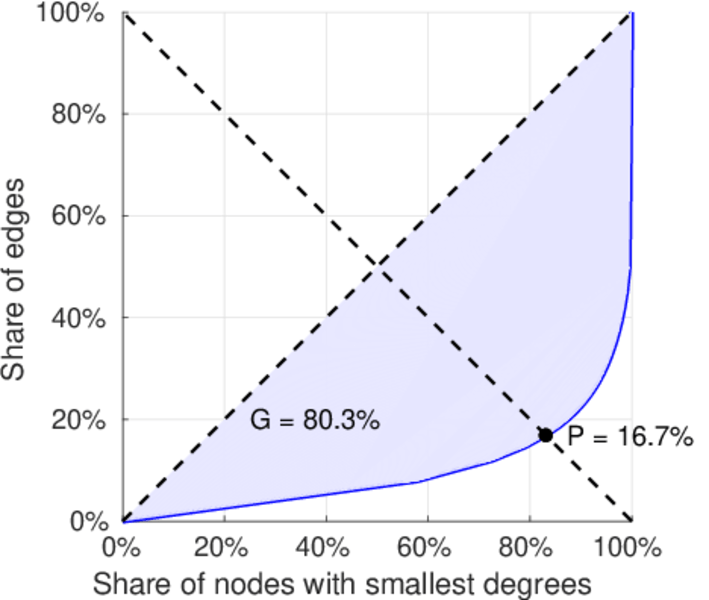
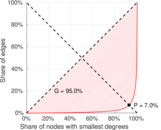
| Gini coefficient | G = | 0.808 674
|
| Balanced inequality ratio | P = | 0.163 217
|
| Left balanced inequality ratio | P1 = | 0.069 863 7
|
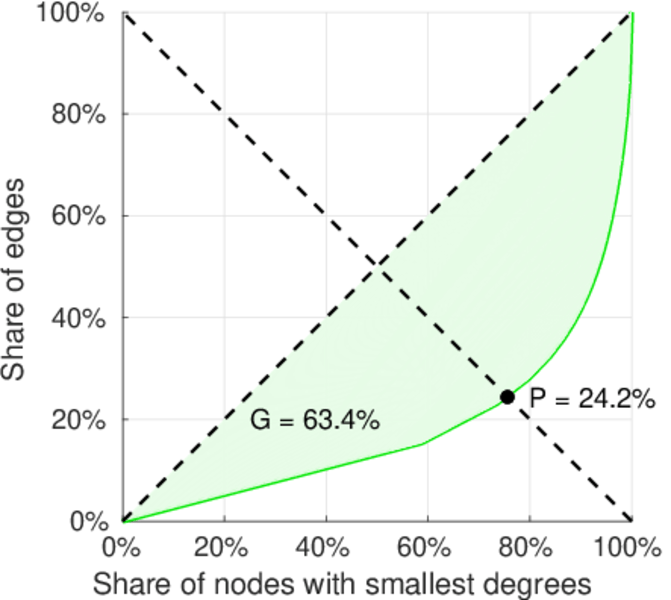
| Right balanced inequality ratio | P2 = | 0.242 412
|
| Relative edge distribution entropy | Her = | 0.729 184
|
| Power law exponent | γ = | 3.578 24
|
| Tail power law exponent | γt = | 2.461 00
|
| Tail power law exponent with p | γ3 = | 2.461 00
|
| p-value | p = | 0.000 00
|
| Left tail power law exponent with p | γ3,1 = | 1.701 00
|
| Left p-value | p1 = | 0.000 00
|
| Right tail power law exponent with p | γ3,2 = | 2.601 00
|
| Right p-value | p2 = | 0.000 00
|
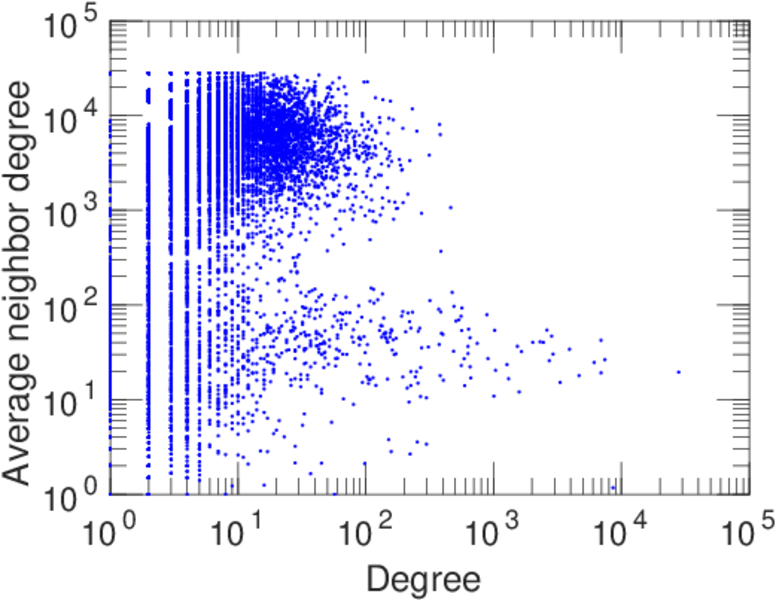
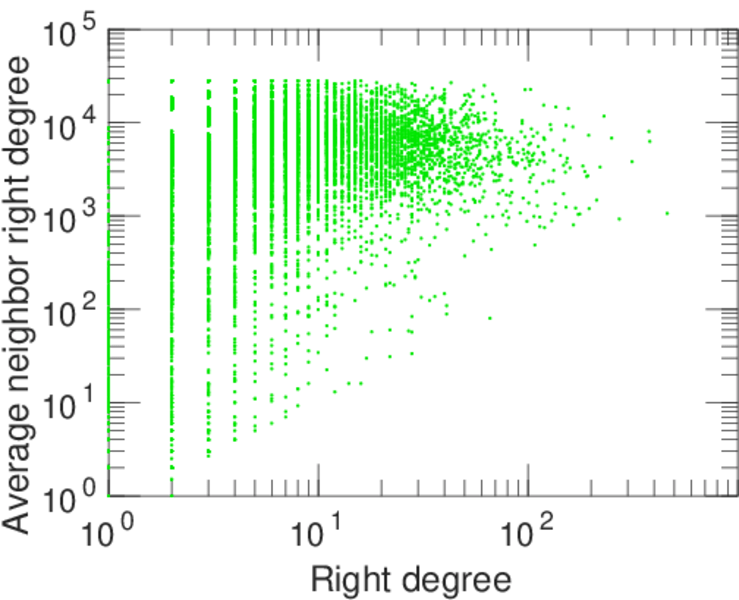
| Degree assortativity | ρ = | −0.287 331
|
| Degree assortativity p-value | pρ = | 0.000 00
|
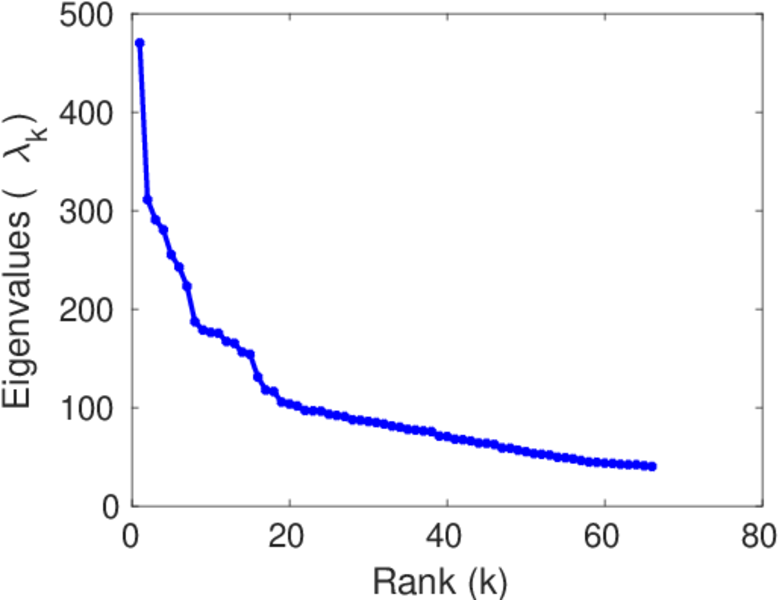
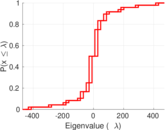
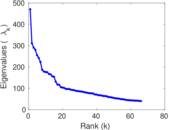
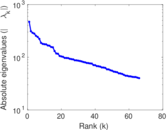
| Spectral norm | α = | 470.285
|
| Algebraic connectivity | a = | 0.034 675 0
|
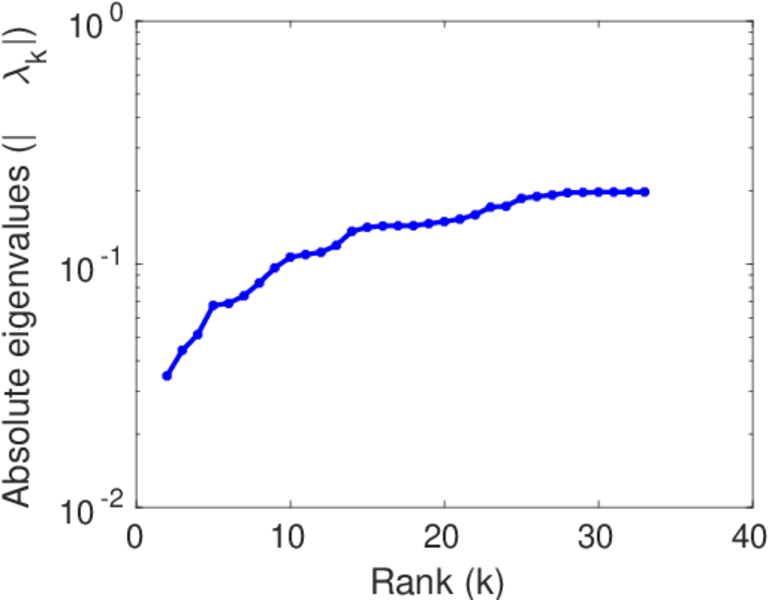
| Spectral separation | |λ1[A] / λ2[A]| = | 1.510 81
|
| Controllability | C = | 35,809
|
| Relative controllability | Cr = | 0.917 638
|
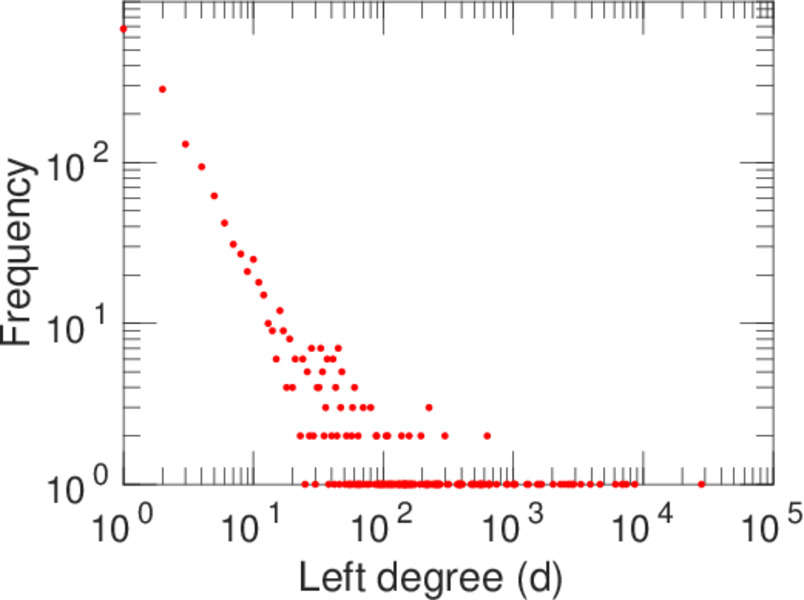
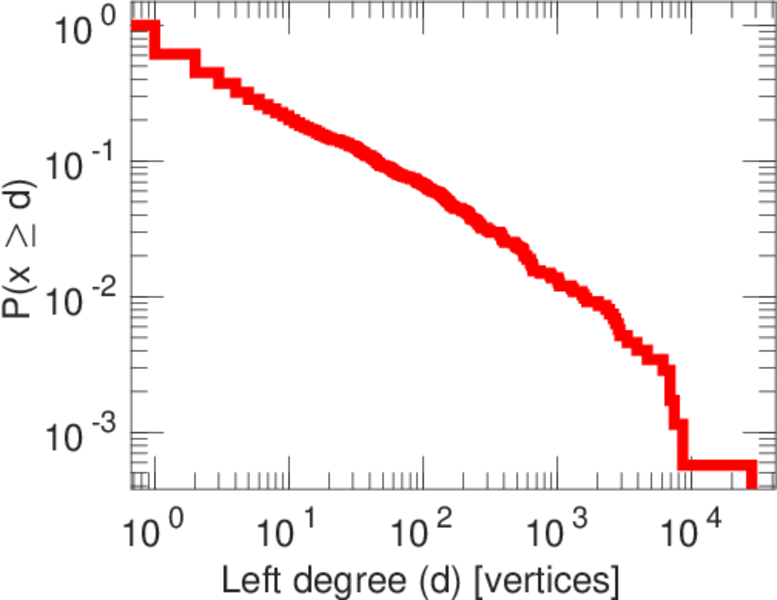
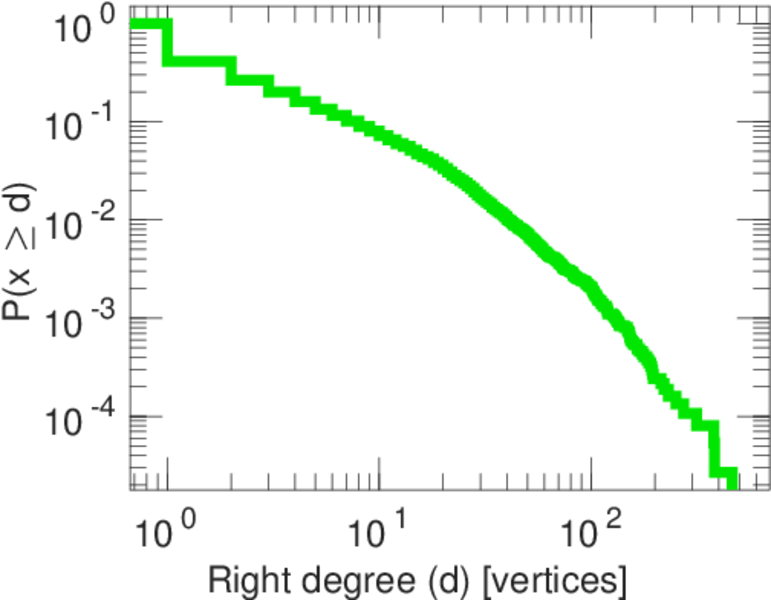
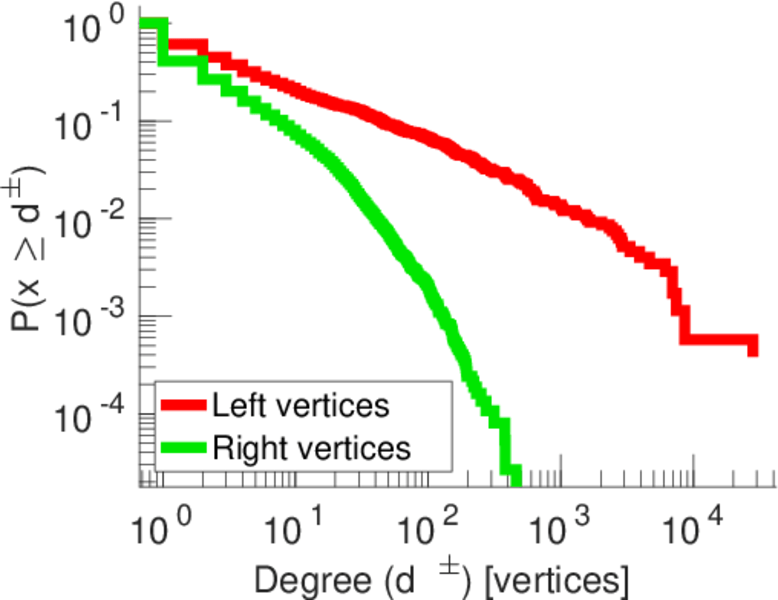
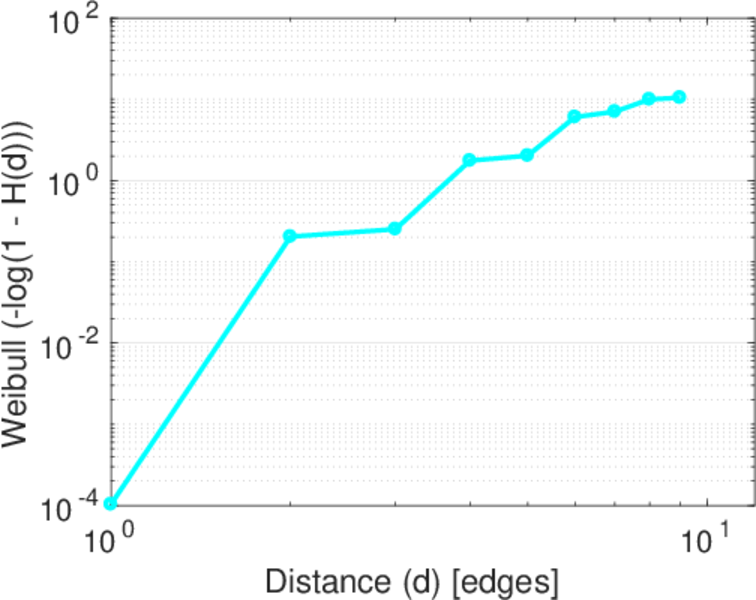
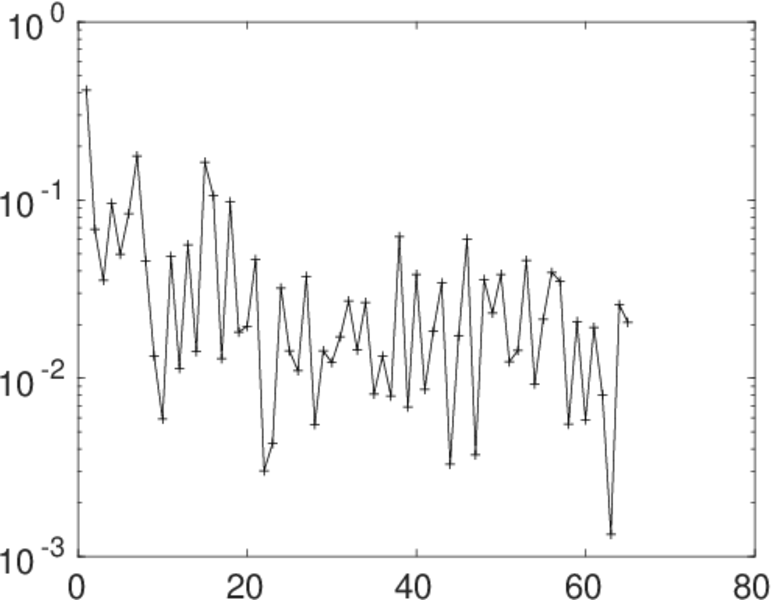
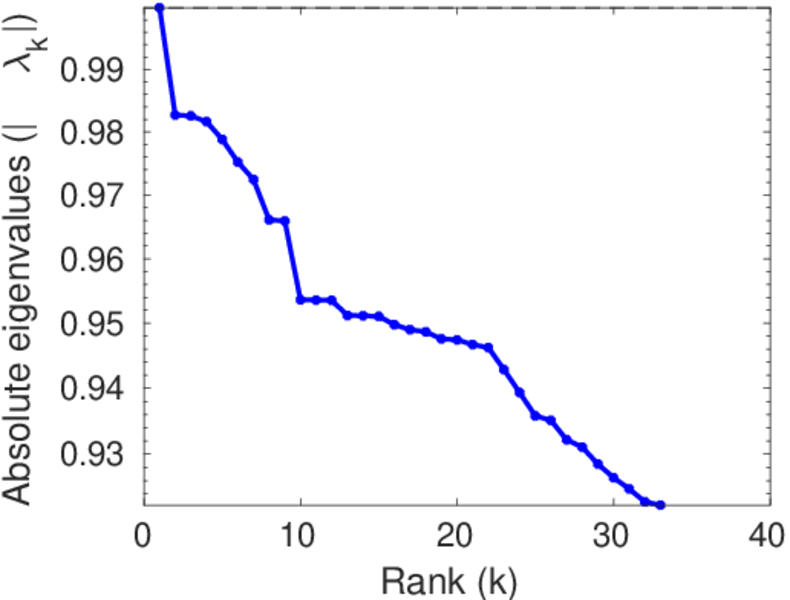
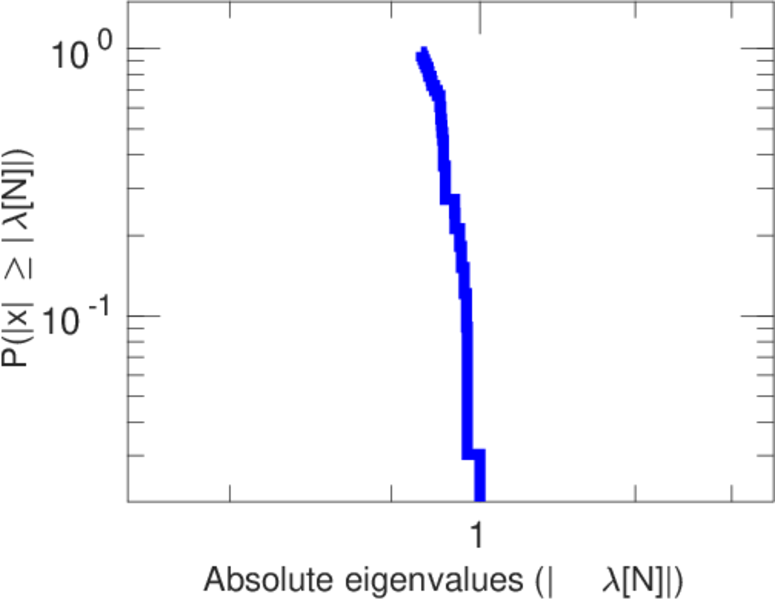
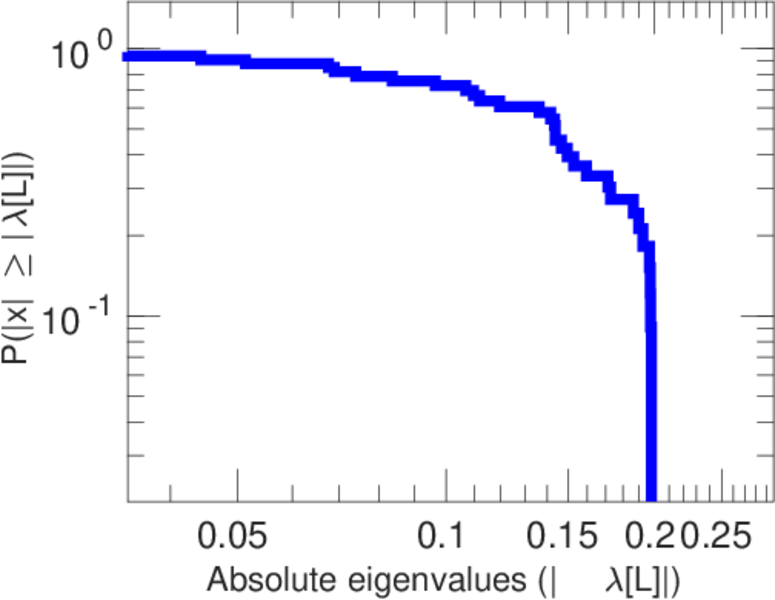
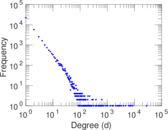
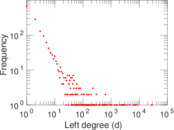
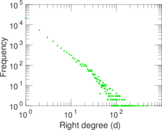
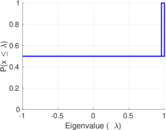
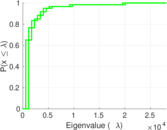
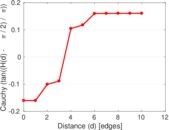
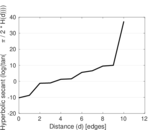
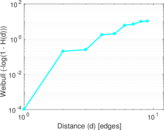
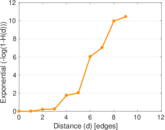
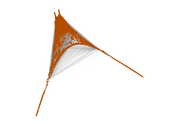
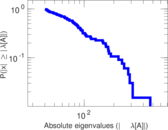
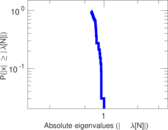
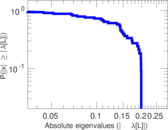
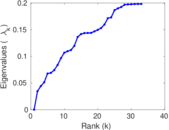
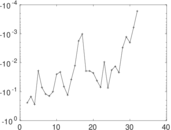
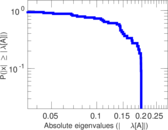
Plots


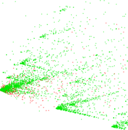
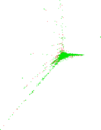


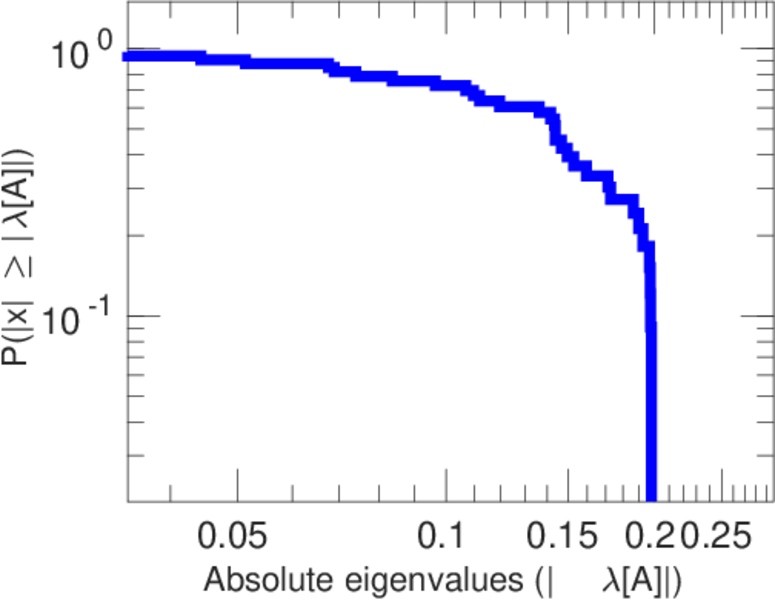
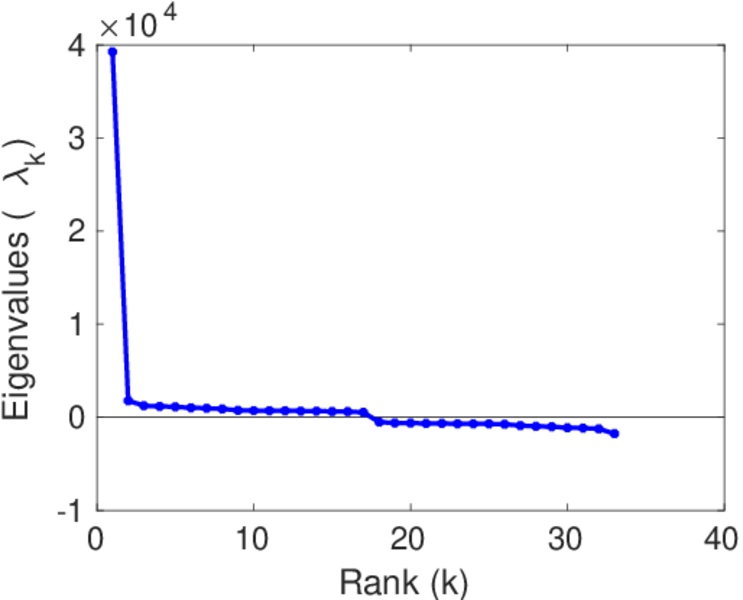
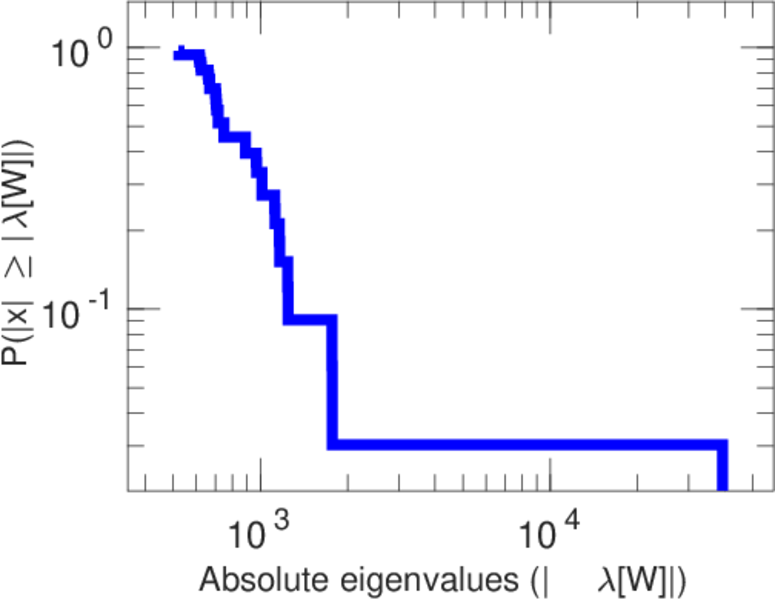
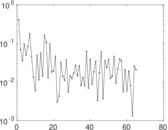
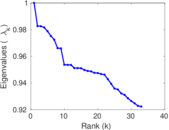
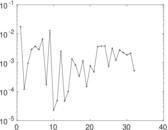
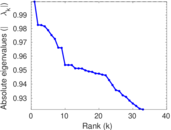
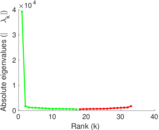
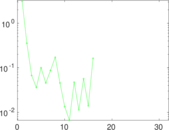
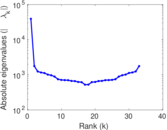
Matrix decompositions plots


Downloads
References
|
[1]
|
Jérôme Kunegis.
KONECT – The Koblenz Network Collection.
In Proc. Int. Conf. on World Wide Web Companion, pages
1343–1350, 2013.
[ http ]
|
|
[2]
|
Wikimedia Foundation.
Wikimedia downloads.
http://dumps.wikimedia.org/, January 2010.
|
 KONECT ‣ Networks ‣
Buy Me a Coffee
KONECT ‣ Networks ‣
Buy Me a Coffee