Wikipedia edits (atj)
This is the bipartite edit network of the Atikamekw Wikipedia. It contains
users and pages from the Atikamekw Wikipedia, connected by edit events. Each
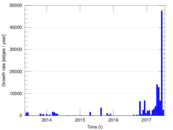
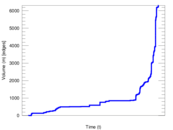
edge represents an edit. The dataset includes the timestamp of each edit.
Metadata
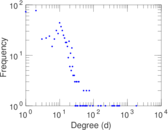
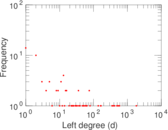
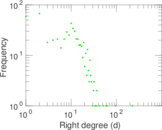
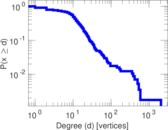
Statistics
| Size | n = | 655
|
| Left size | n1 = | 83
|
| Right size | n2 = | 572
|
| Volume | m = | 6,306
|
| Unique edge count | m̿ = | 3,266
|
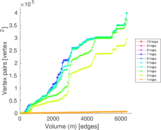
| Wedge count | s = | 459,277
|
| Claw count | z = | 58,368,889
|
| Cross count | x = | 6,181,474,537
|
| Square count | q = | 772,689
|
| 4-Tour count | T4 = | 8,030,876
|
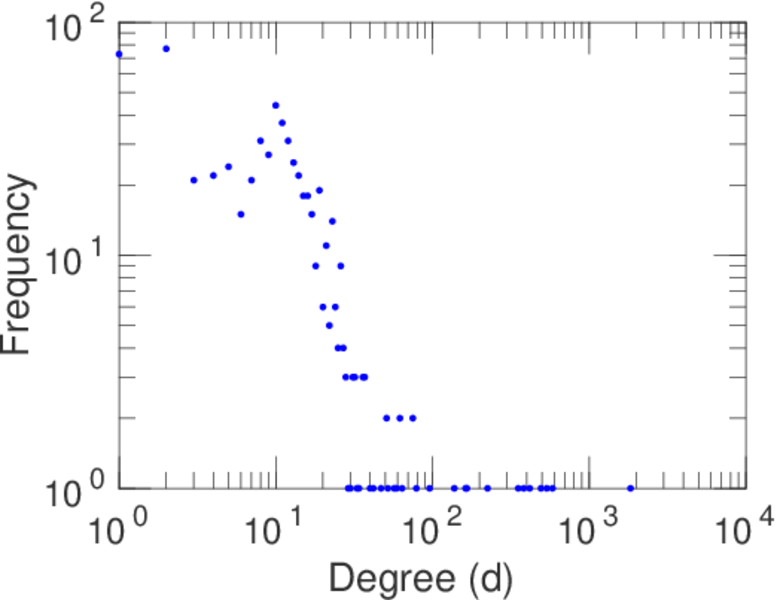
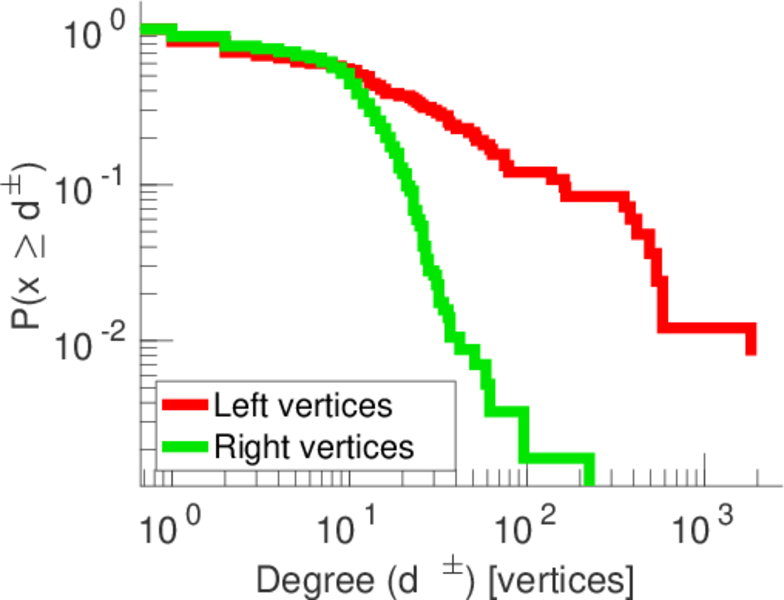
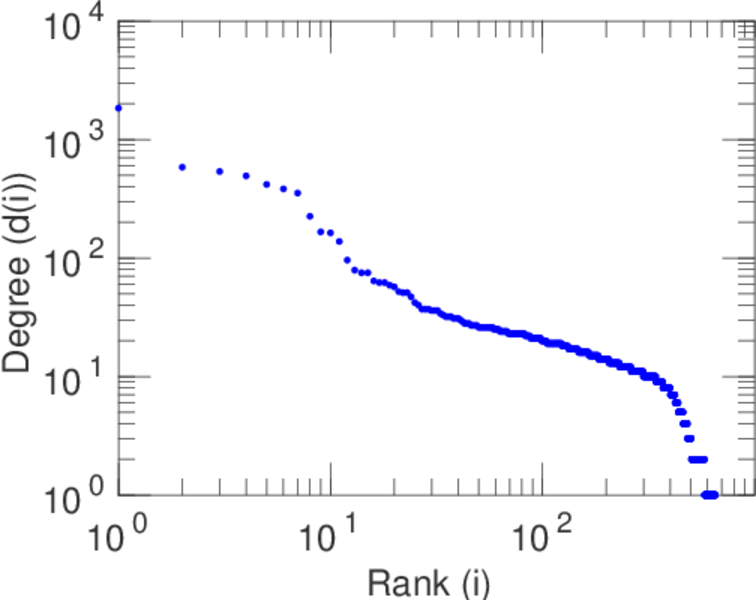
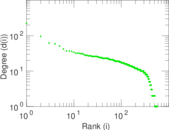
| Maximum degree | dmax = | 1,839
|
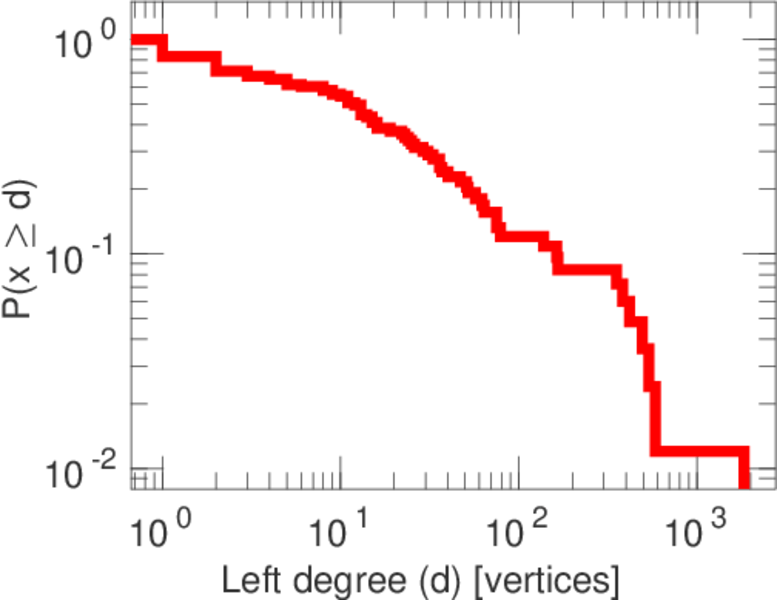
| Maximum left degree | d1max = | 1,839
|
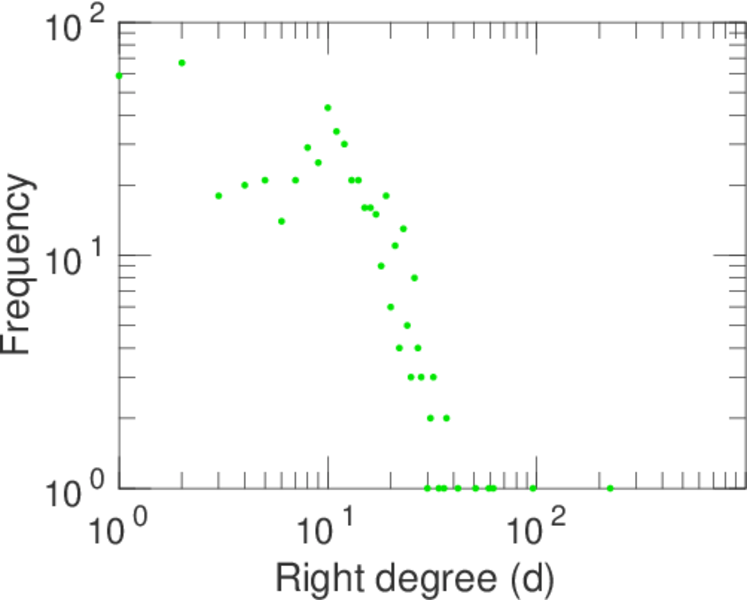
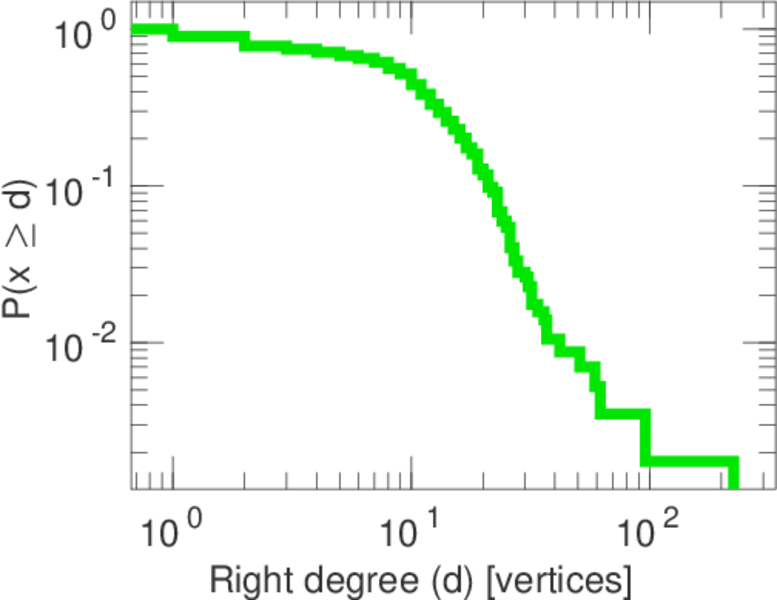
| Maximum right degree | d2max = | 225
|
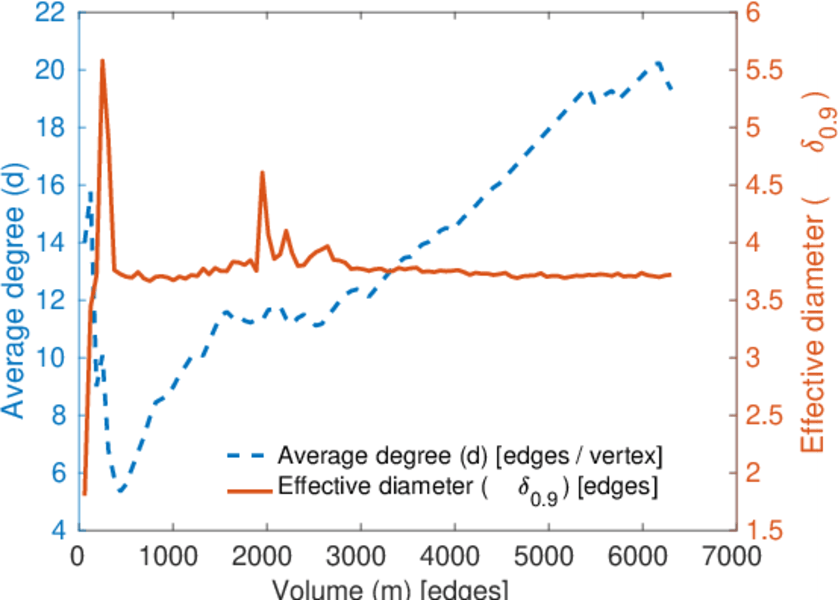
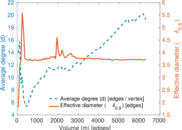
| Average degree | d = | 19.255 0
|
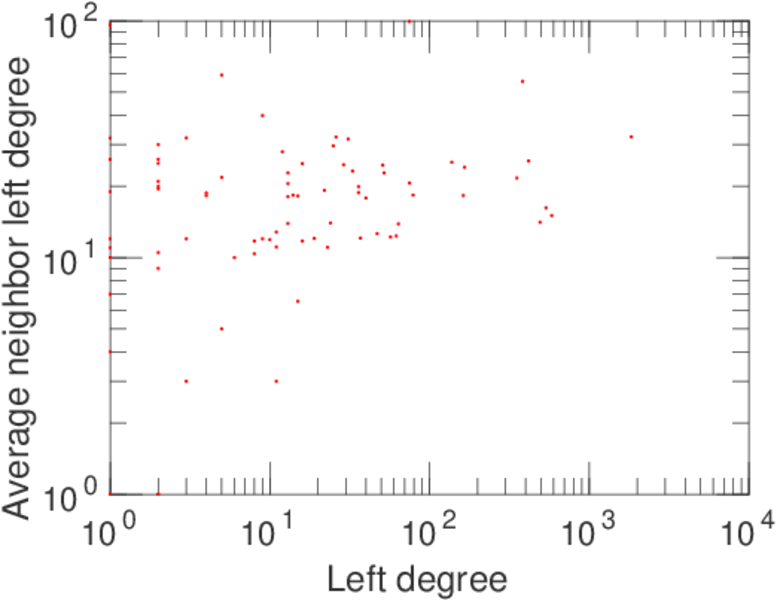
| Average left degree | d1 = | 75.975 9
|
| Average right degree | d2 = | 11.024 5
|
| Fill | p = | 0.068 792 7
|
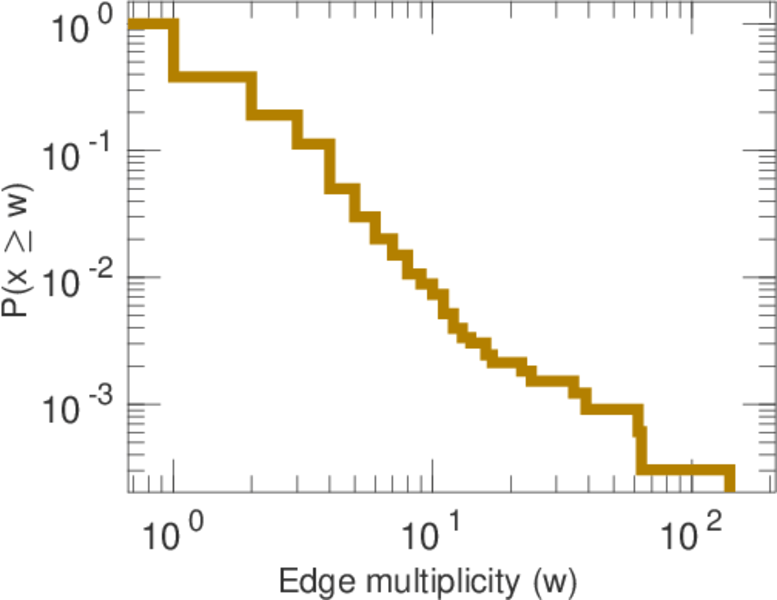
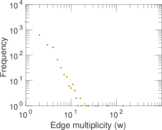
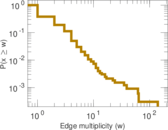
| Average edge multiplicity | m̃ = | 1.930 80
|
| Size of LCC | N = | 632
|
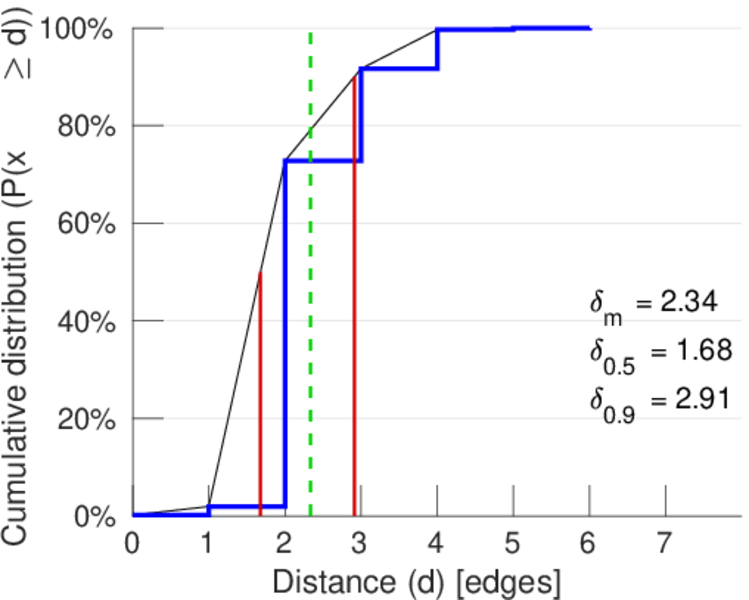
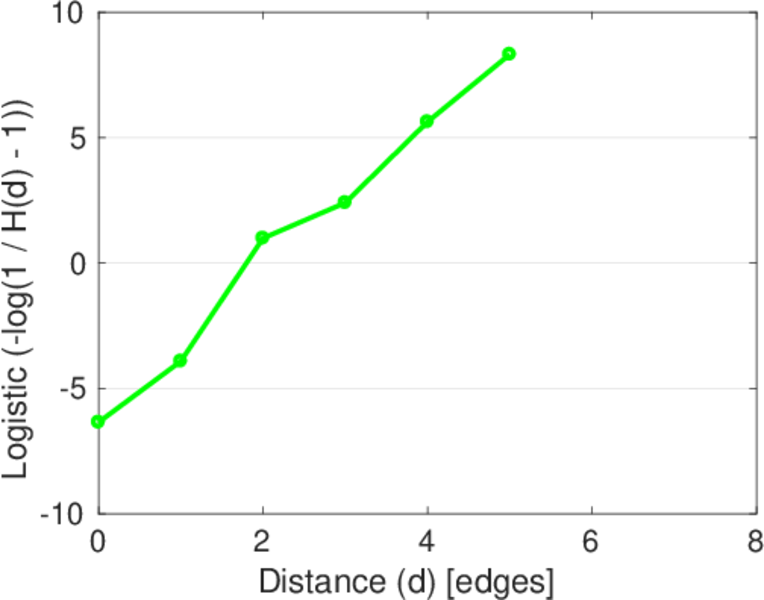
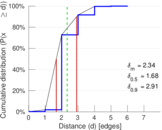
| Diameter | δ = | 6
|
| 50-Percentile effective diameter | δ0.5 = | 1.678 76
|
| 90-Percentile effective diameter | δ0.9 = | 2.912 90
|
| Median distance | δM = | 2
|
| Mean distance | δm = | 2.338 84
|
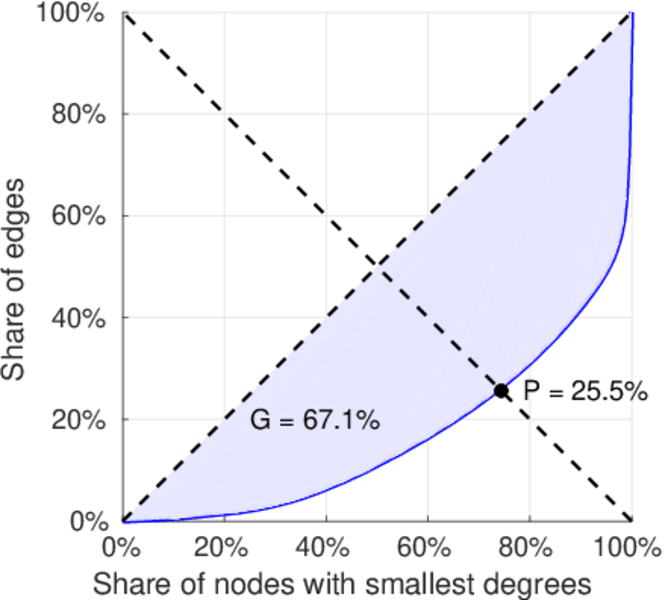
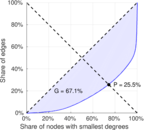
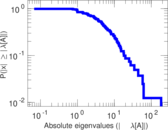
| Gini coefficient | G = | 0.679 733
|
| Balanced inequality ratio | P = | 0.250 951
|
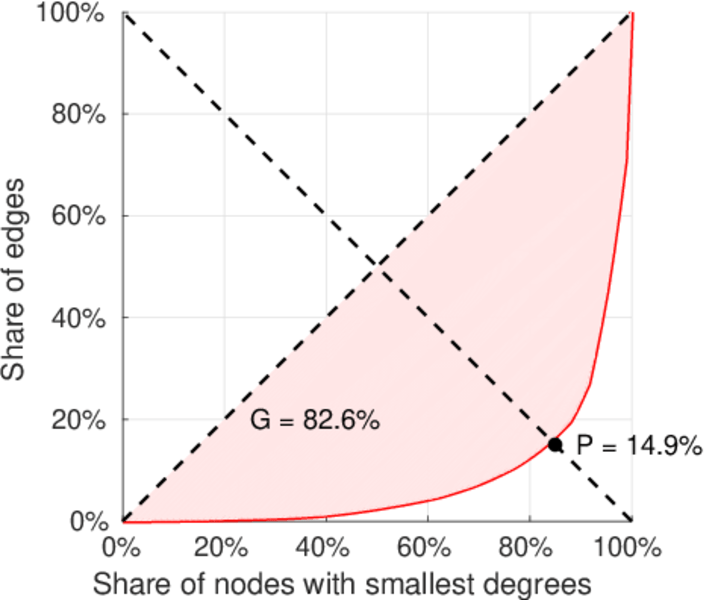
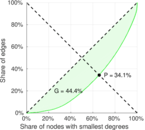
| Left balanced inequality ratio | P1 = | 0.148 906
|
| Right balanced inequality ratio | P2 = | 0.341 262
|
| Relative edge distribution entropy | Her = | 0.809 390
|
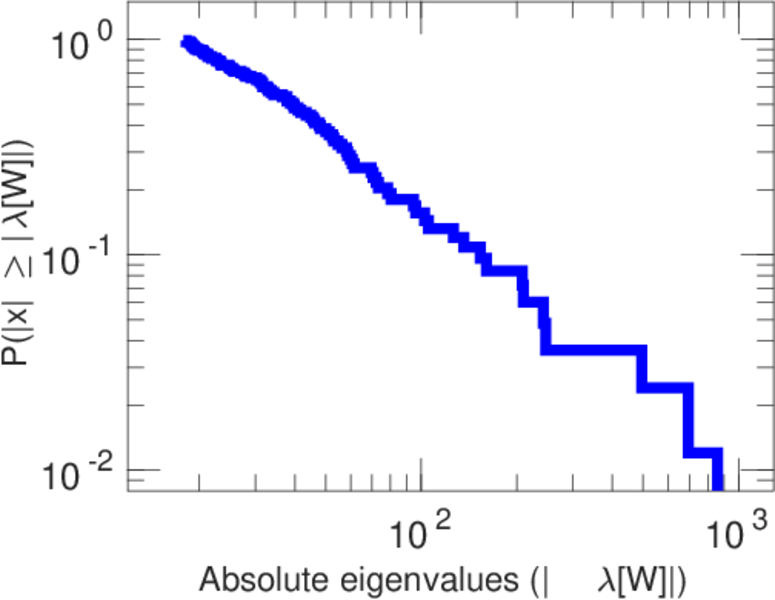
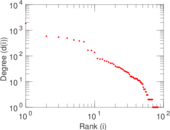
| Power law exponent | γ = | 1.650 41
|
| Tail power law exponent | γt = | 2.551 00
|
| Tail power law exponent with p | γ3 = | 2.551 00
|
| p-value | p = | 0.000 00
|
| Left tail power law exponent with p | γ3,1 = | 1.731 00
|
| Left p-value | p1 = | 0.516 000
|
| Right tail power law exponent with p | γ3,2 = | 8.331 00
|
| Right p-value | p2 = | 0.017 000 0
|
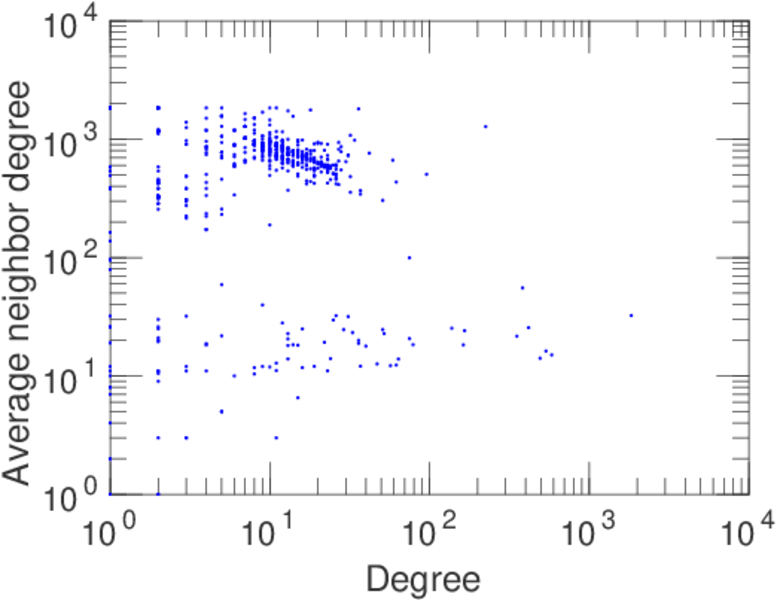
| Degree assortativity | ρ = | −0.292 854
|
| Degree assortativity p-value | pρ = | 1.332 26 × 10−65
|
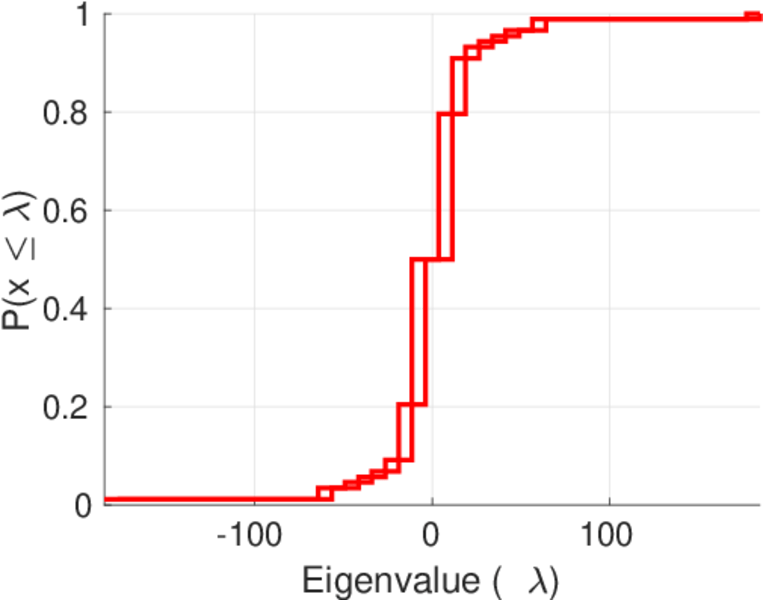
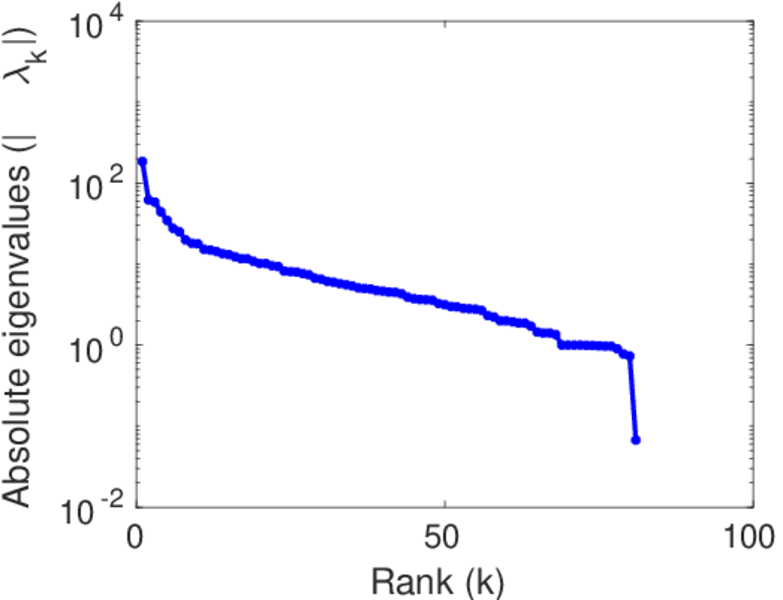
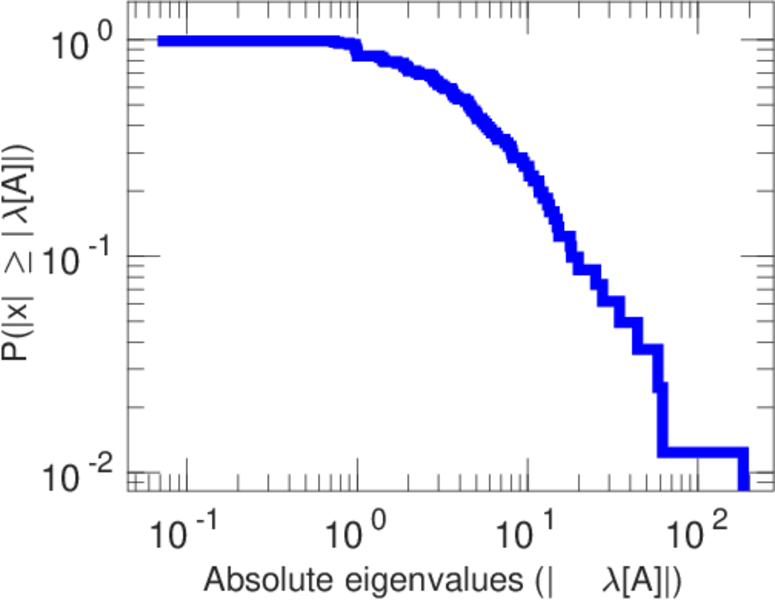
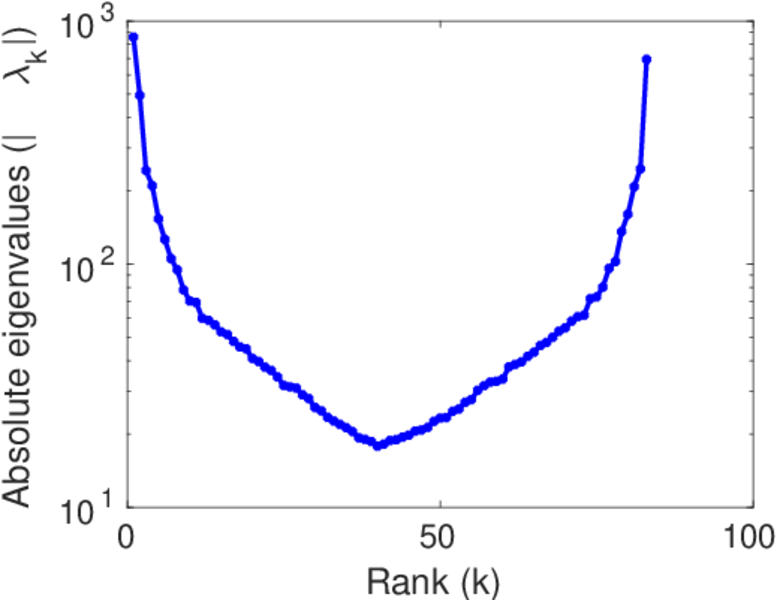
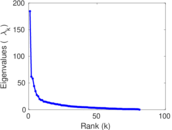
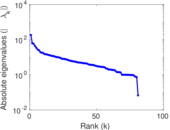
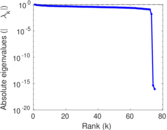
| Spectral norm | α = | 184.526
|
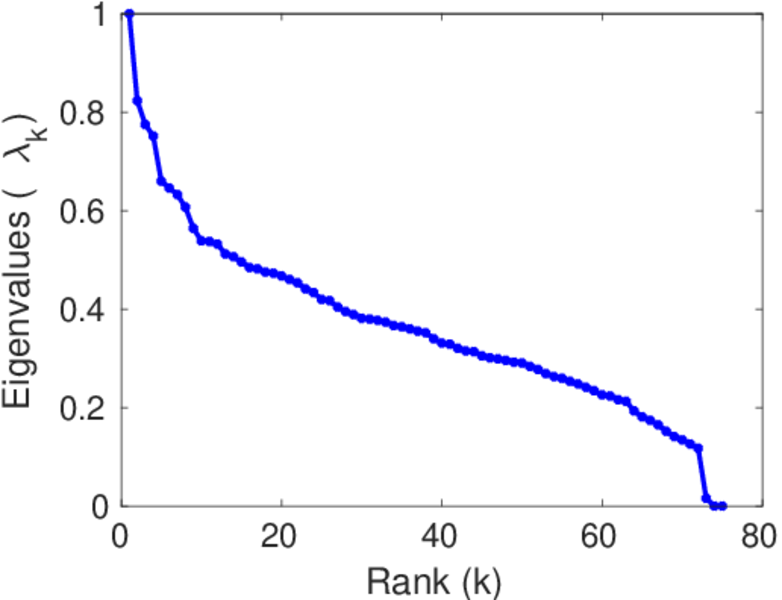
| Algebraic connectivity | a = | 0.426 775
|
| Spectral separation | |λ1[A] / λ2[A]| = | 2.980 76
|
| Controllability | C = | 491
|
| Relative controllability | Cr = | 0.751 914
|
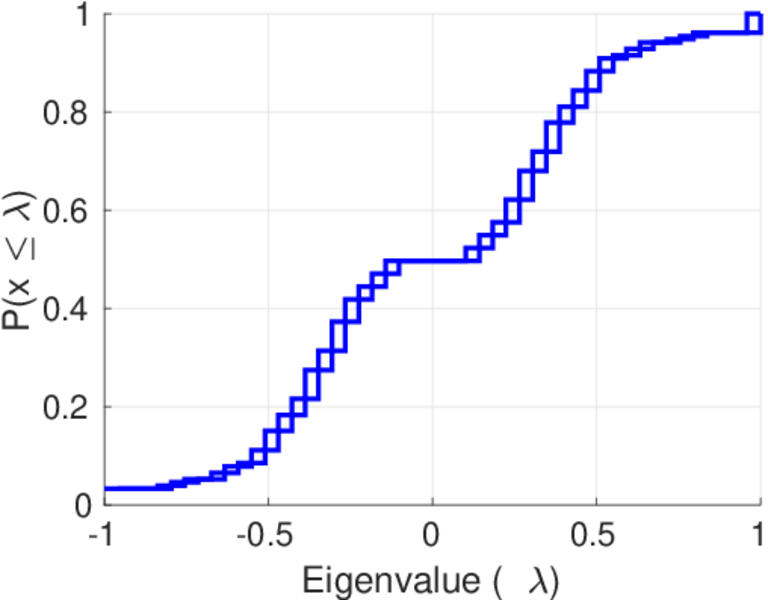
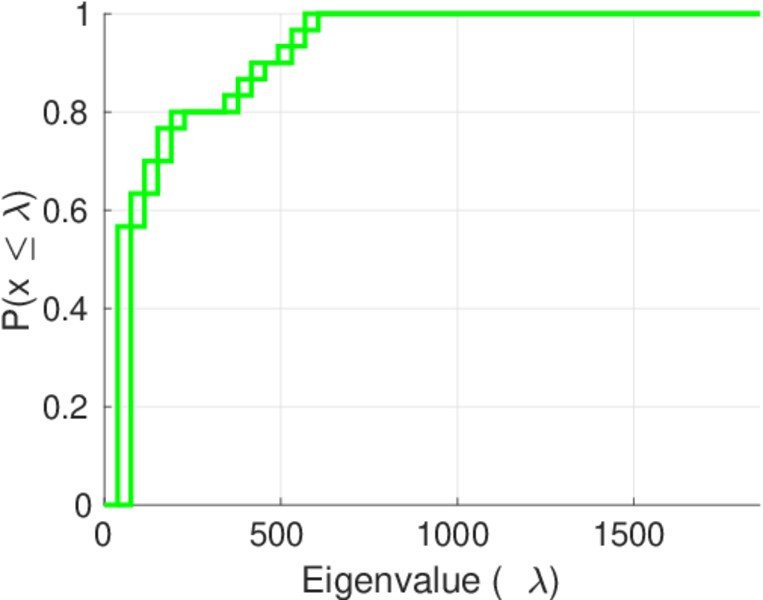
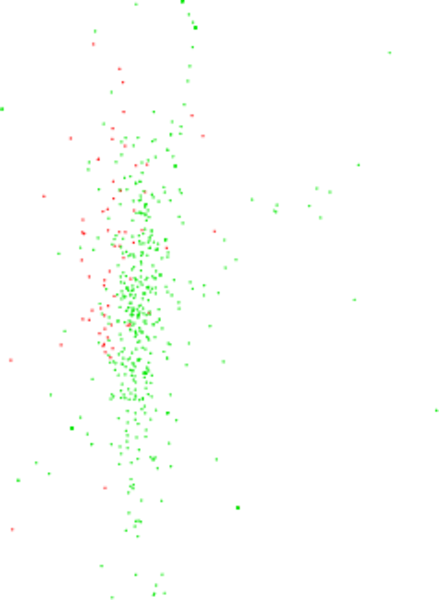
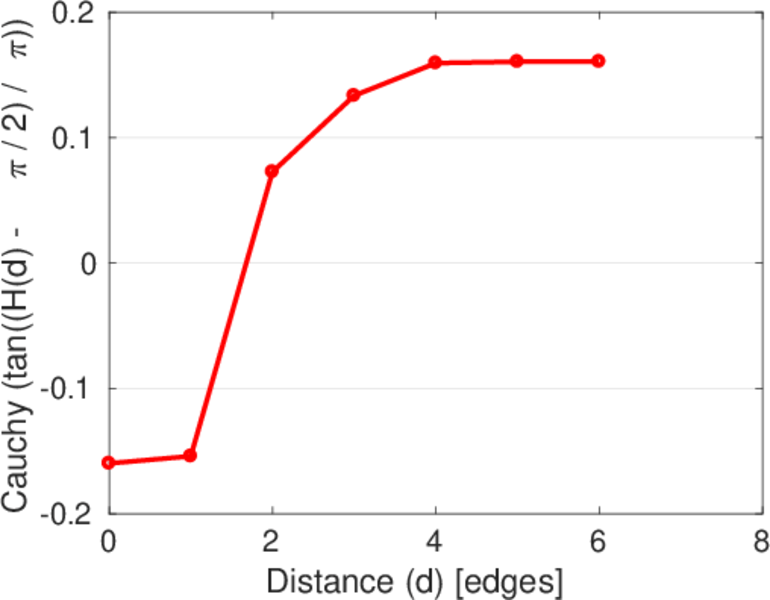
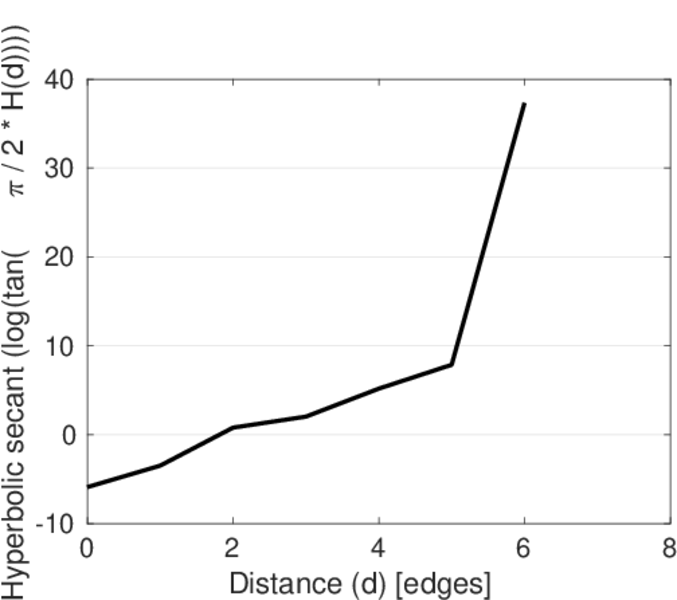
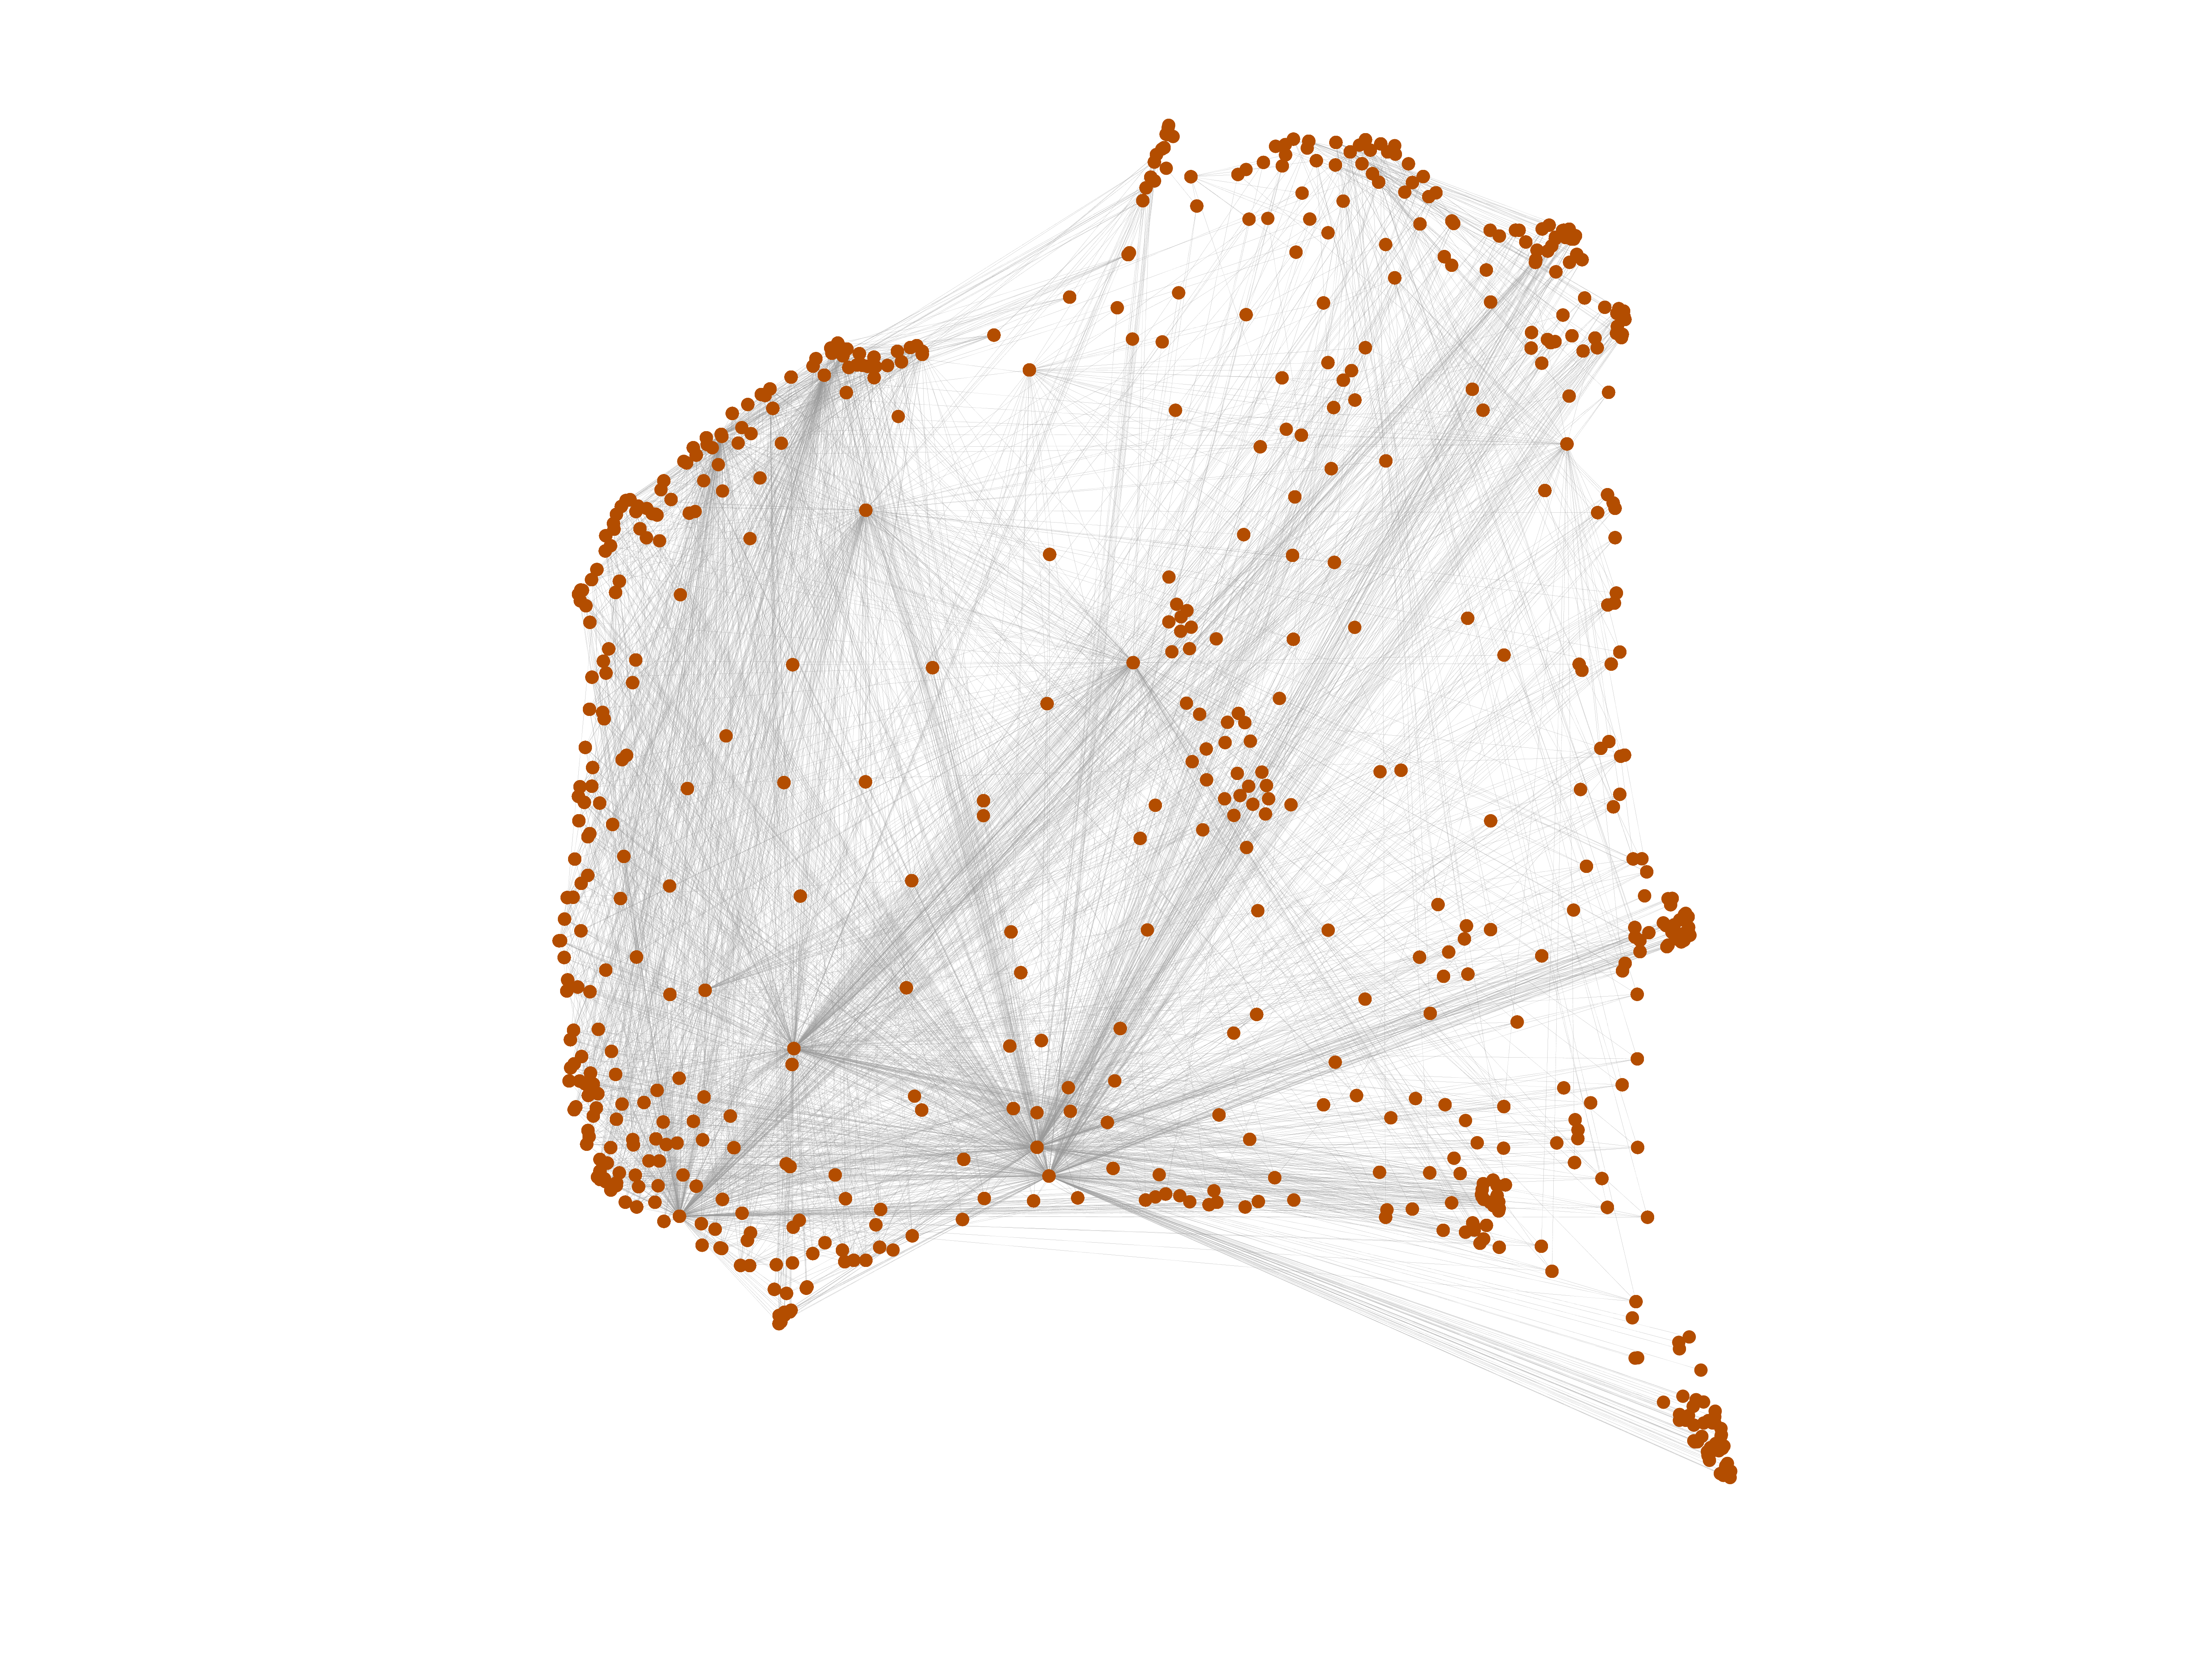
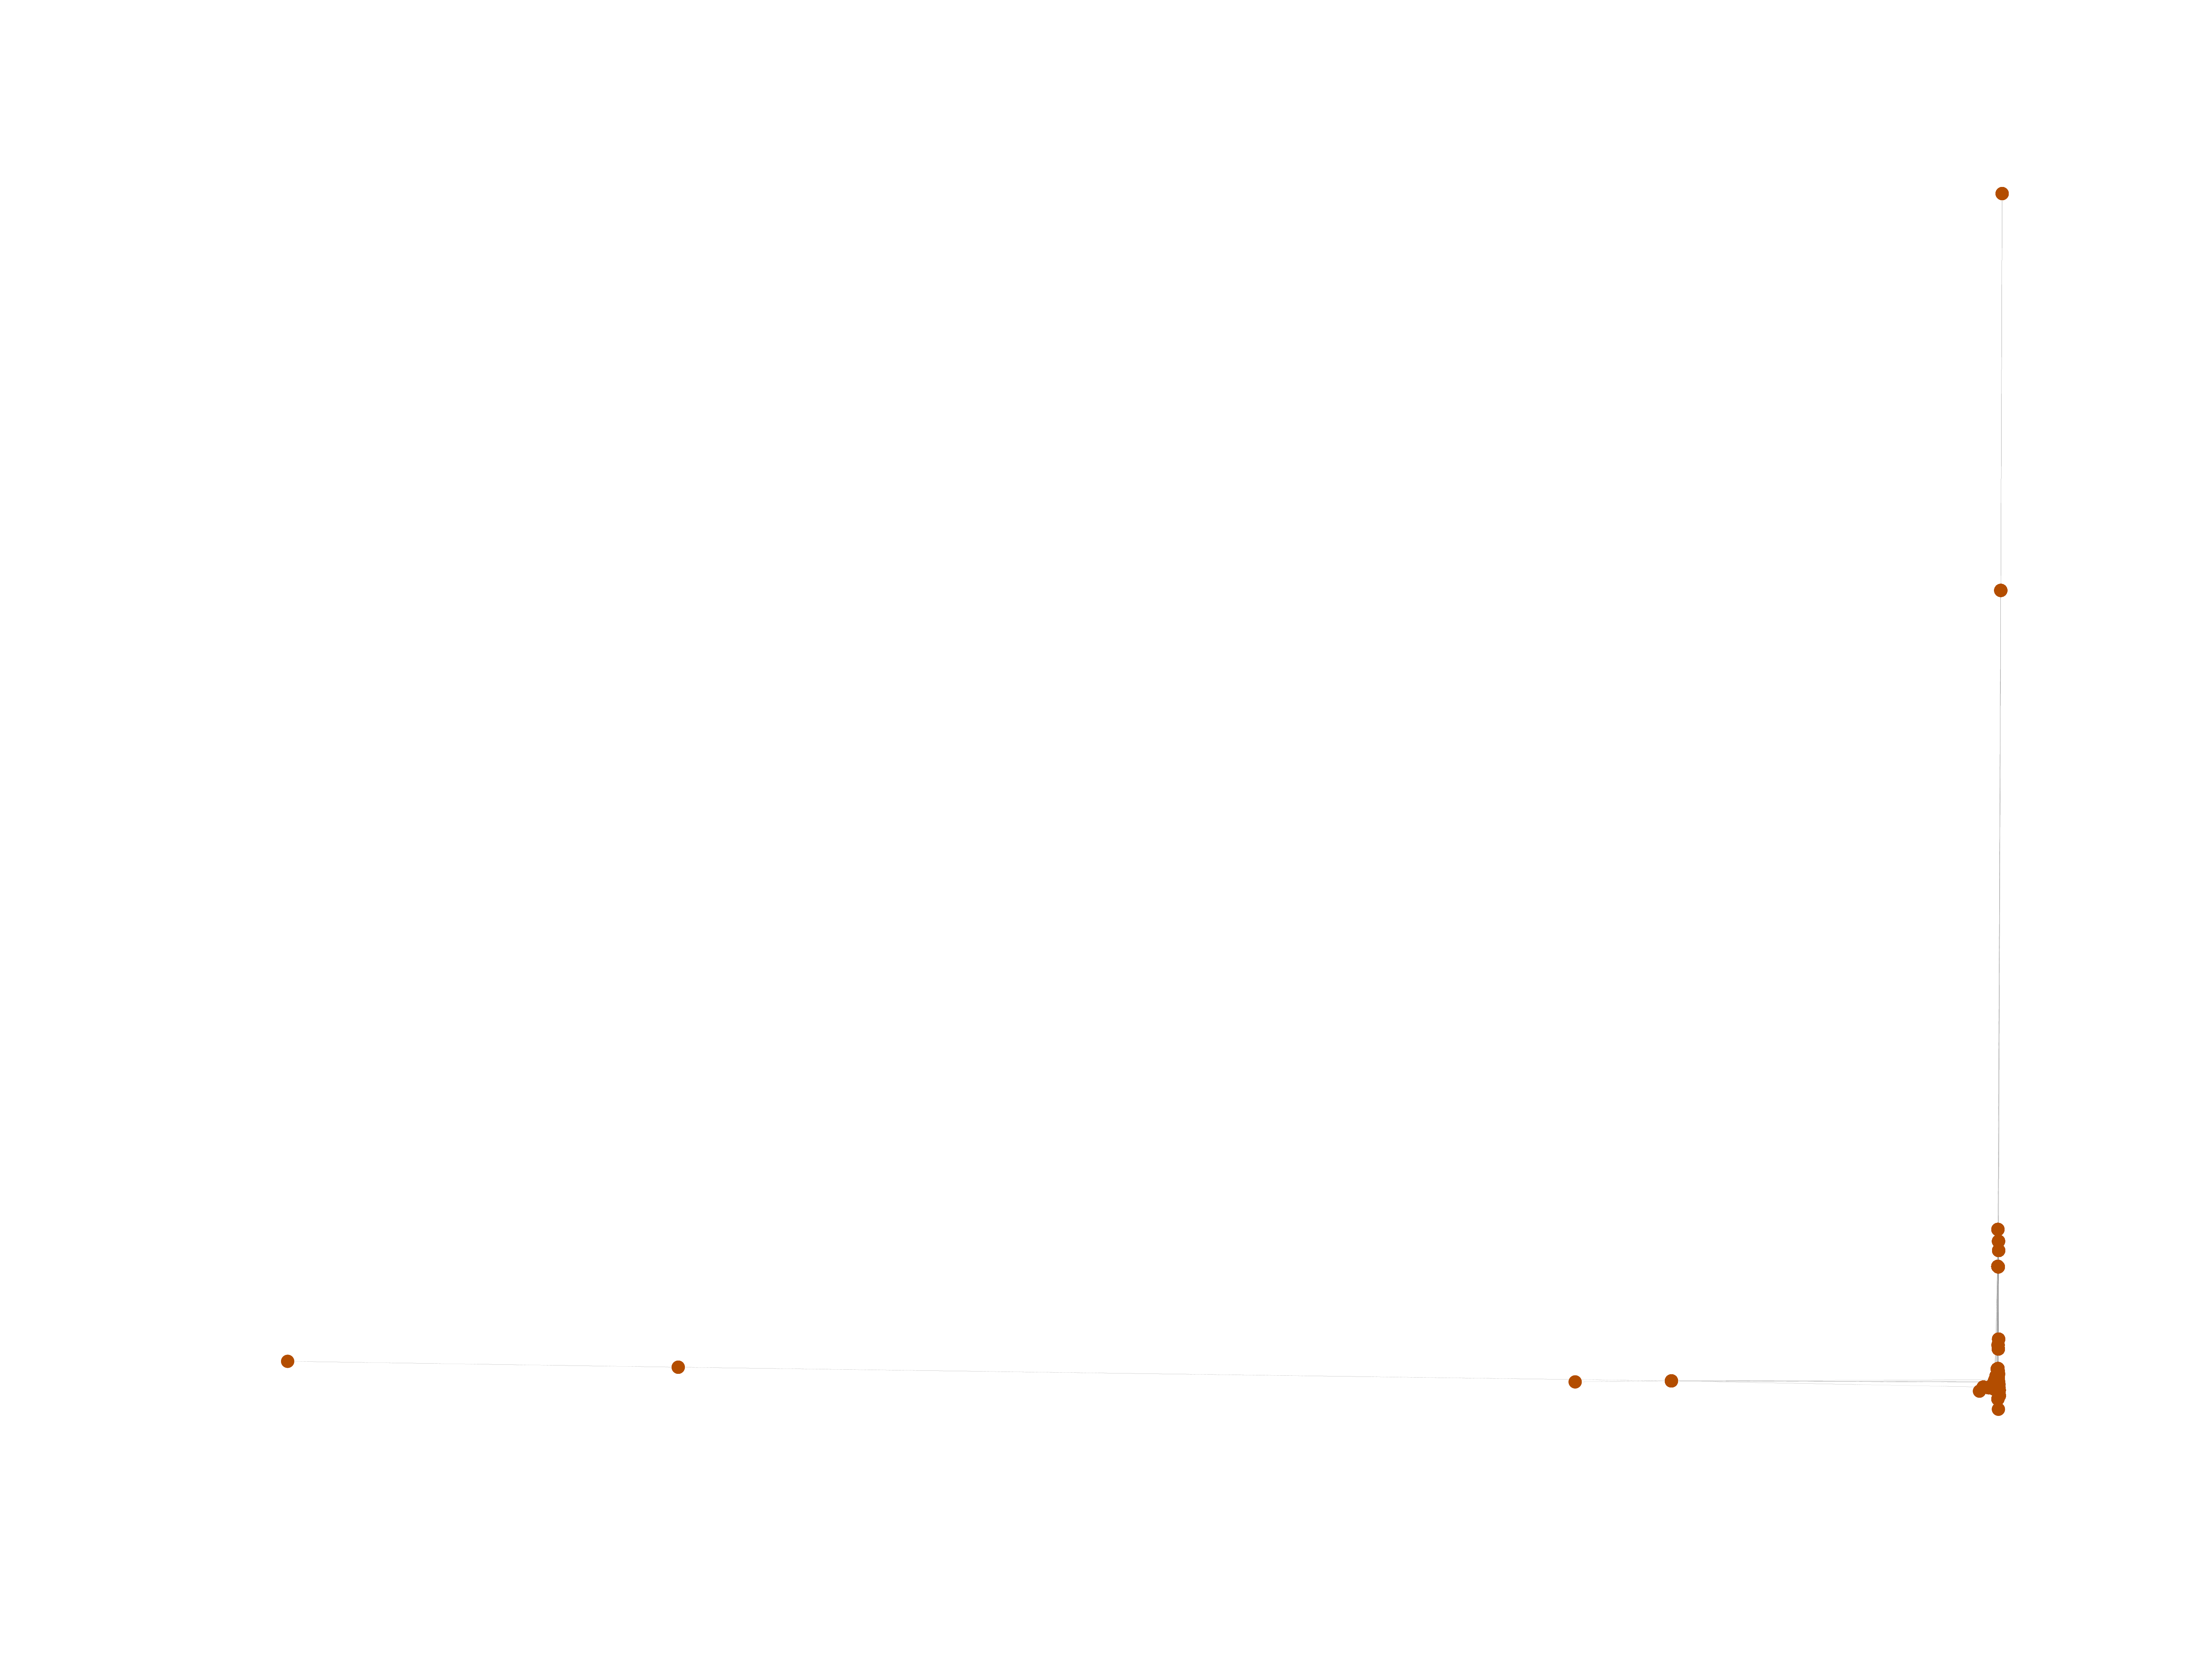
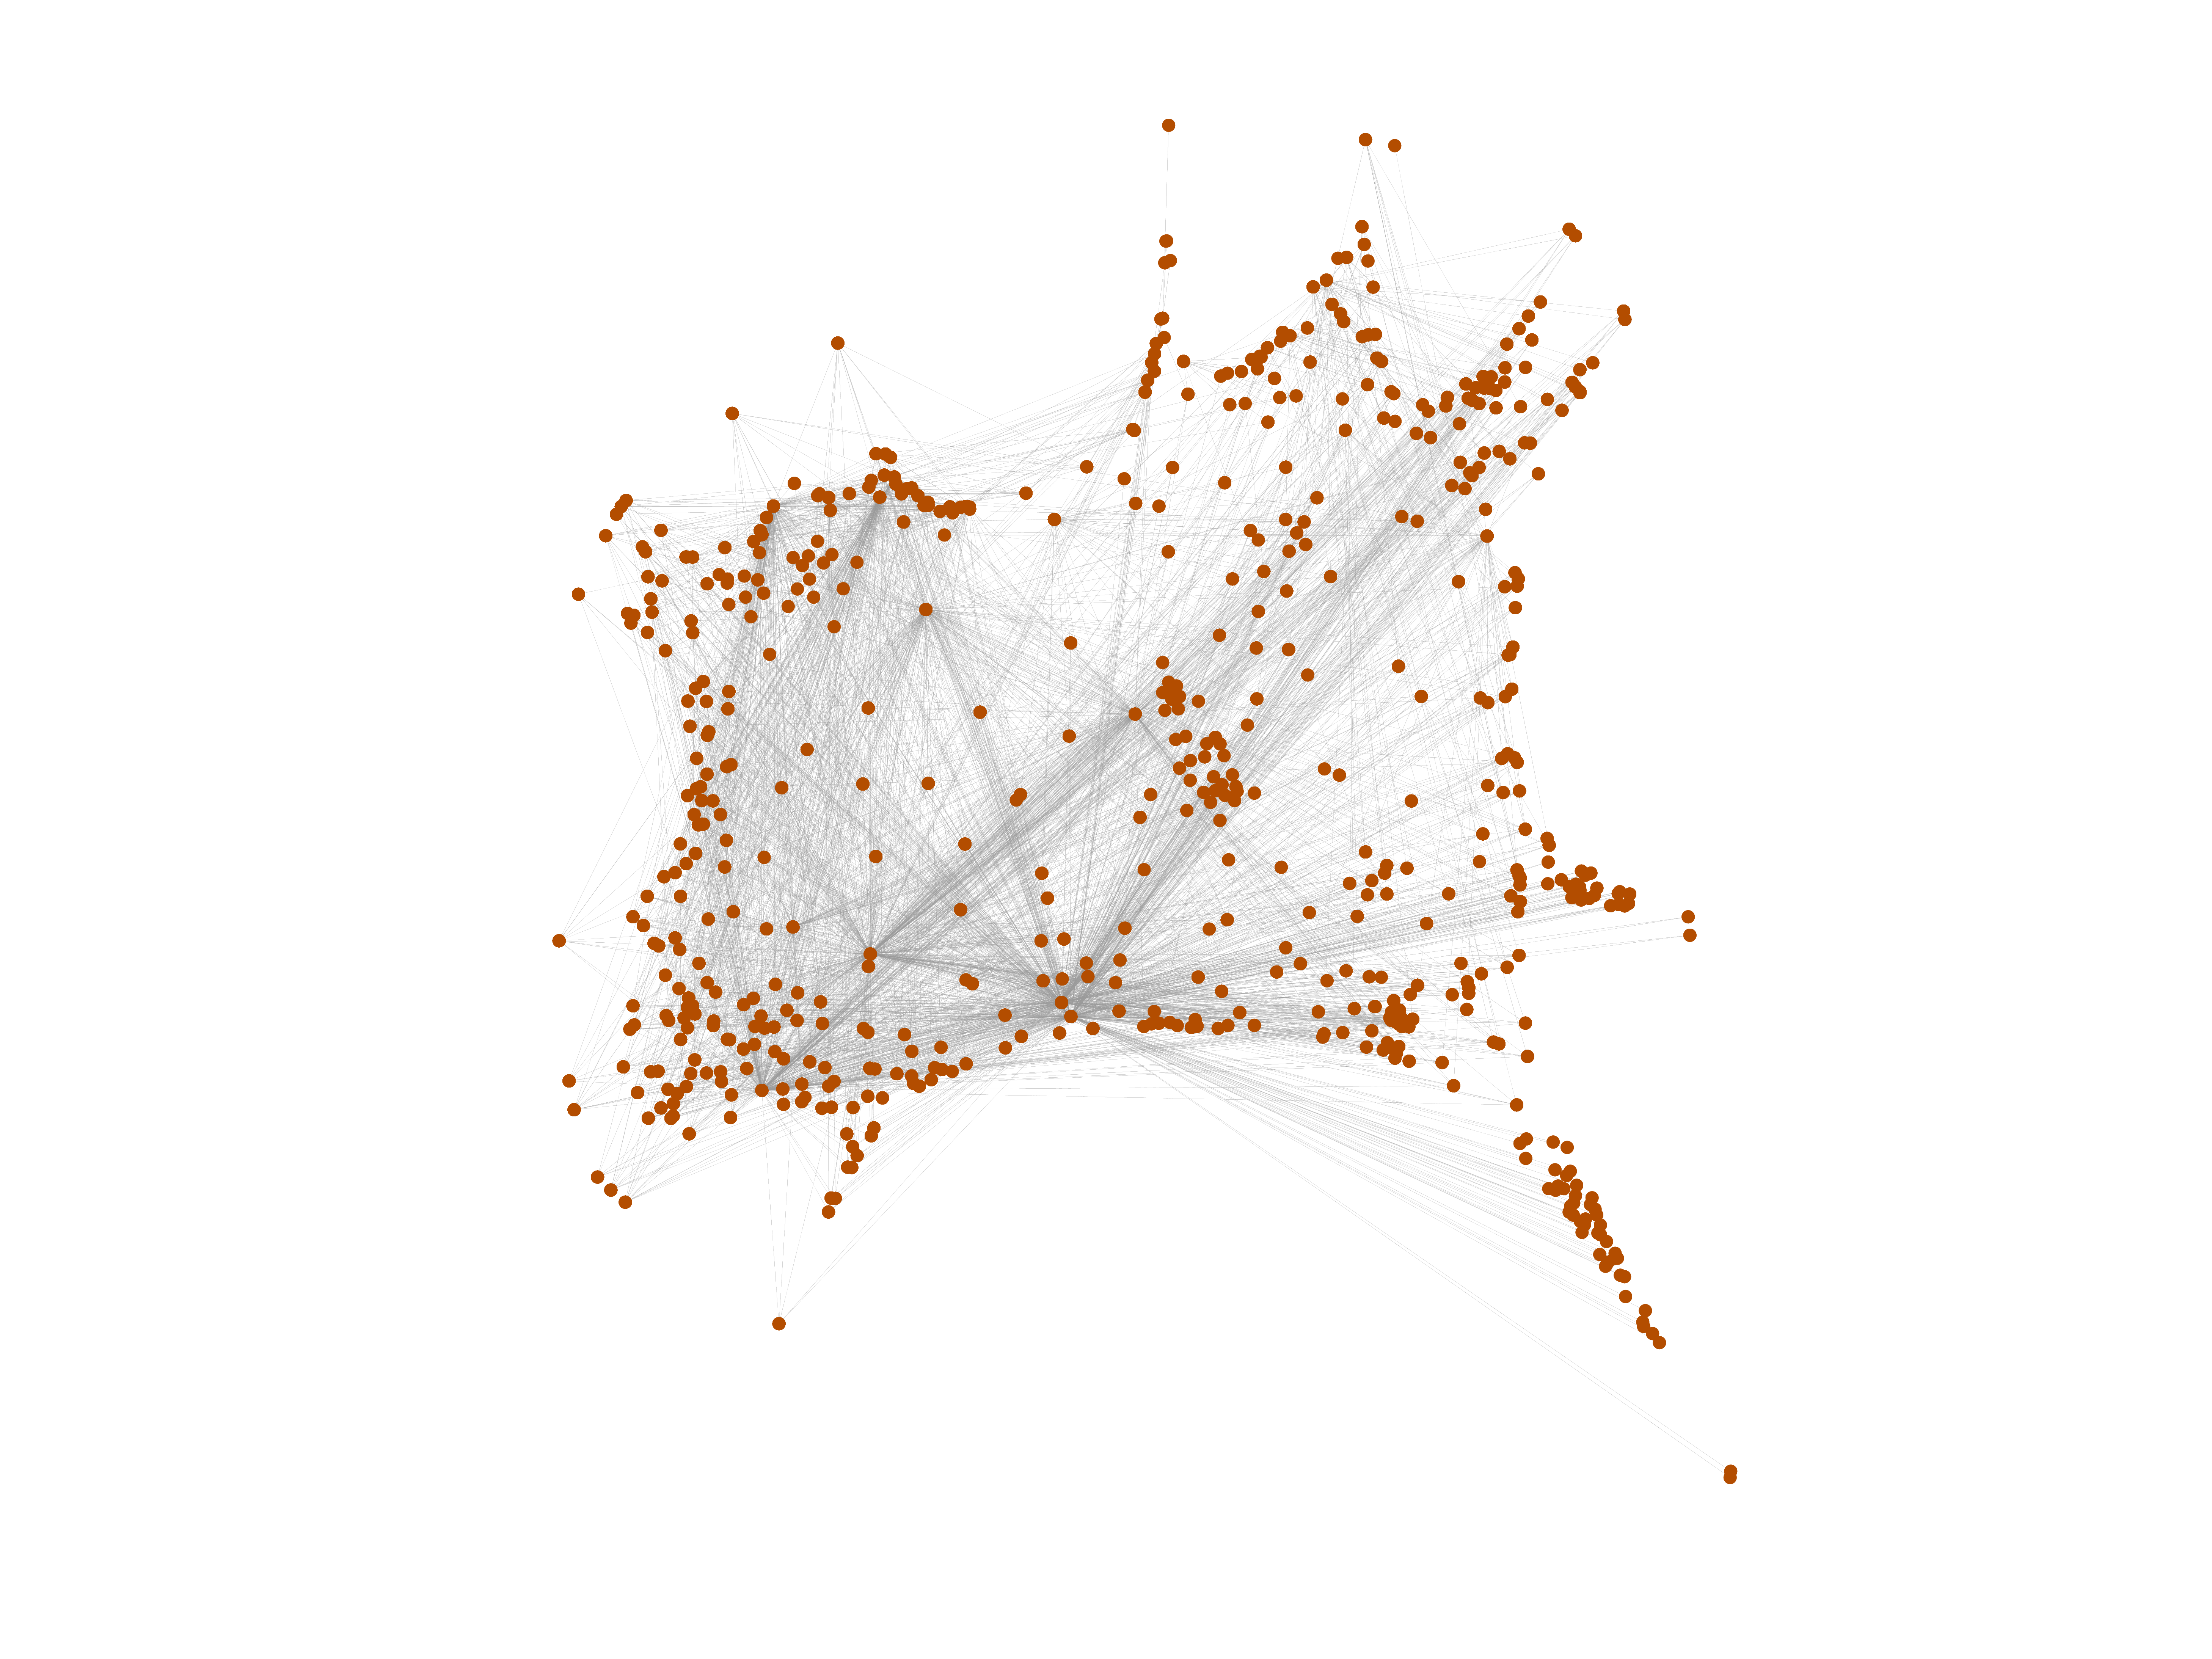
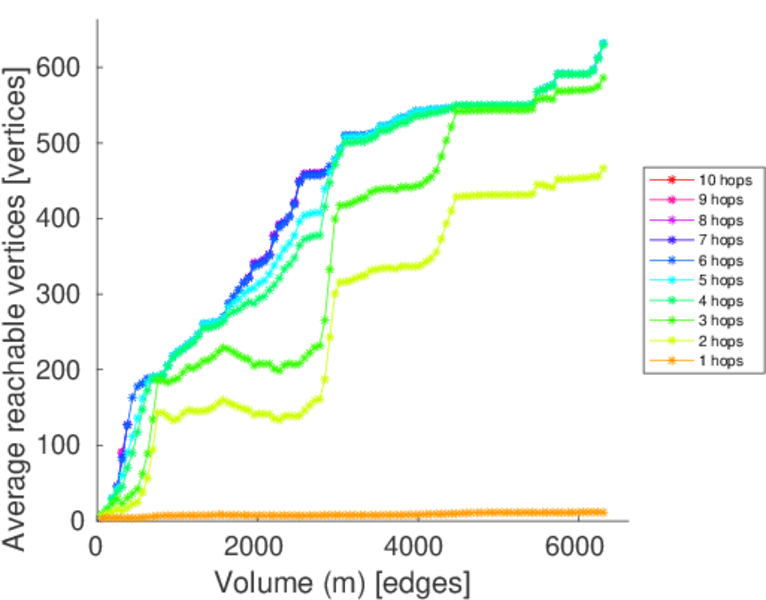
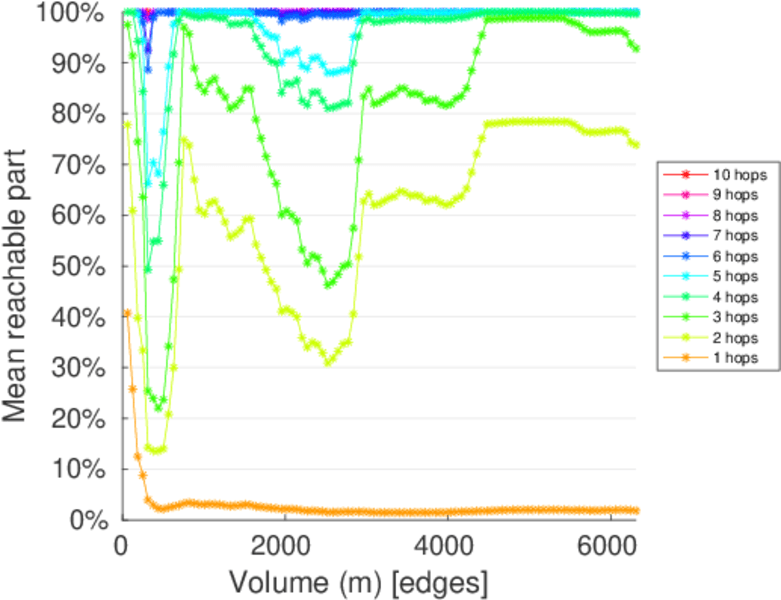
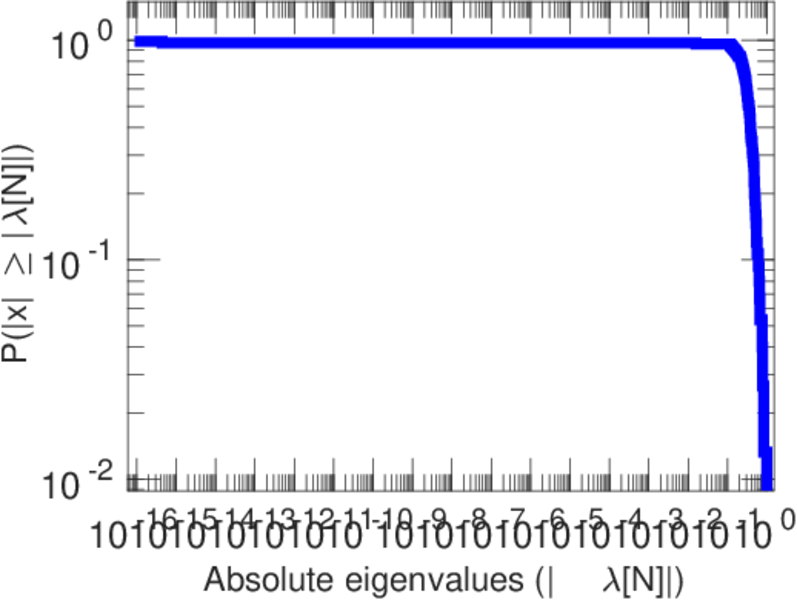
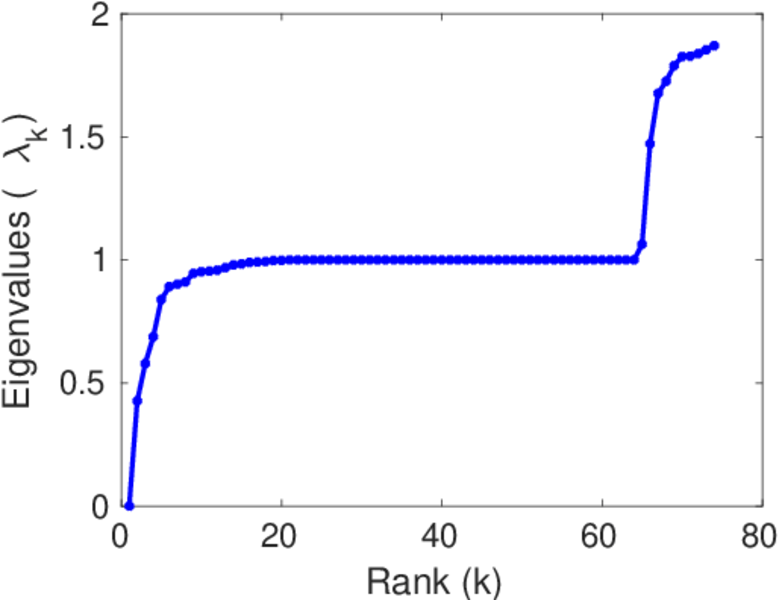
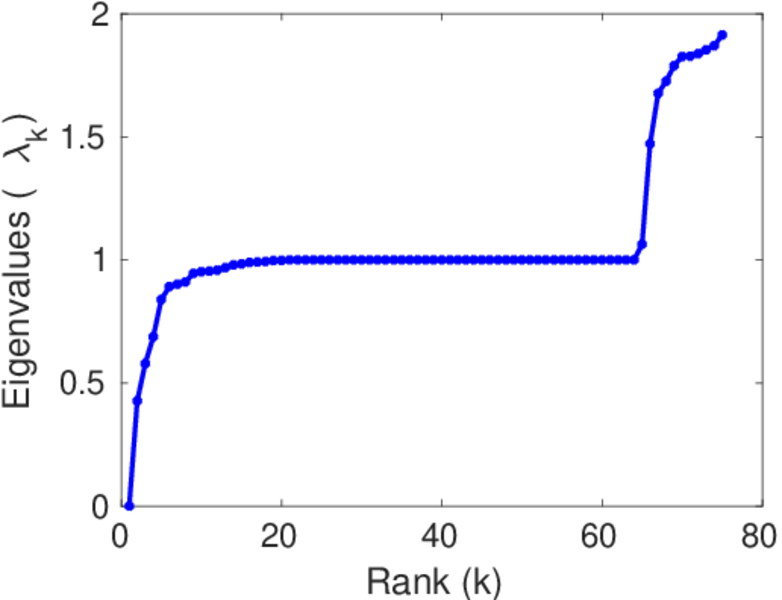
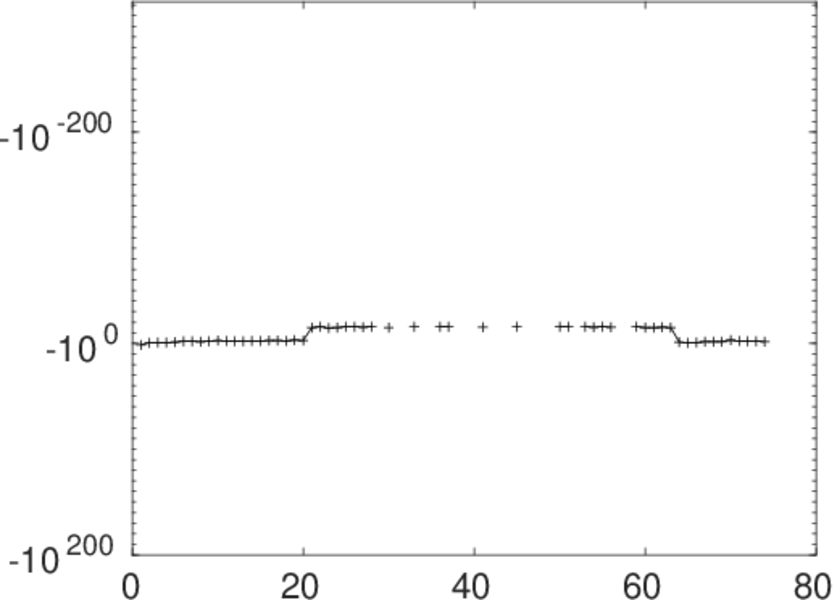
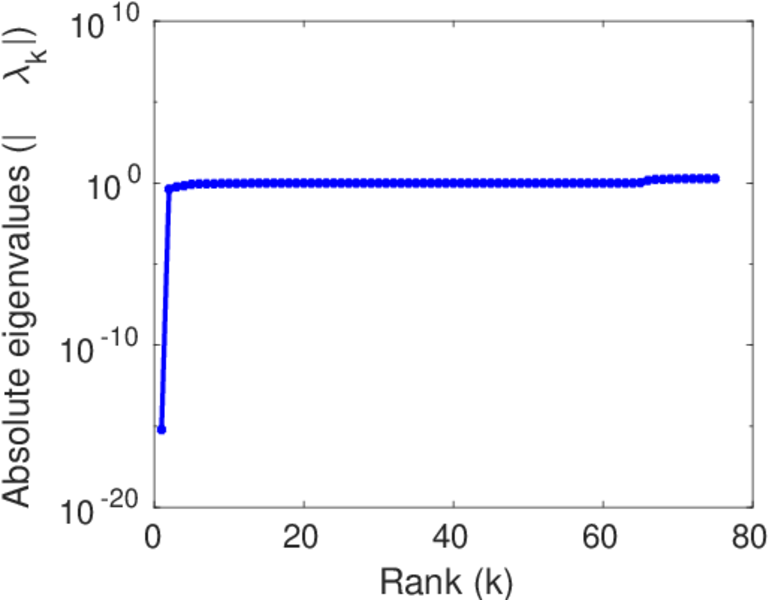
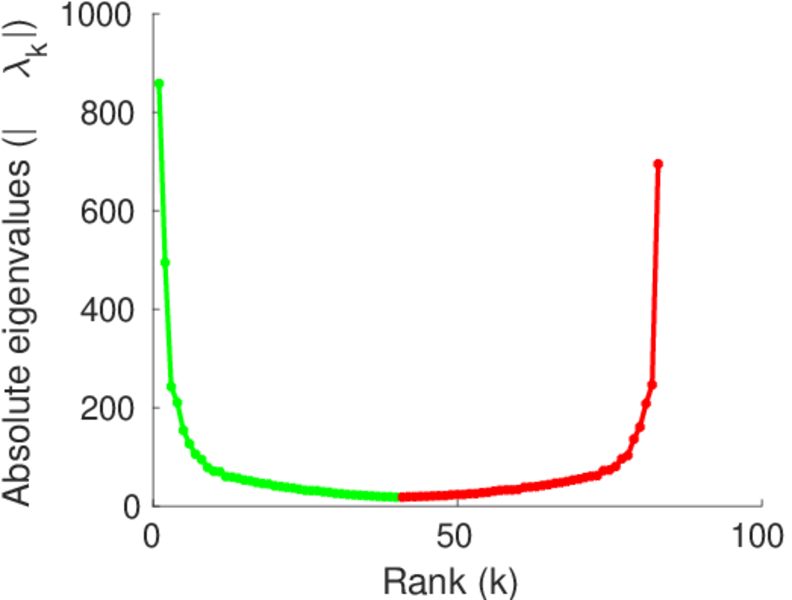
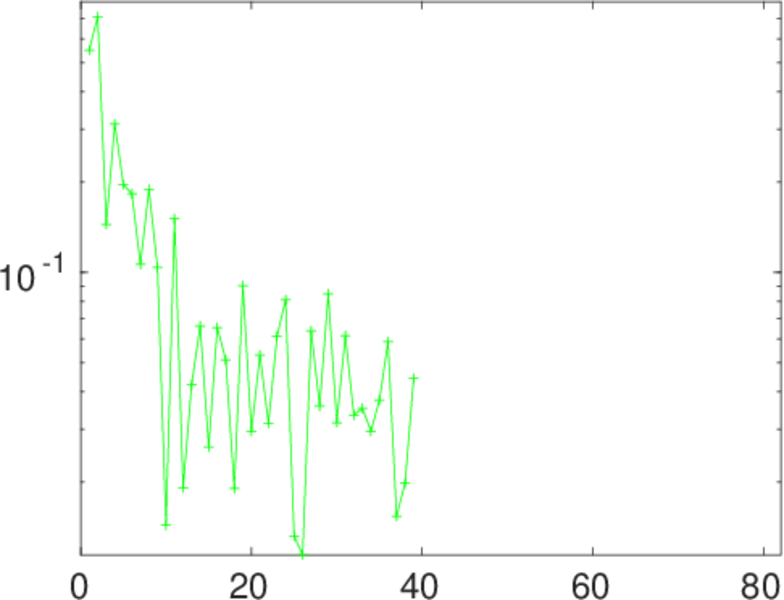
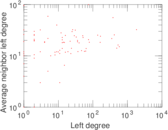
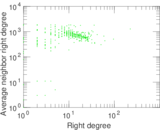
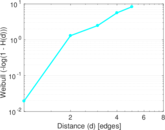
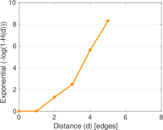
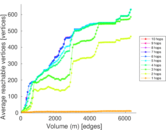
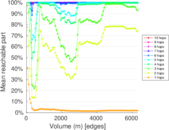
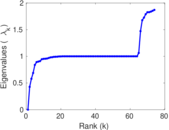
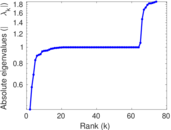
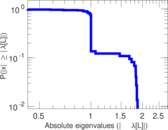
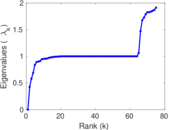
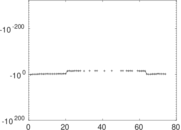
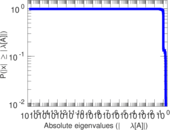
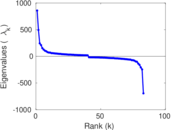
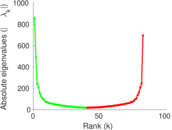
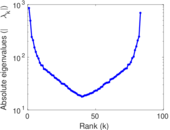
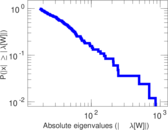
Plots
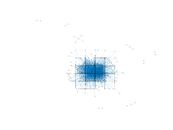


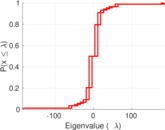


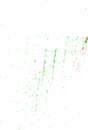


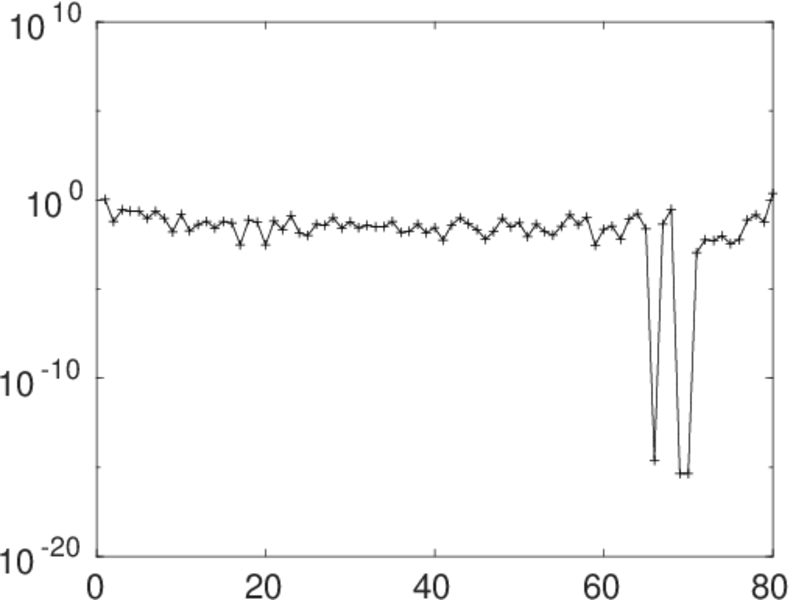
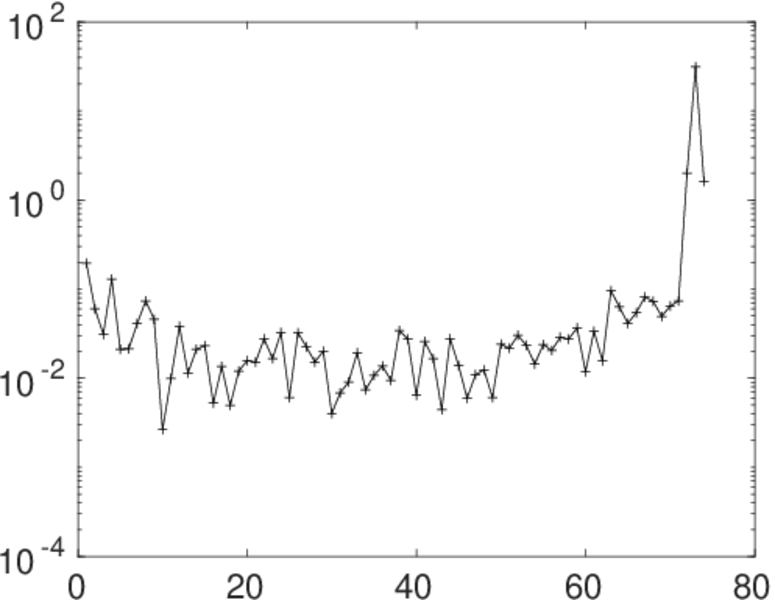
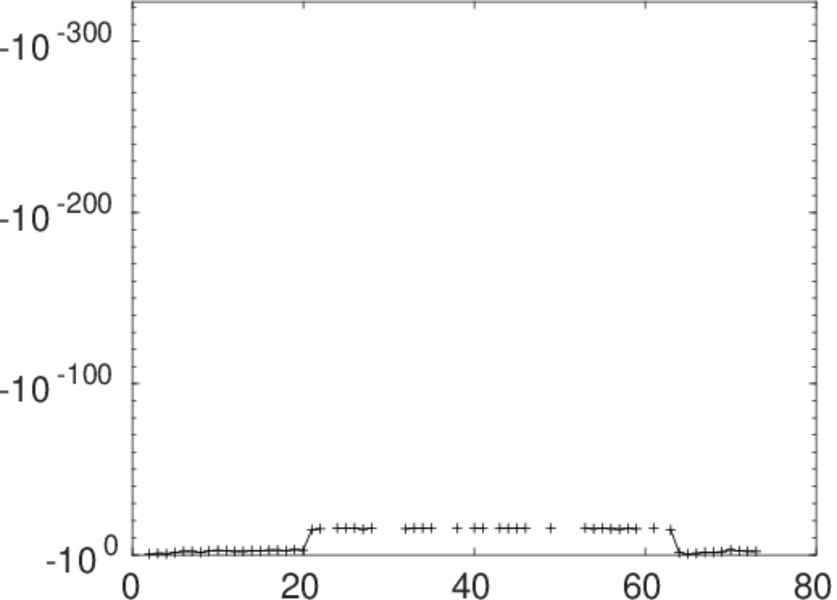
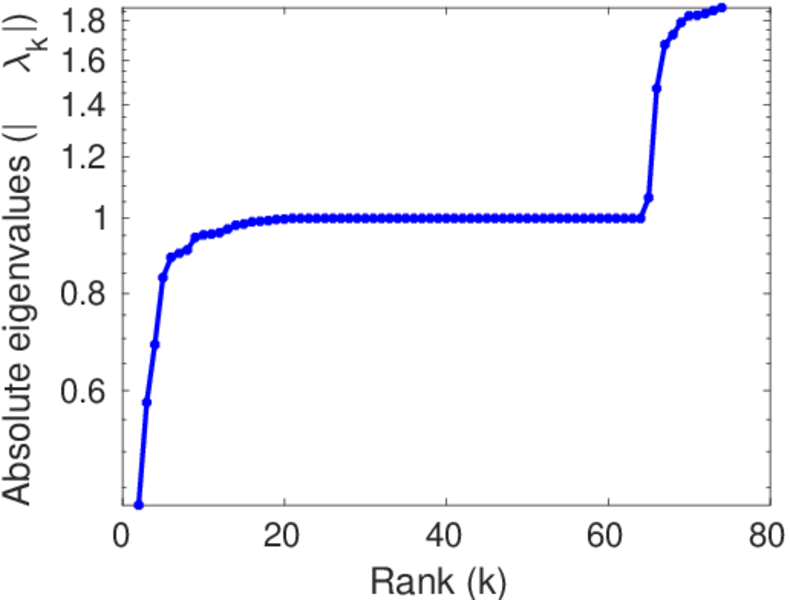
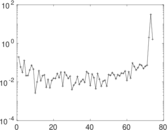
Matrix decompositions plots


Downloads
References
|
[1]
|
Jérôme Kunegis.
KONECT – The Koblenz Network Collection.
In Proc. Int. Conf. on World Wide Web Companion, pages
1343–1350, 2013.
[ http ]
|
|
[2]
|
Wikimedia Foundation.
Wikimedia downloads.
http://dumps.wikimedia.org/, January 2010.
|
 KONECT ‣ Networks ‣
Buy Me a Coffee
KONECT ‣ Networks ‣
Buy Me a Coffee