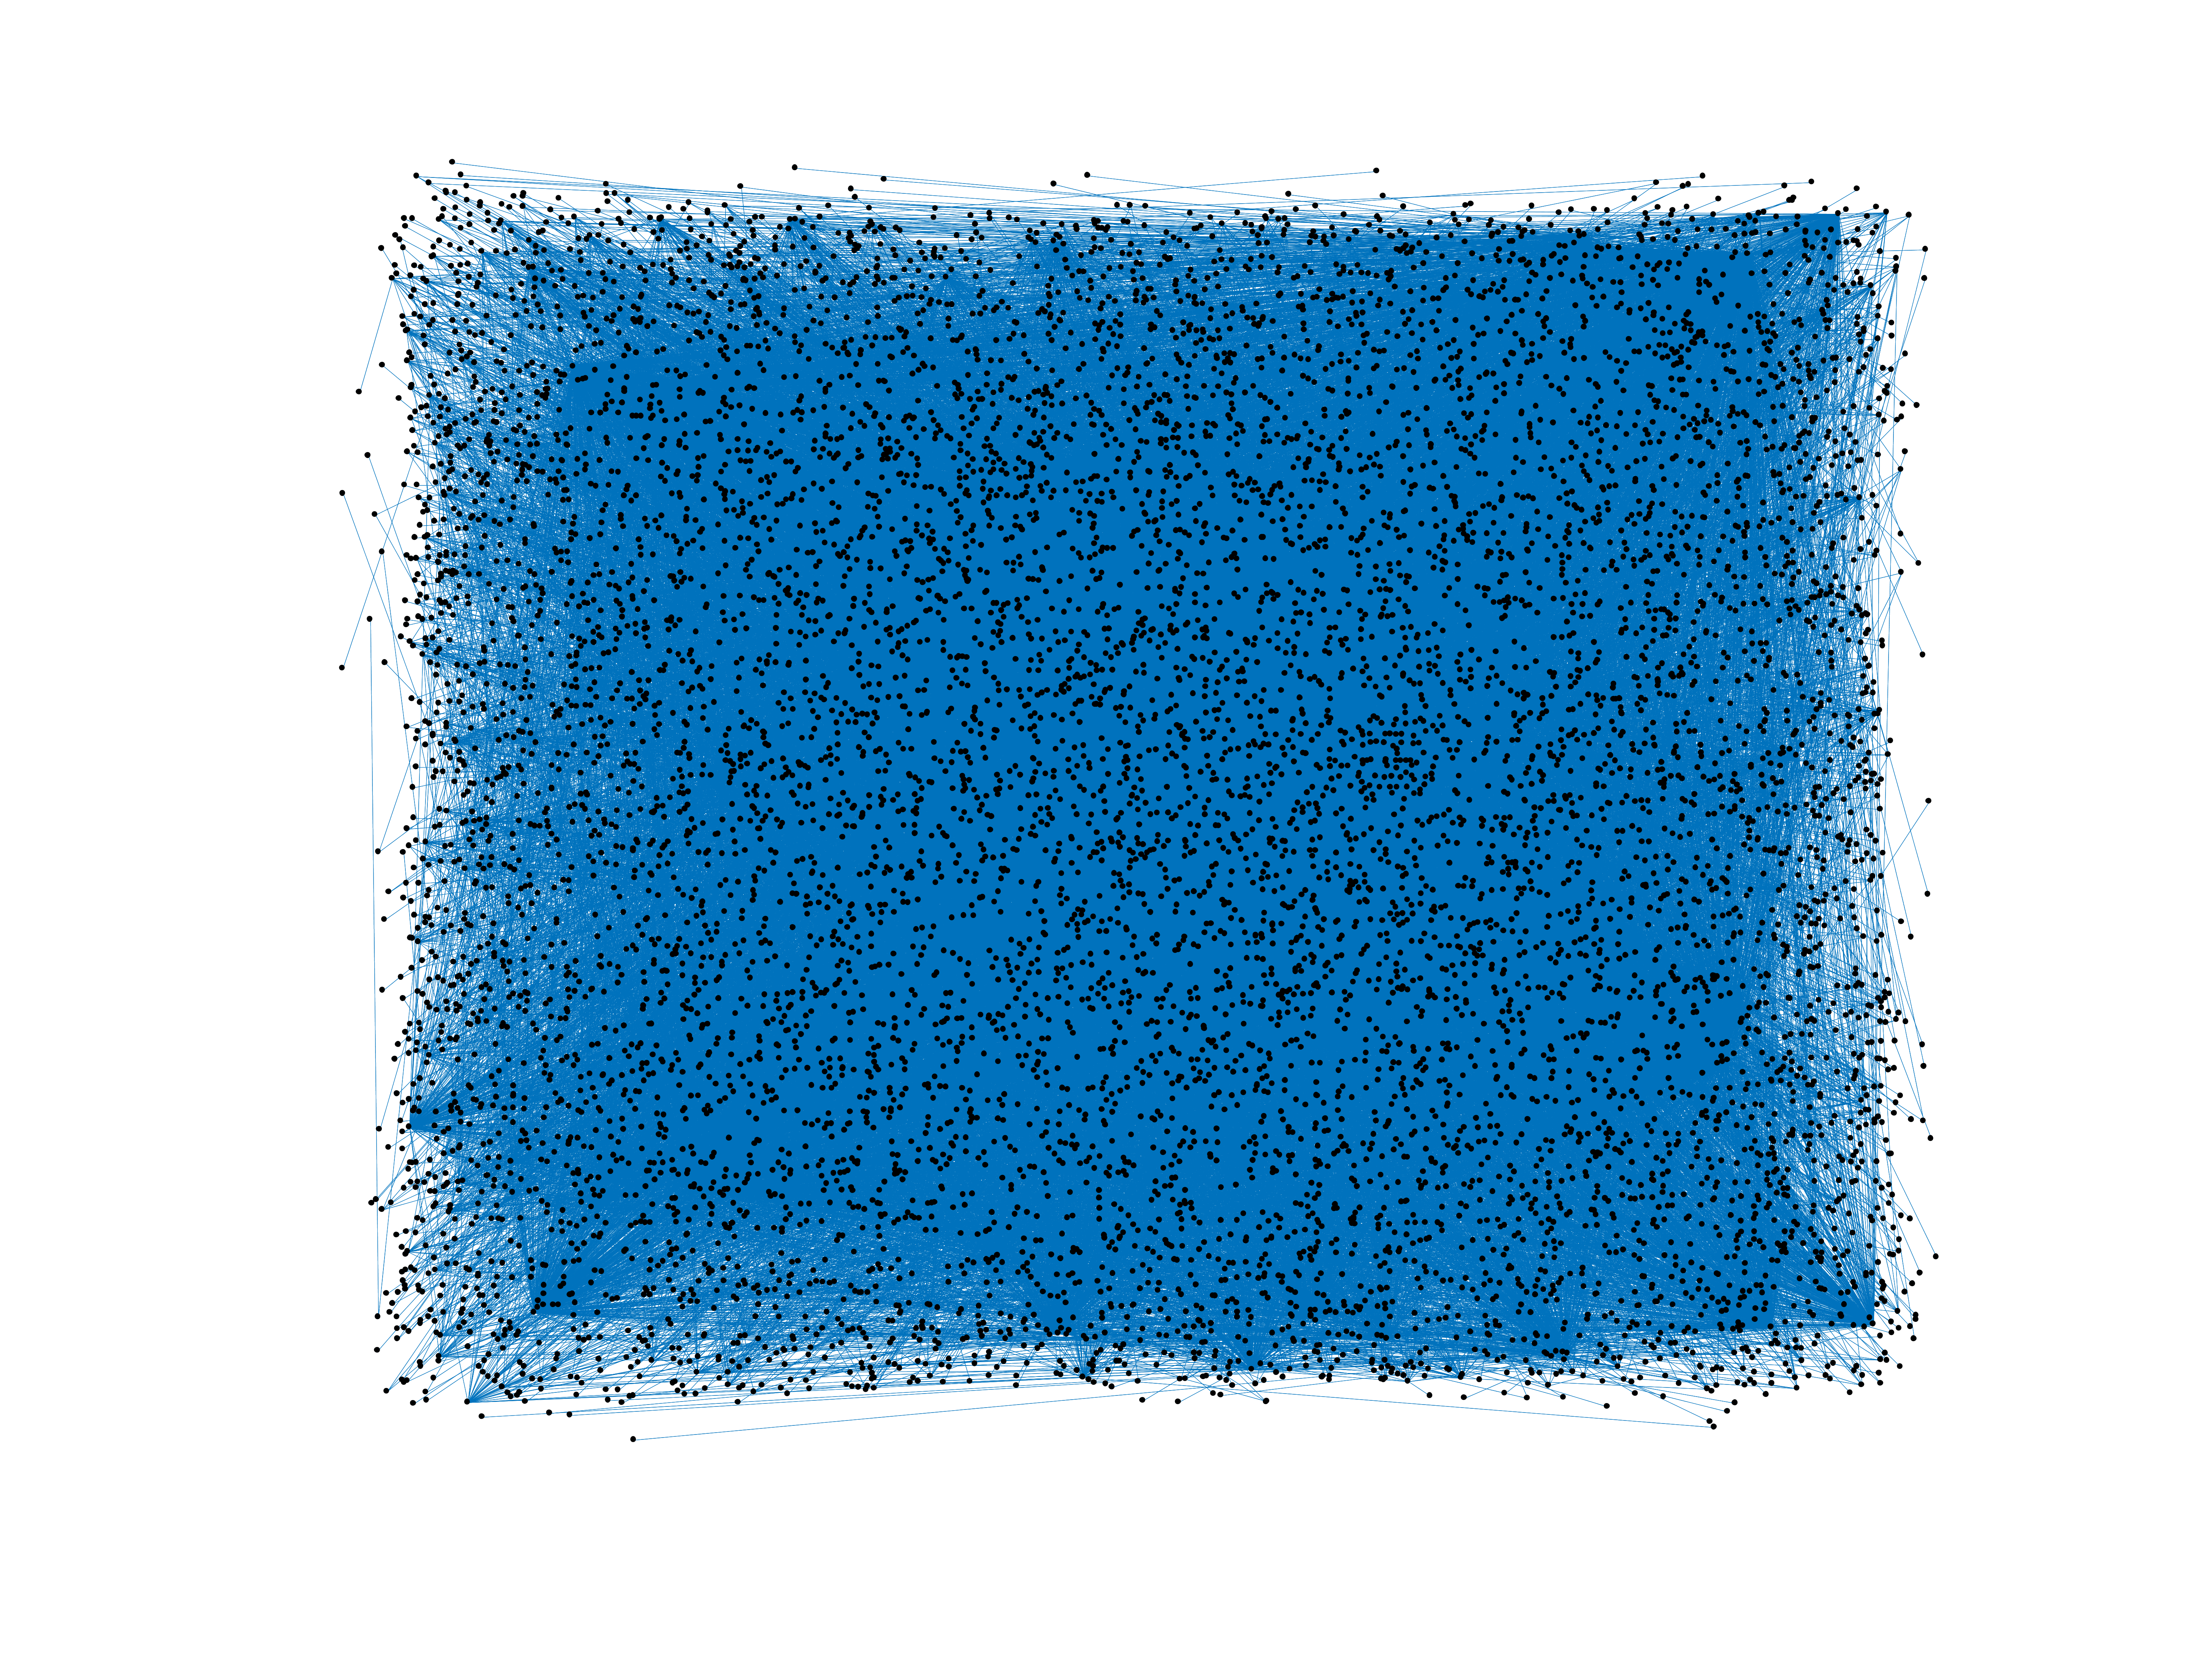
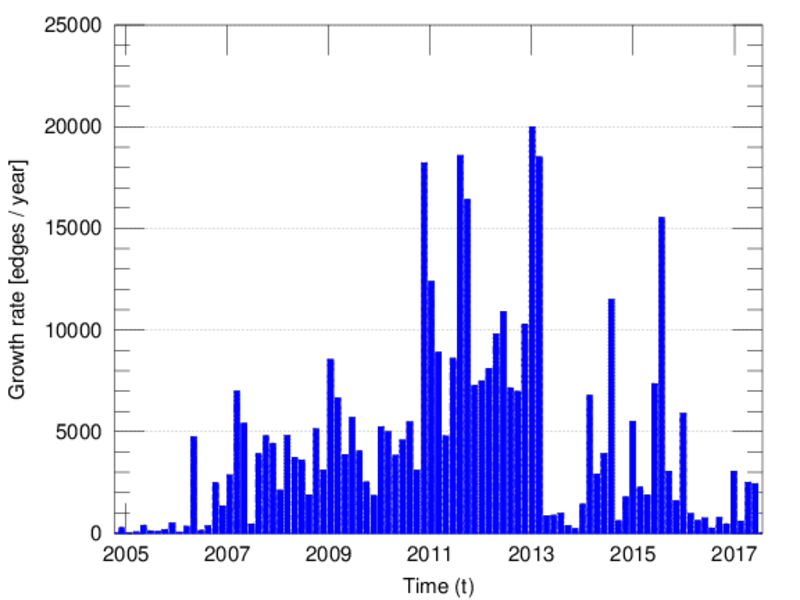
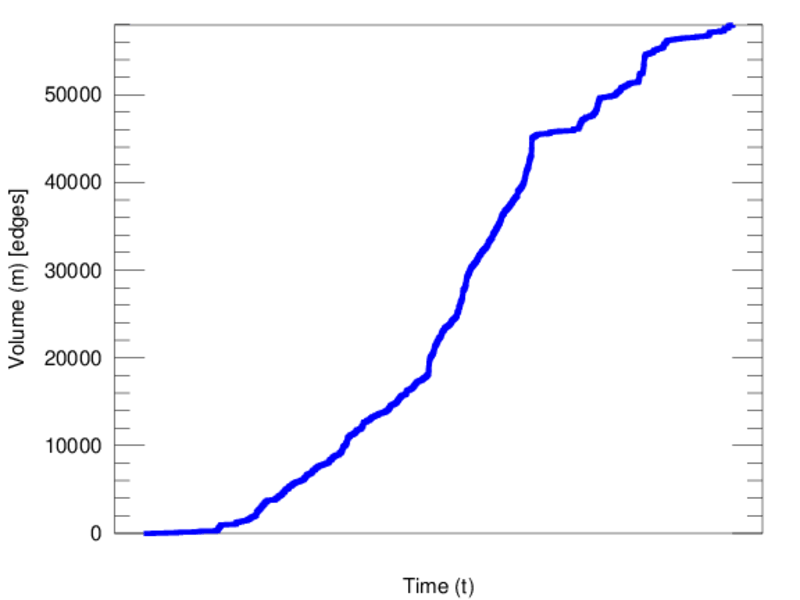
Wikipedia edits (av)
This is the bipartite edit network of the Avaric Wikipedia. It contains users
and pages from the Avaric Wikipedia, connected by edit events. Each edge
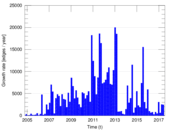
represents an edit. The dataset includes the timestamp of each edit.
Metadata
Statistics
| Size | n = | 9,589
|
| Left size | n1 = | 946
|
| Right size | n2 = | 8,643
|
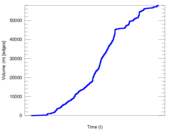
| Volume | m = | 57,932
|
| Unique edge count | m̿ = | 27,415
|
| Wedge count | s = | 12,540,183
|
| Claw count | z = | 7,715,230,421
|
| Cross count | x = | 4,594,300,142,929
|
| Square count | q = | 13,460,248
|
| 4-Tour count | T4 = | 157,906,234
|
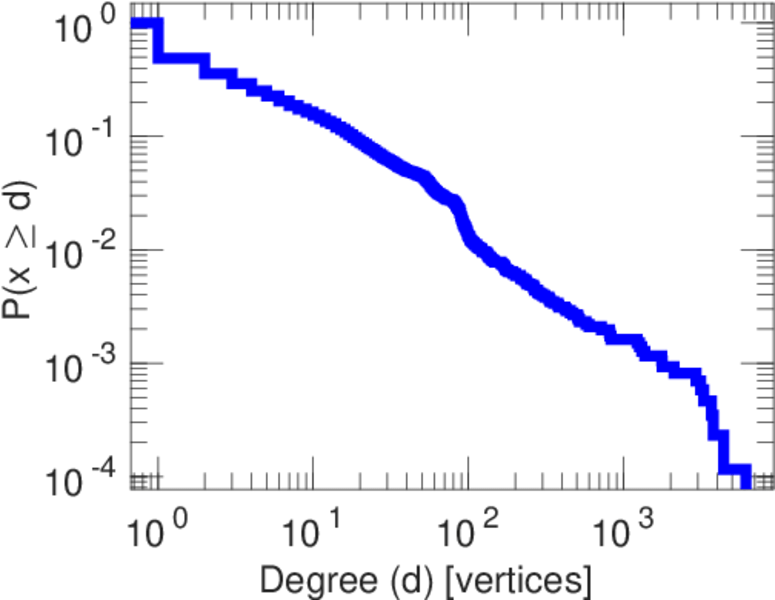
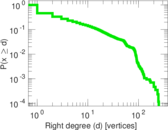
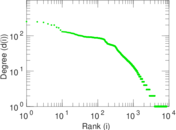
| Maximum degree | dmax = | 6,142
|
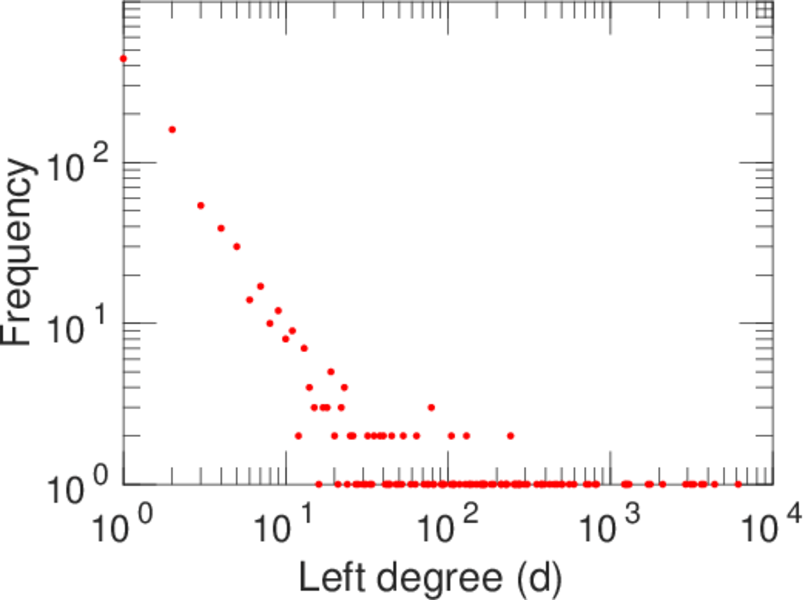
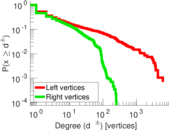
| Maximum left degree | d1max = | 6,142
|
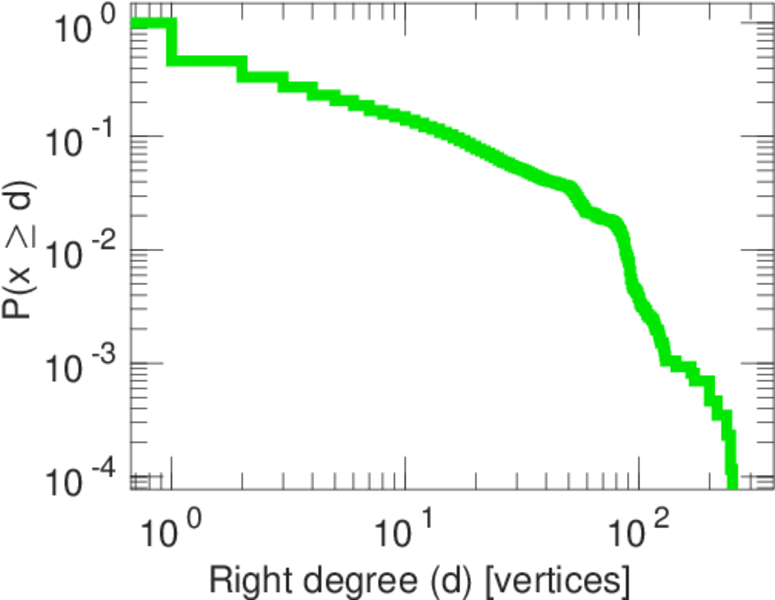
| Maximum right degree | d2max = | 251
|
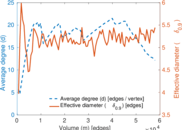
| Average degree | d = | 12.083 0
|
| Average left degree | d1 = | 61.238 9
|
| Average right degree | d2 = | 6.702 77
|
| Fill | p = | 0.003 352 99
|
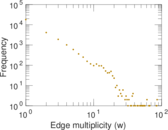
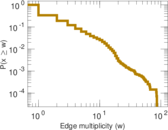
| Average edge multiplicity | m̃ = | 2.113 15
|
| Size of LCC | N = | 8,879
|
| Diameter | δ = | 13
|
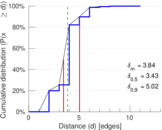
| 50-Percentile effective diameter | δ0.5 = | 3.432 60
|
| 90-Percentile effective diameter | δ0.9 = | 5.015 61
|
| Median distance | δM = | 4
|
| Mean distance | δm = | 3.843 23
|
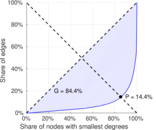
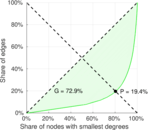
| Gini coefficient | G = | 0.850 050
|
| Balanced inequality ratio | P = | 0.141 709
|
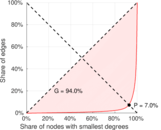
| Left balanced inequality ratio | P1 = | 0.069 685 1
|
| Right balanced inequality ratio | P2 = | 0.194 418
|
| Relative edge distribution entropy | Her = | 0.761 857
|
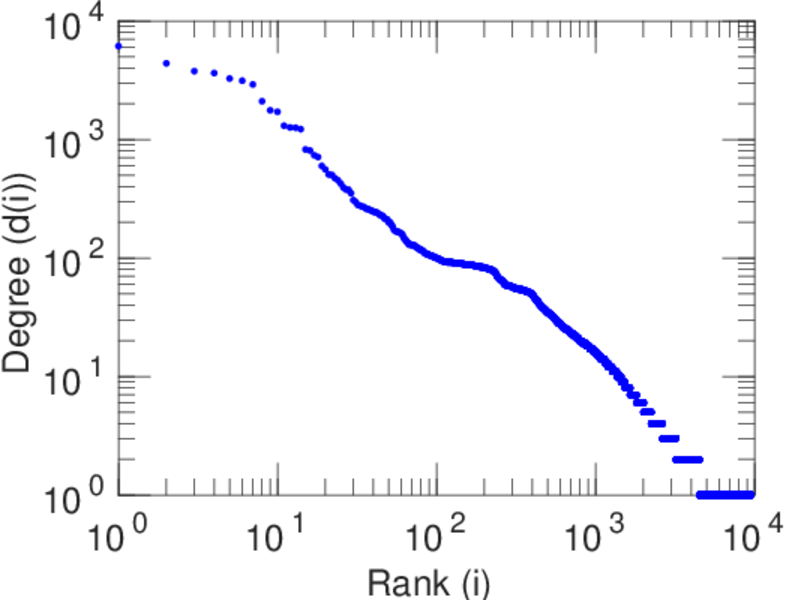
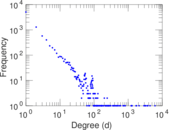
| Power law exponent | γ = | 2.725 12
|
| Tail power law exponent | γt = | 1.991 00
|
| Tail power law exponent with p | γ3 = | 1.991 00
|
| p-value | p = | 0.000 00
|
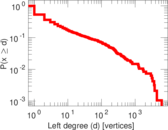
| Left tail power law exponent with p | γ3,1 = | 1.581 00
|
| Left p-value | p1 = | 0.000 00
|
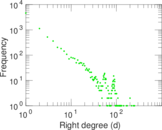
| Right tail power law exponent with p | γ3,2 = | 2.031 00
|
| Right p-value | p2 = | 0.000 00
|
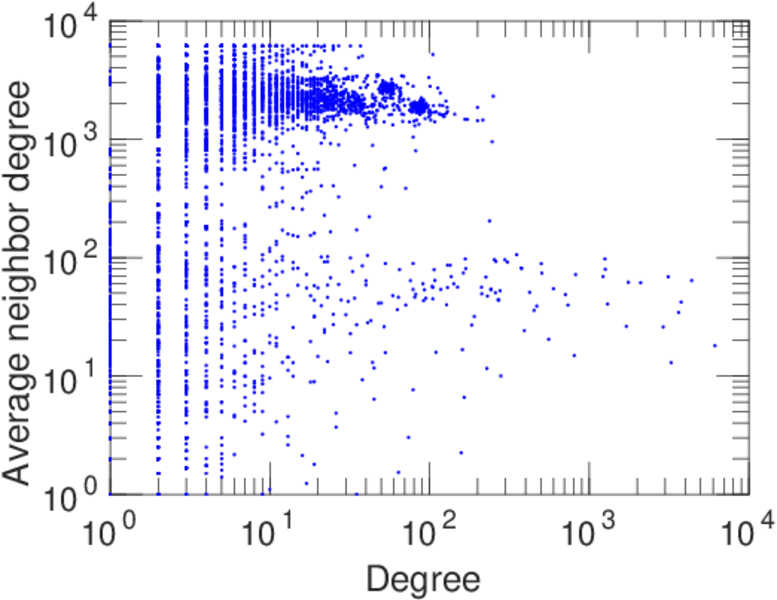
| Degree assortativity | ρ = | −0.405 204
|
| Degree assortativity p-value | pρ = | 0.000 00
|
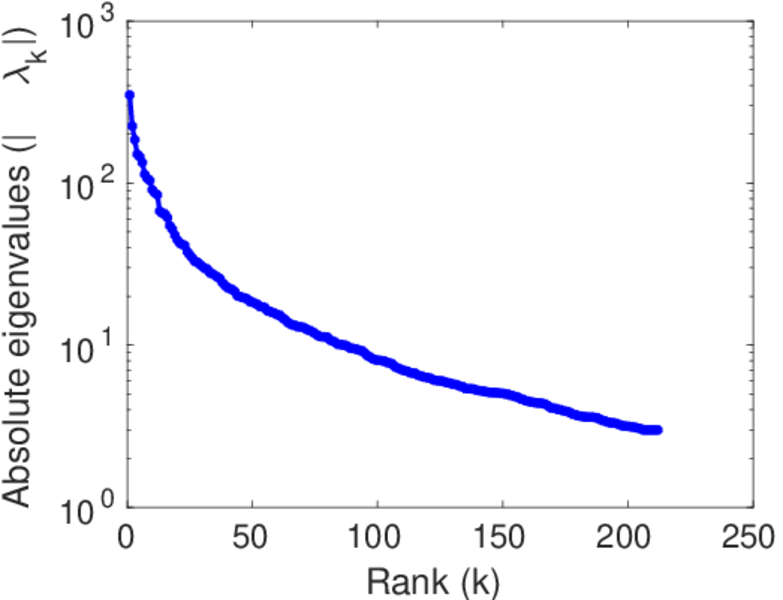
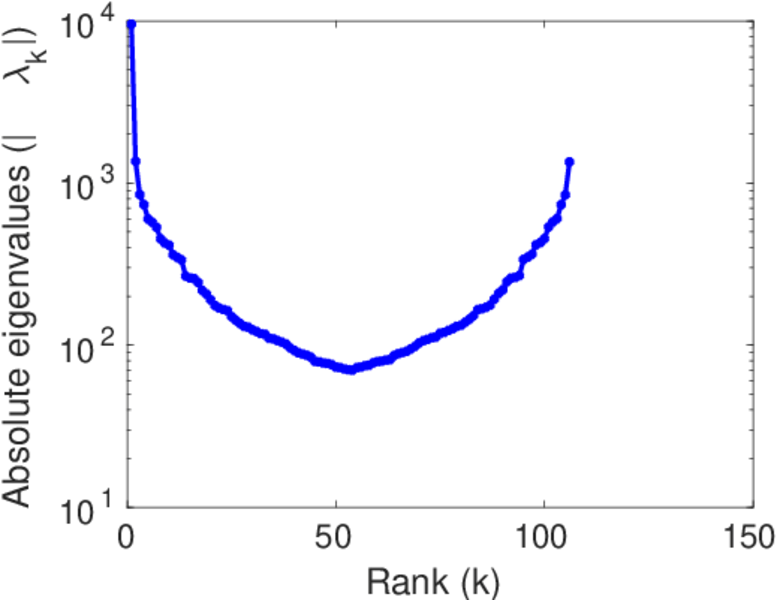
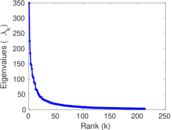
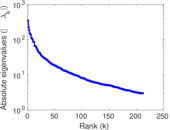
| Spectral norm | α = | 349.648
|
| Algebraic connectivity | a = | 0.018 415 8
|
| Spectral separation | |λ1[A] / λ2[A]| = | 1.555 57
|
| Controllability | C = | 7,839
|
| Relative controllability | Cr = | 0.821 784
|
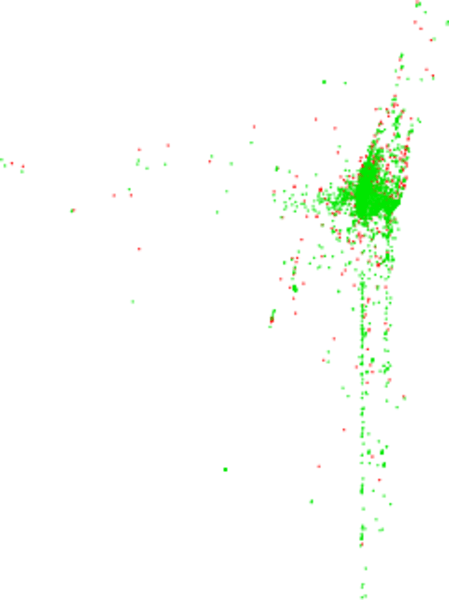
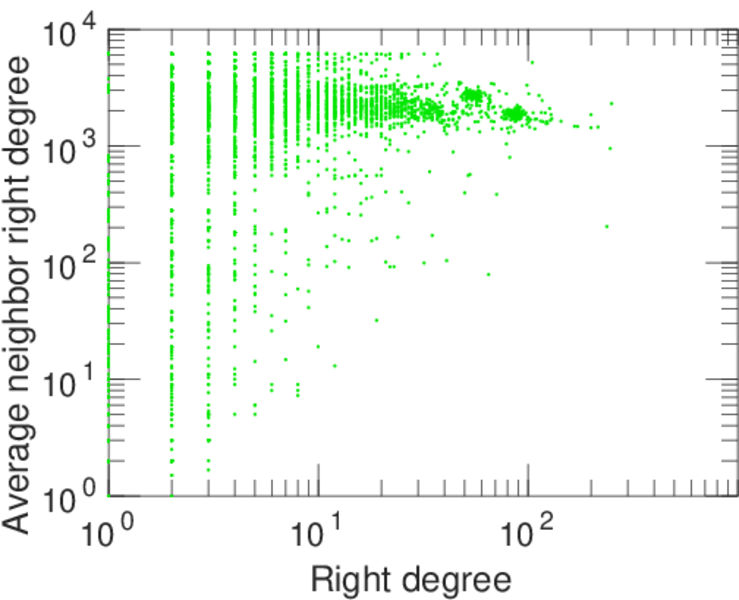
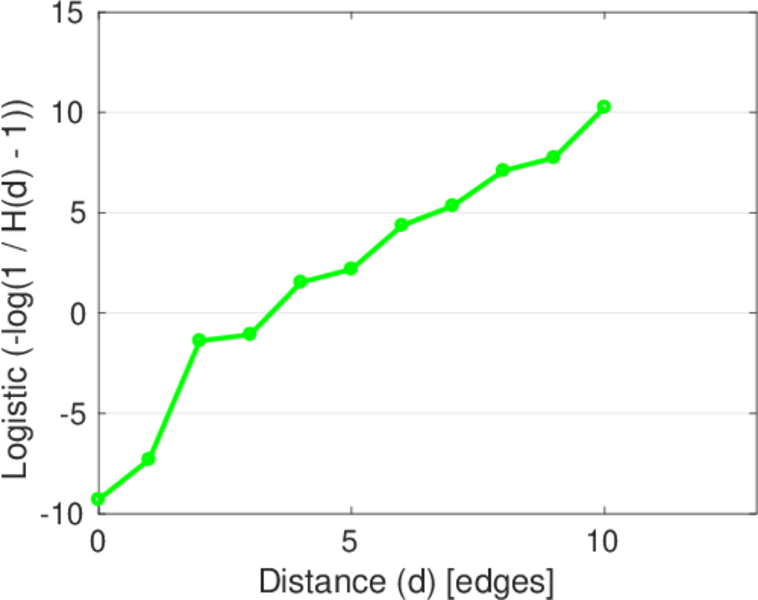
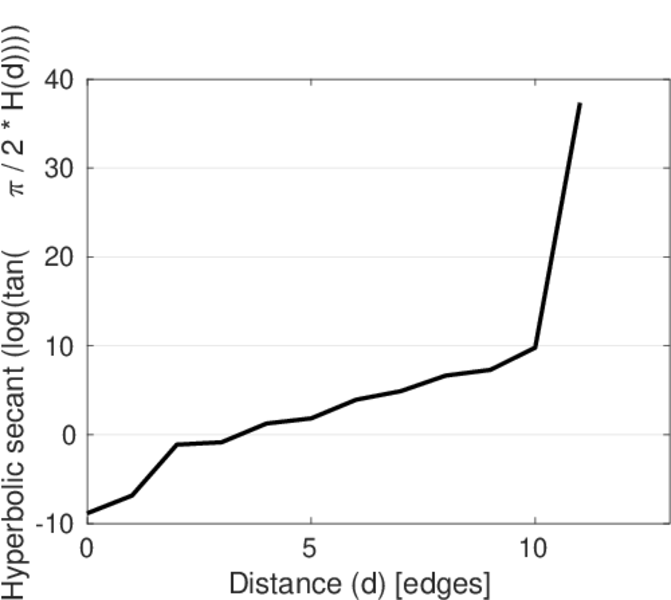
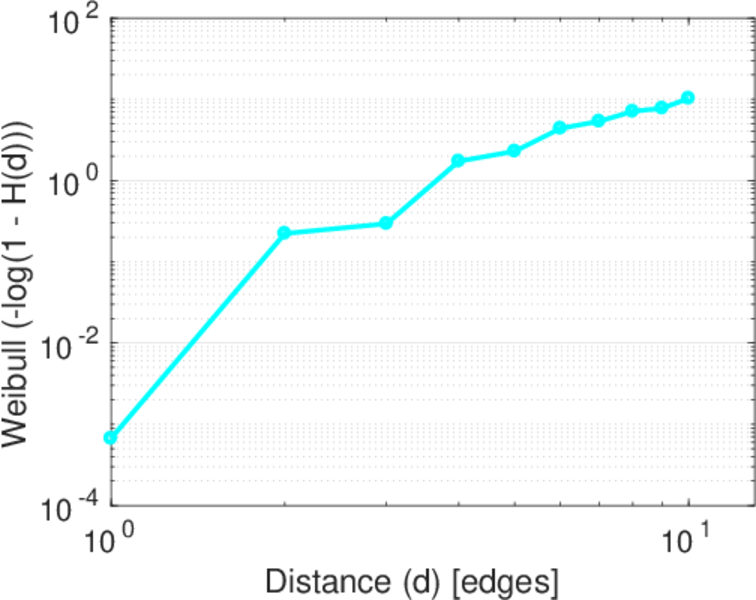
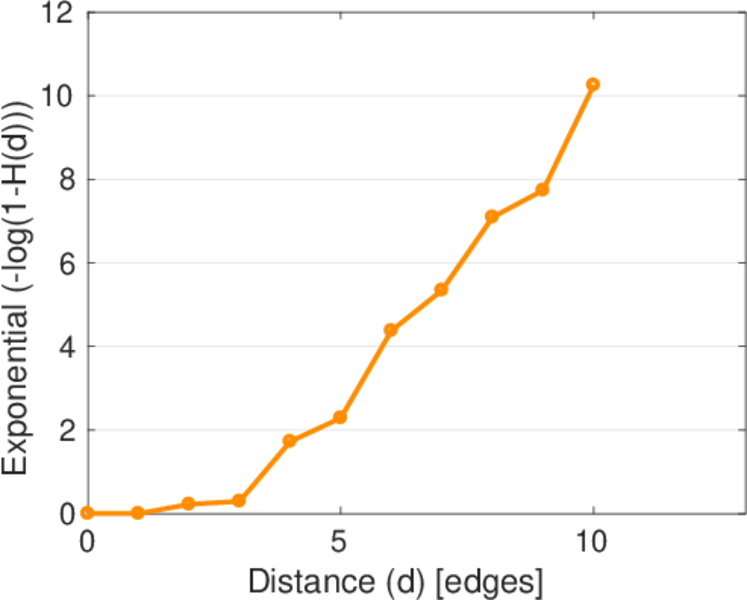
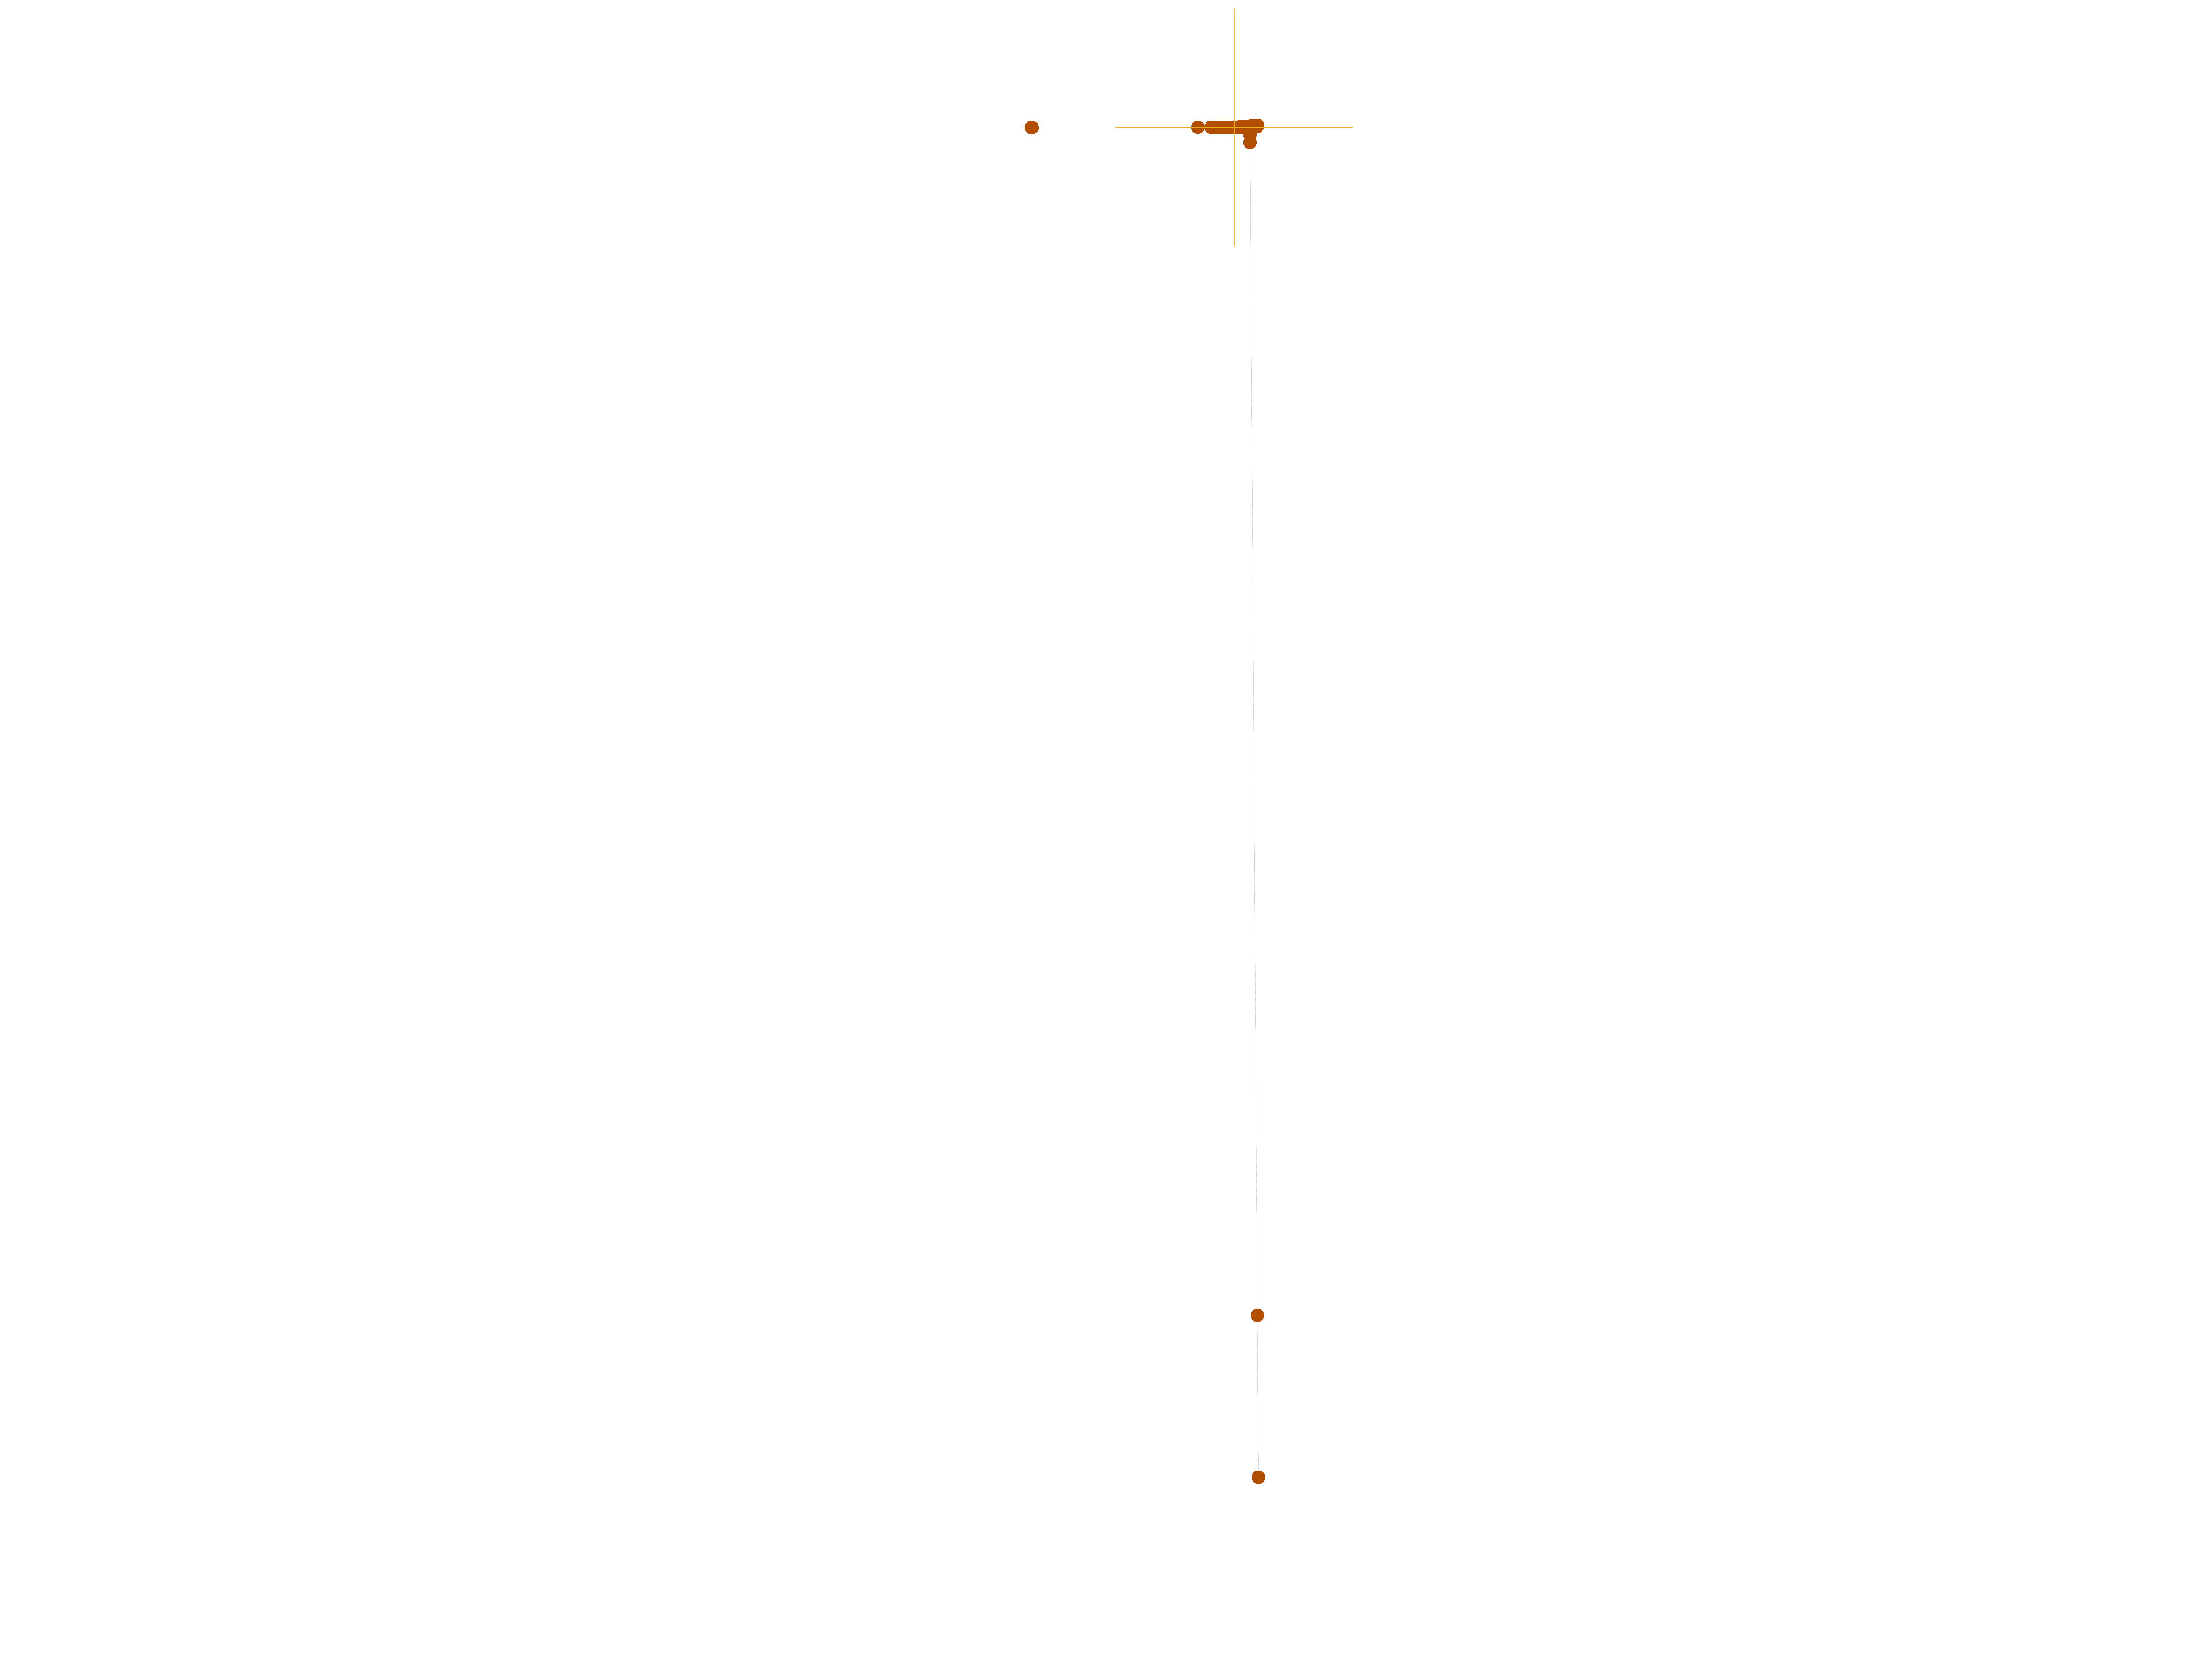
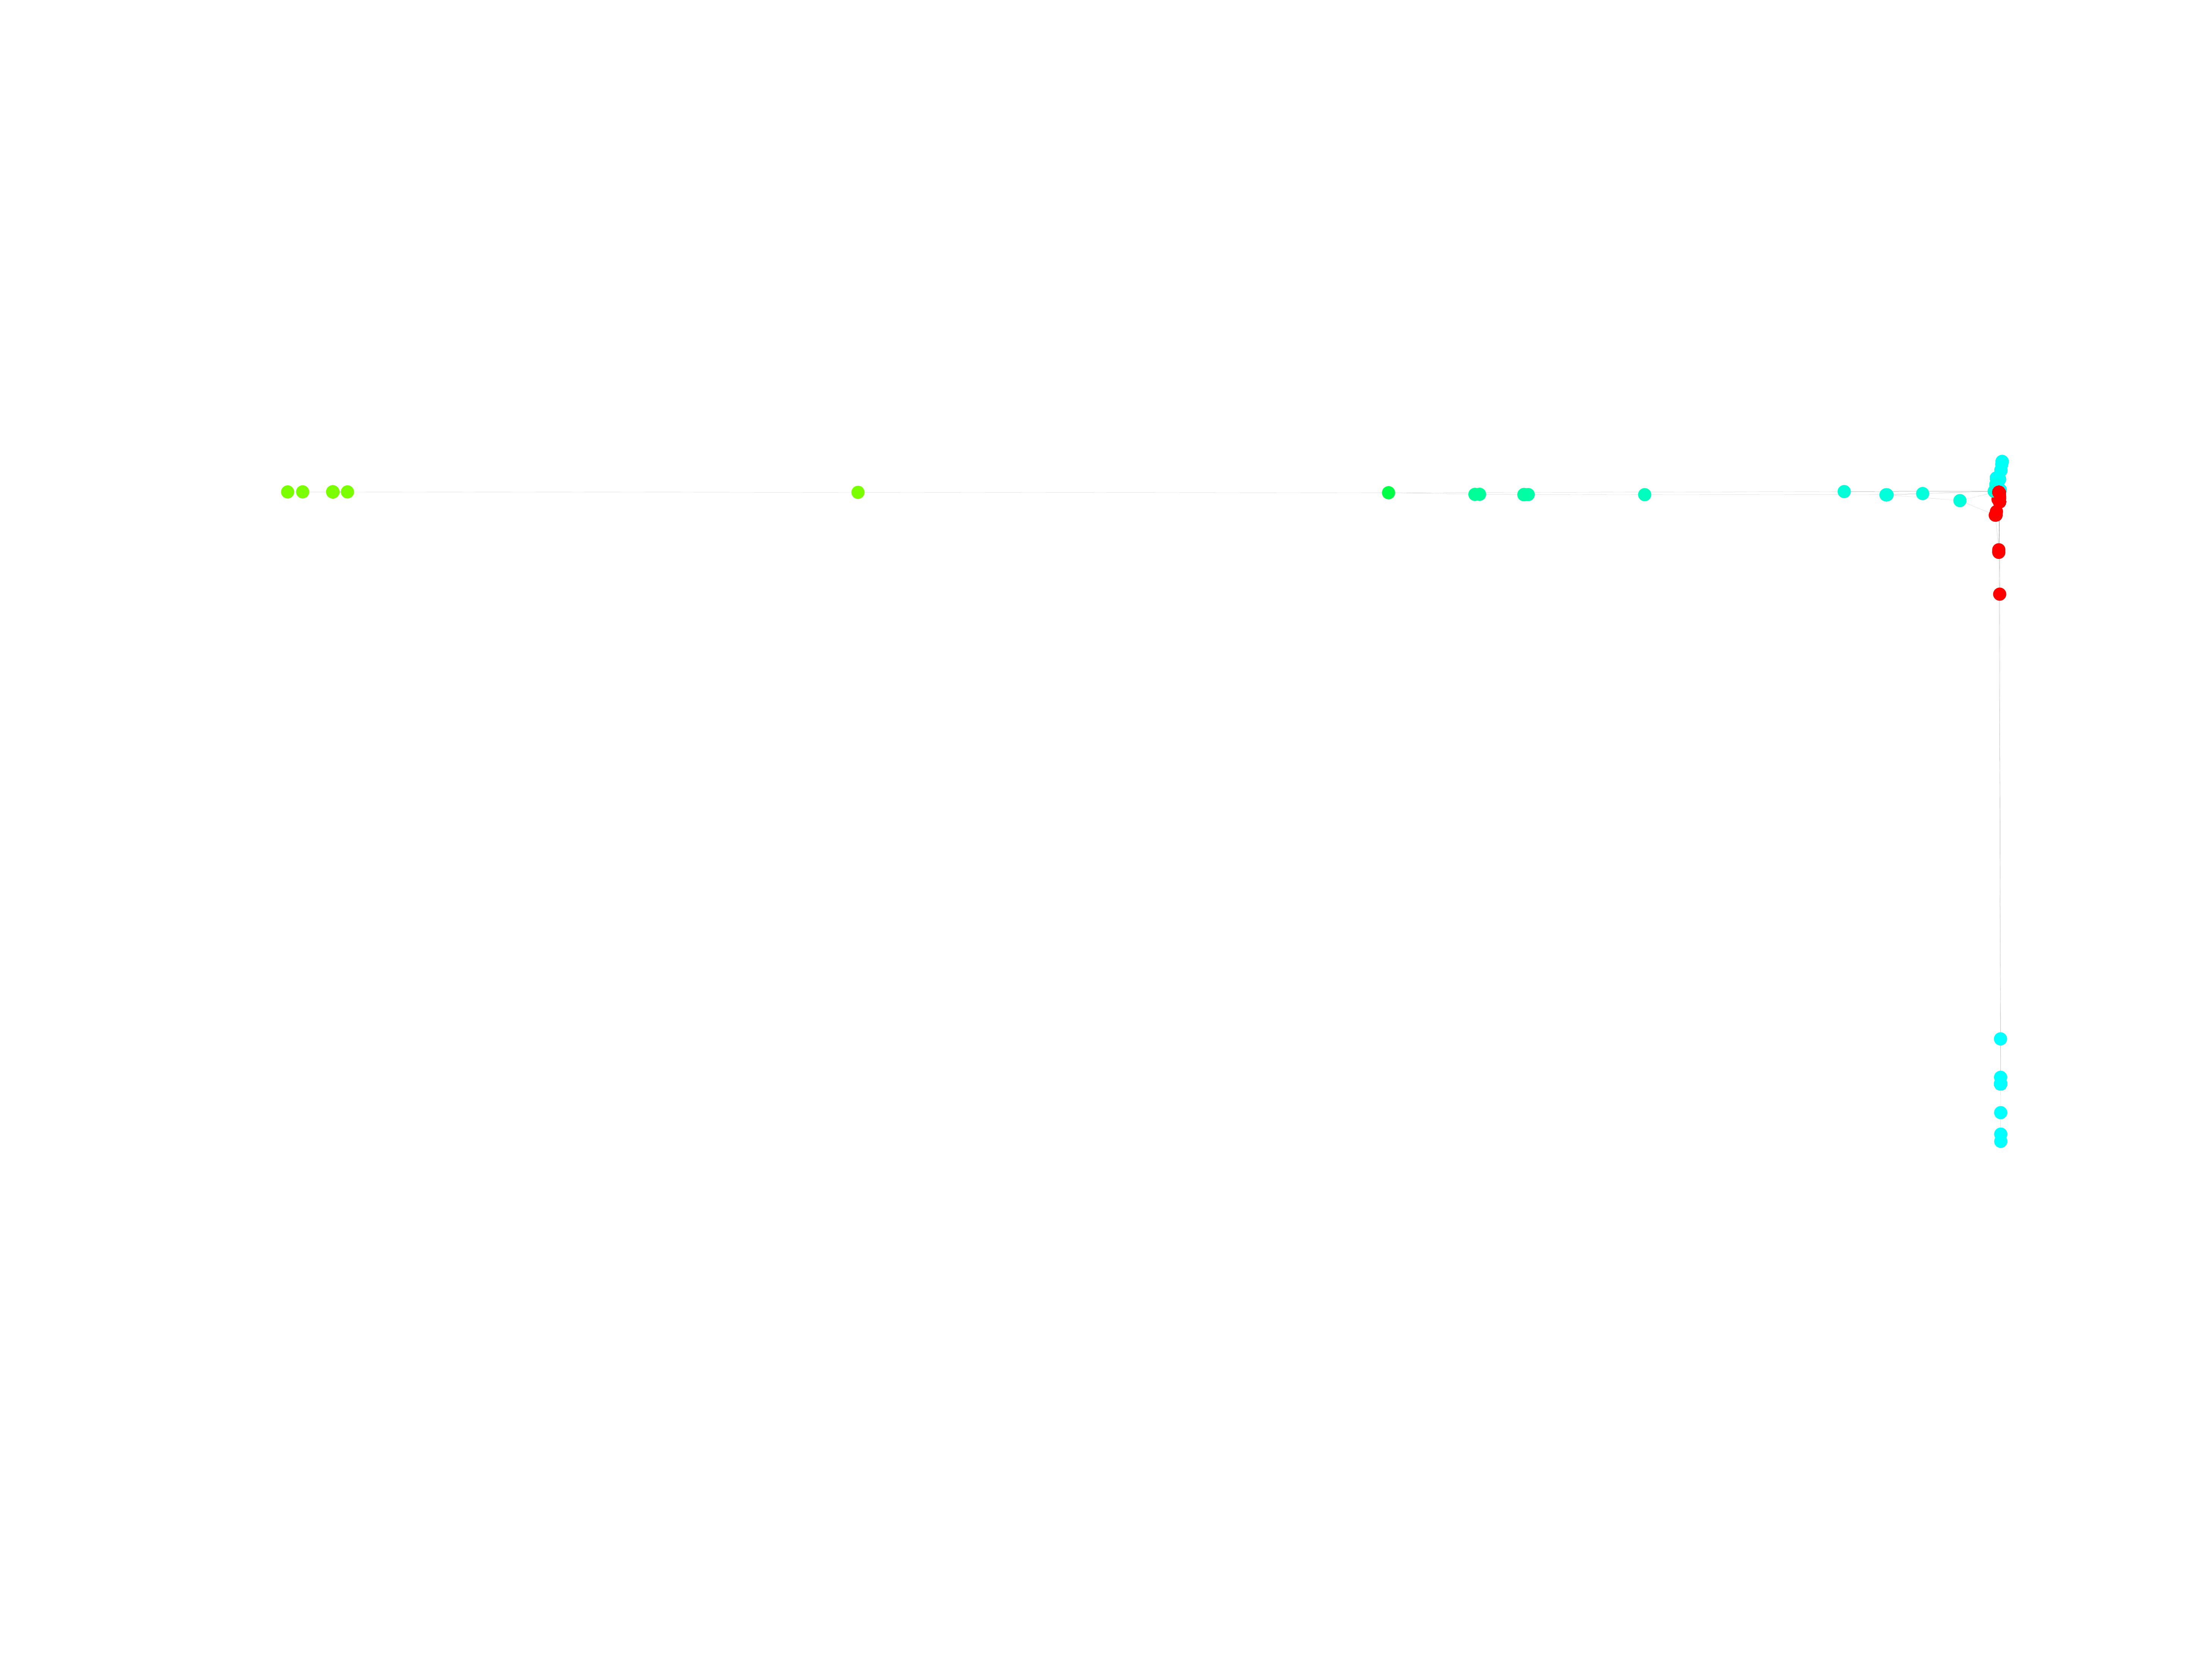
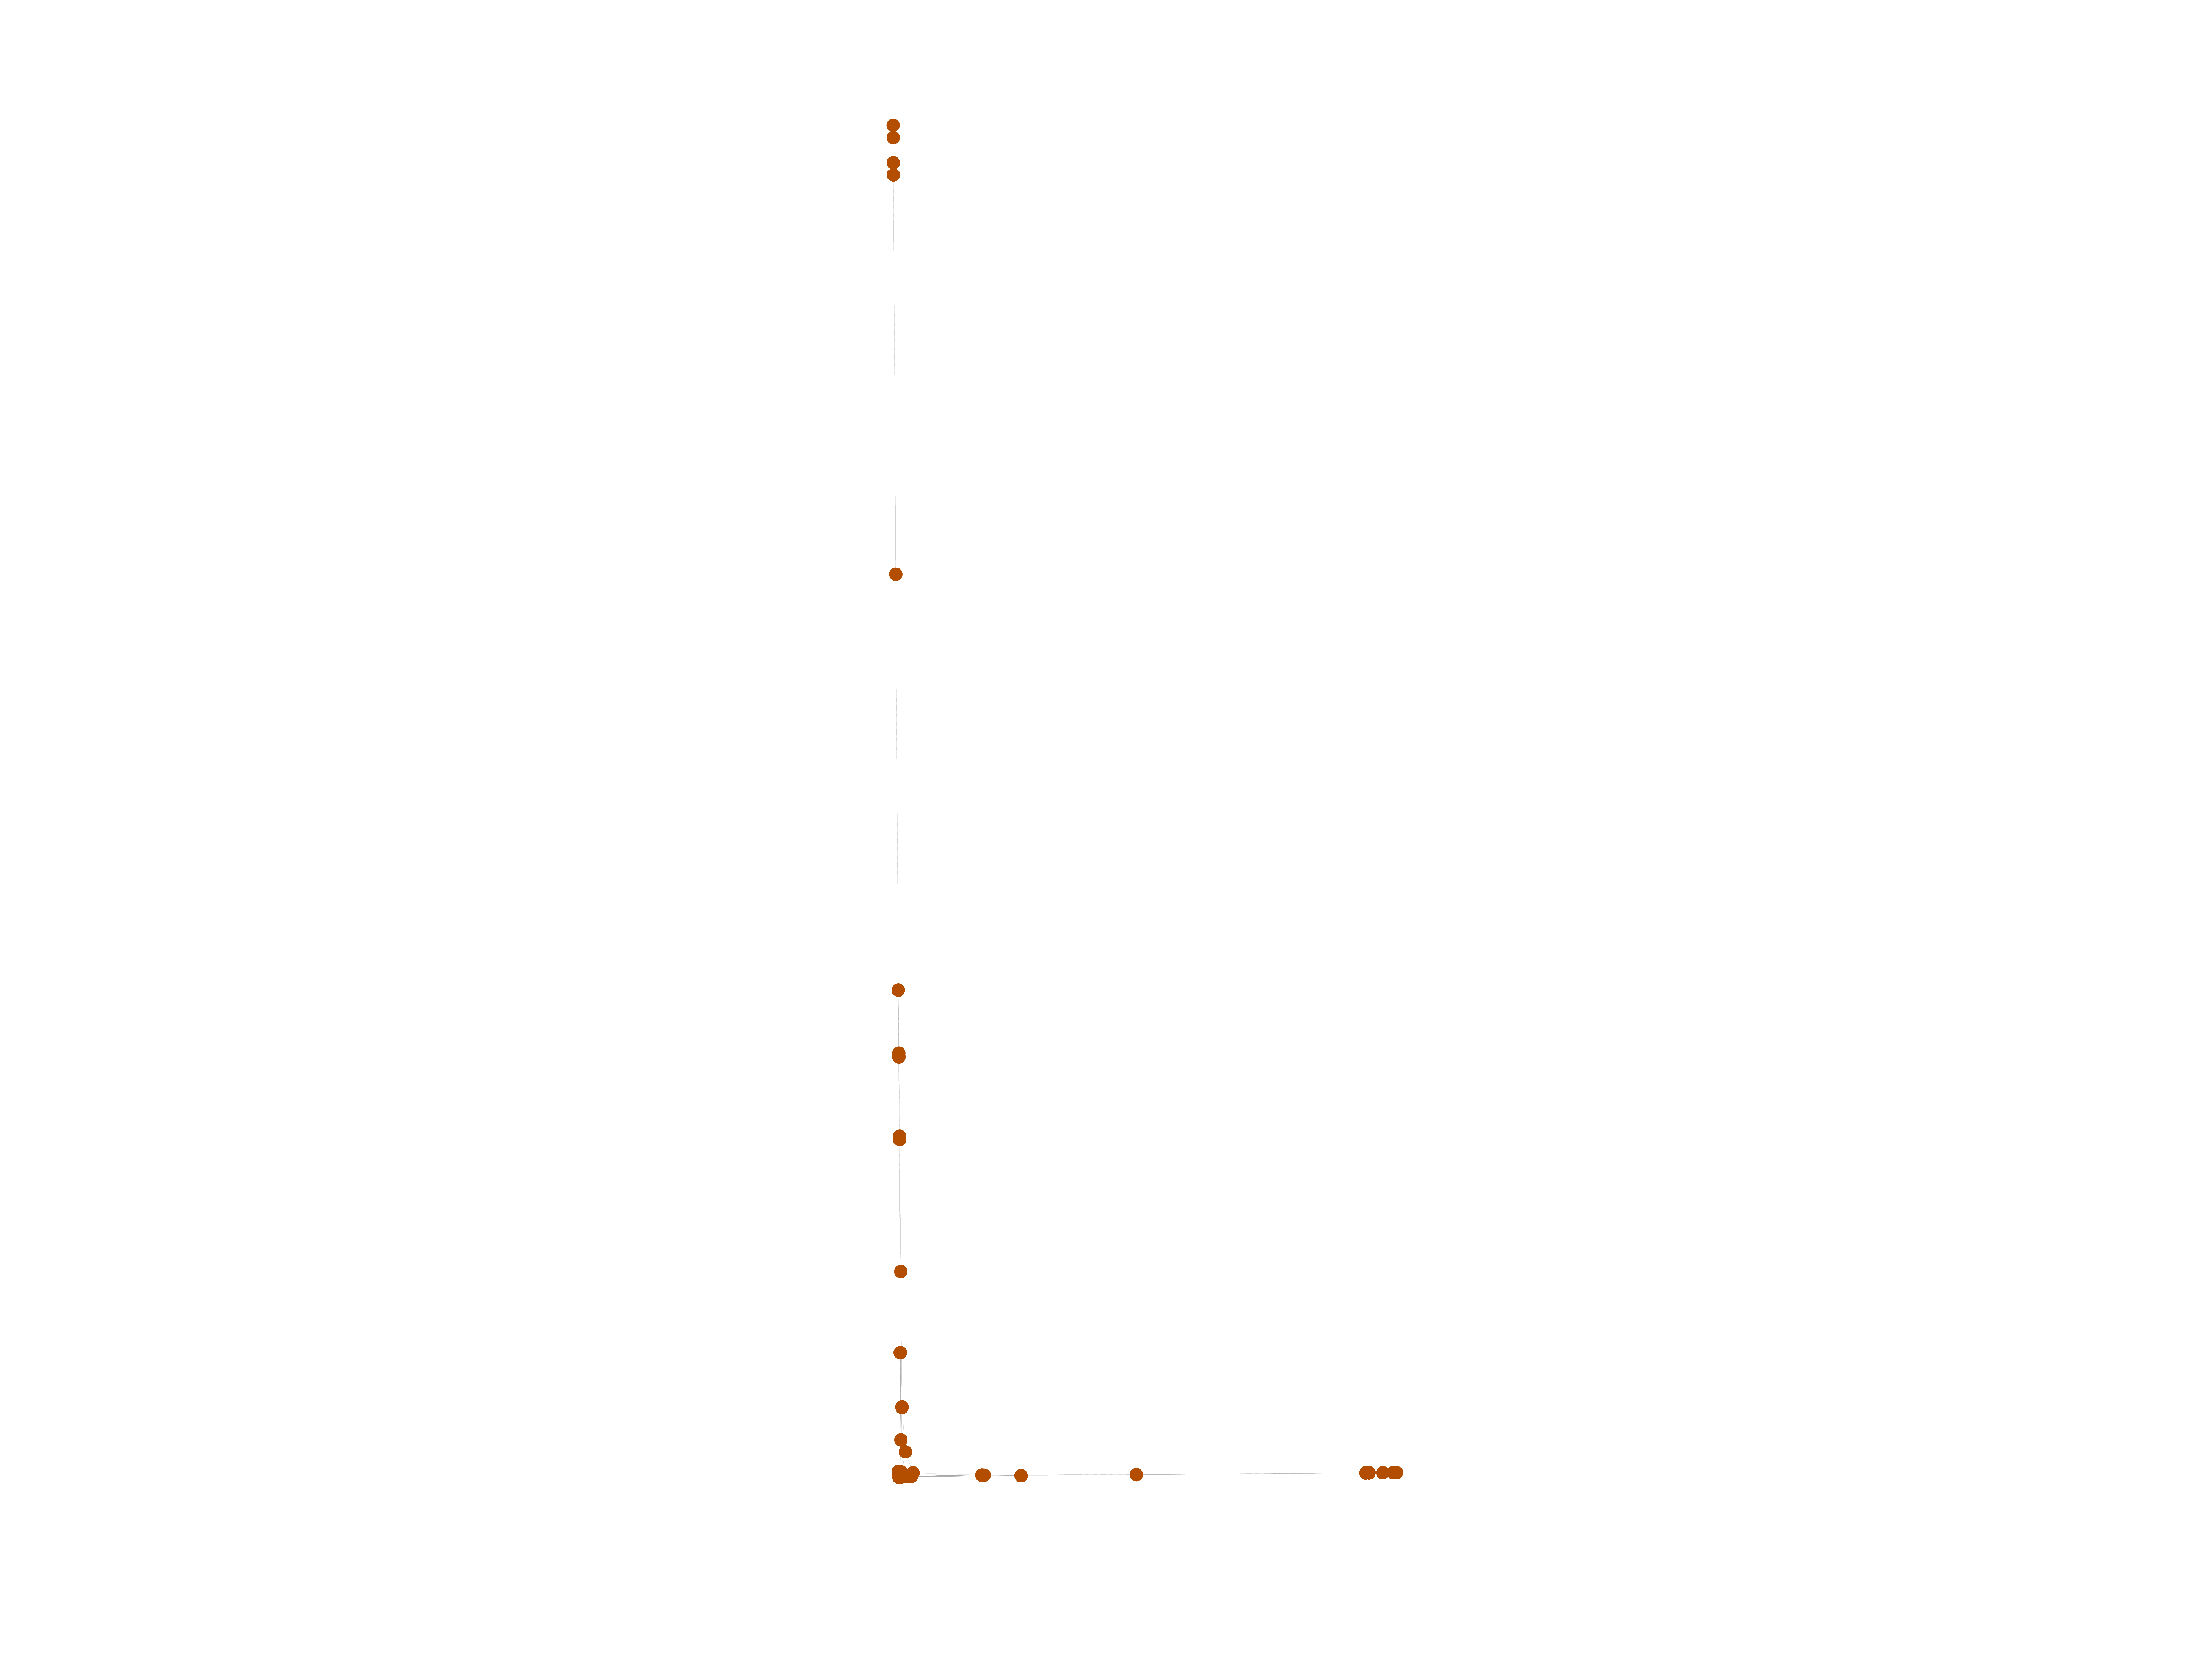
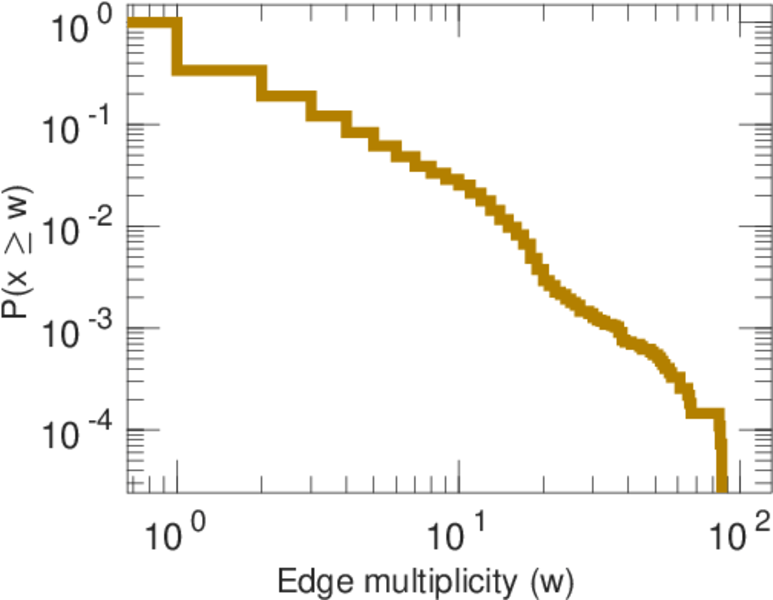
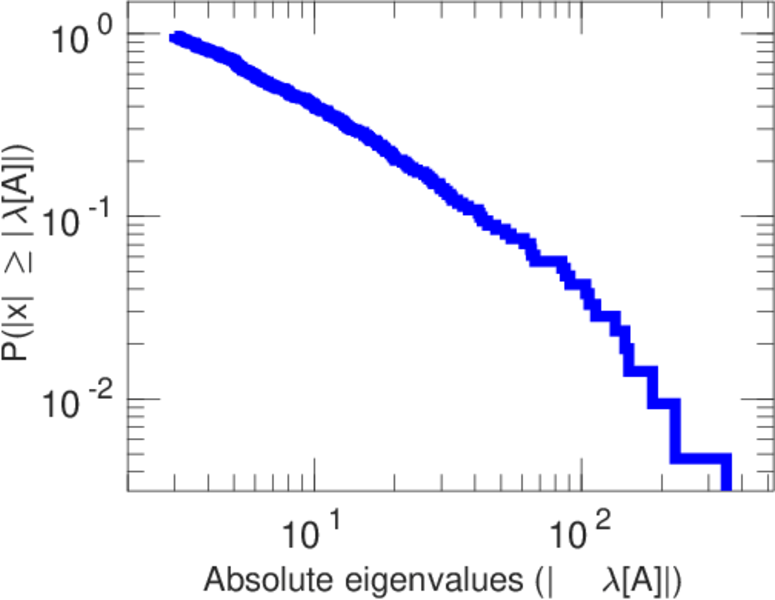
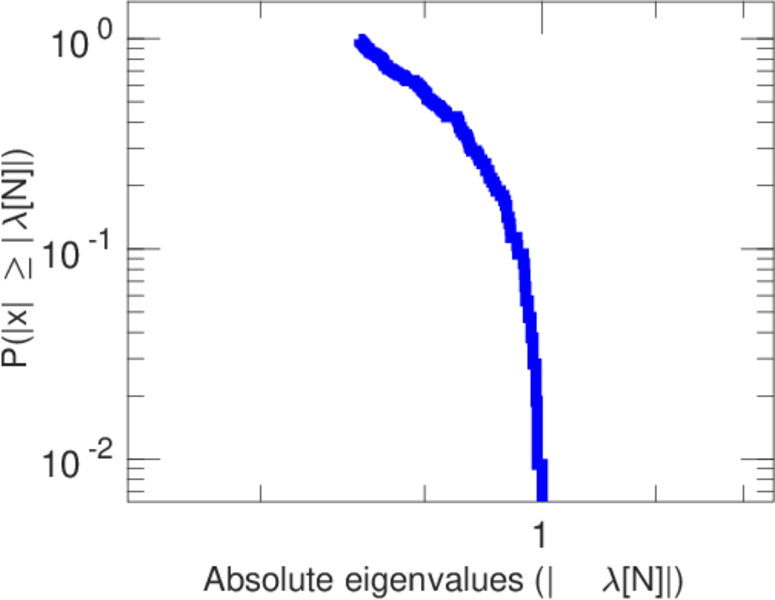
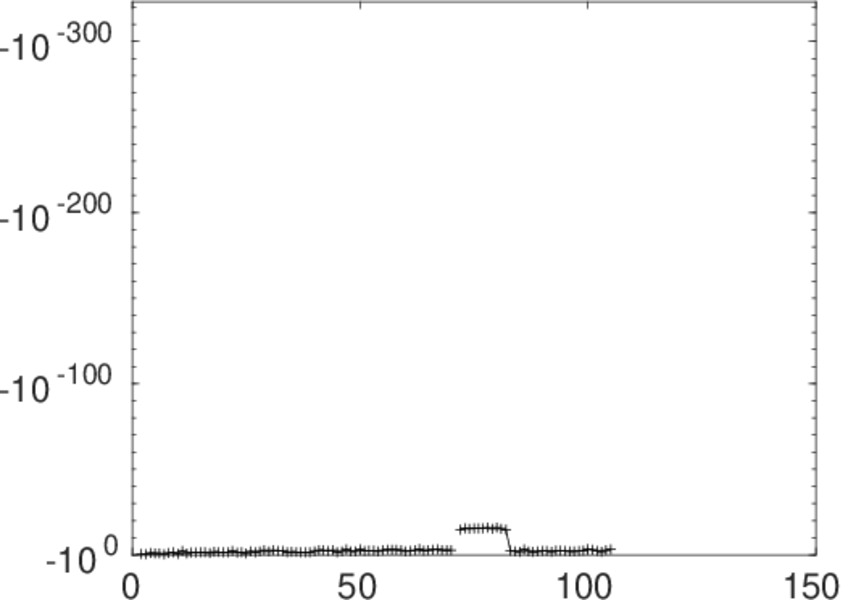
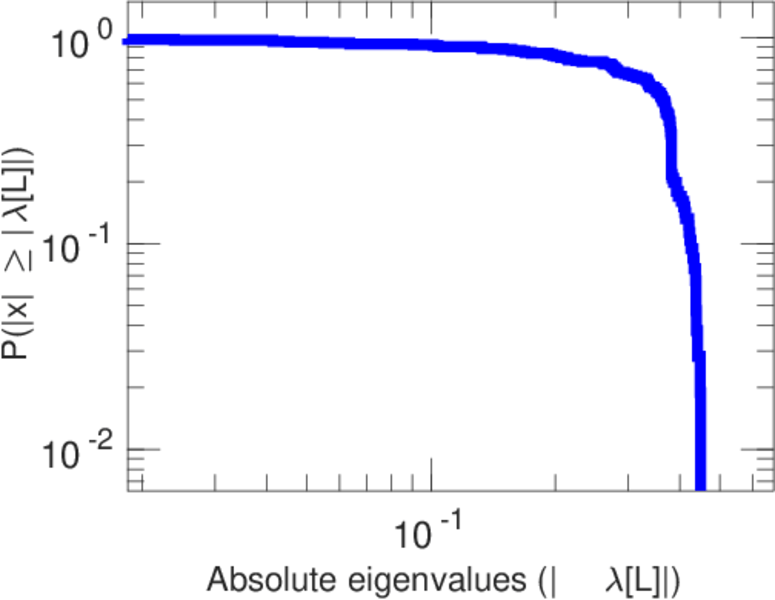
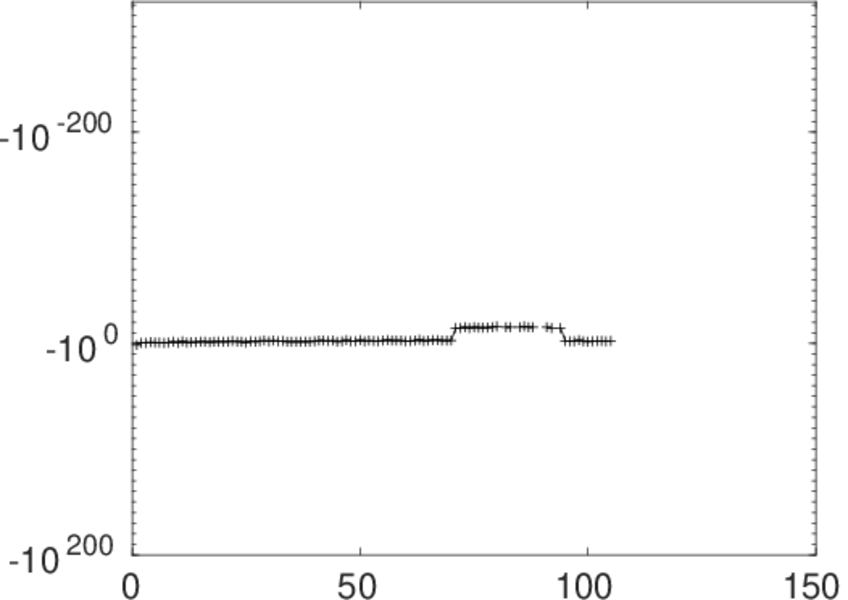
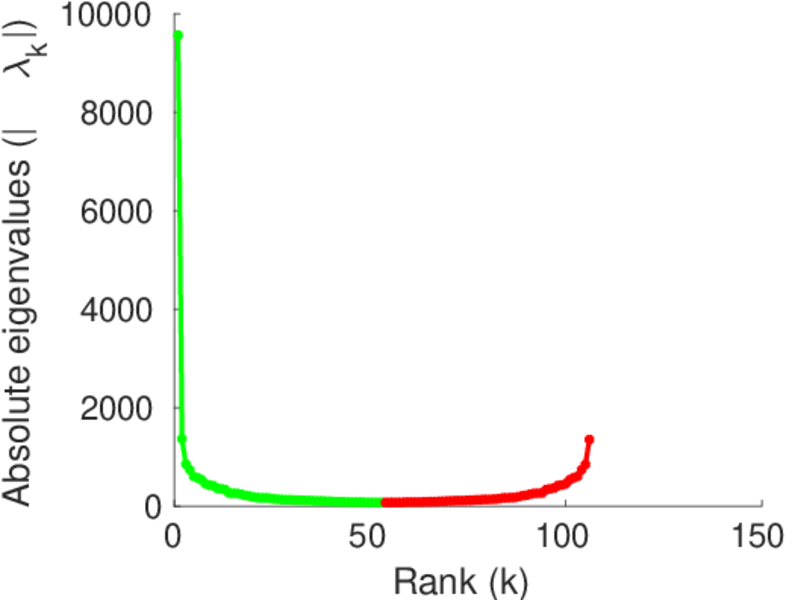
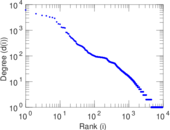
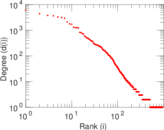
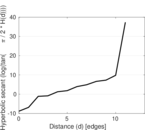
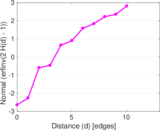
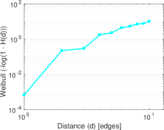
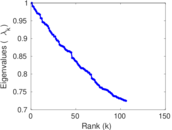
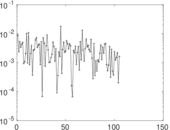
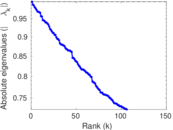
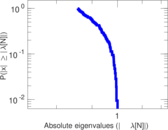
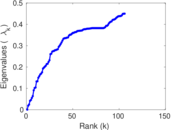
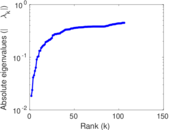
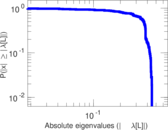
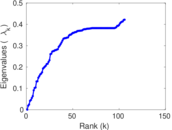
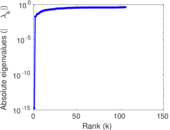
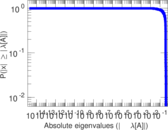
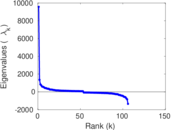
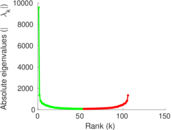
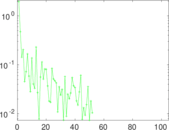
Plots


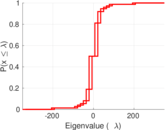
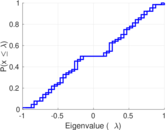
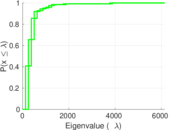


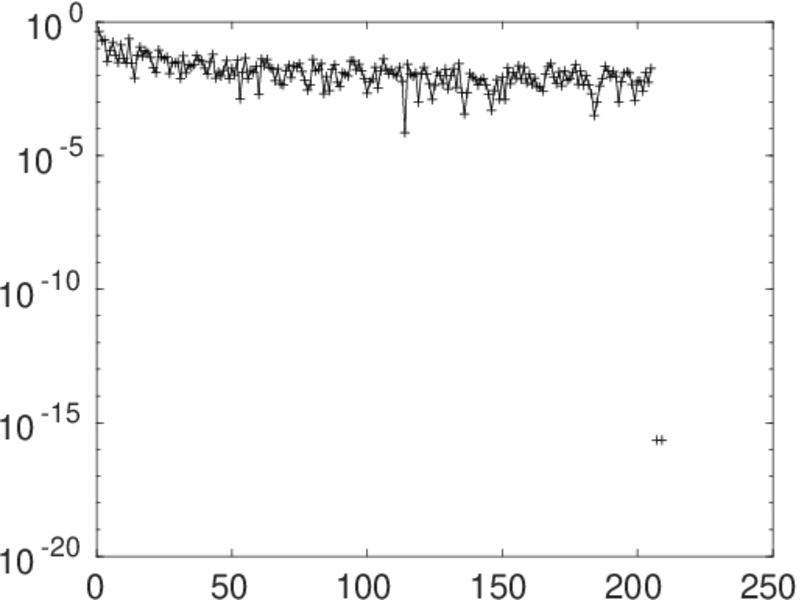
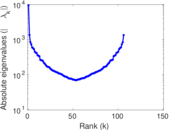
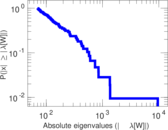
Matrix decompositions plots


Downloads
References
|
[1]
|
Jérôme Kunegis.
KONECT – The Koblenz Network Collection.
In Proc. Int. Conf. on World Wide Web Companion, pages
1343–1350, 2013.
[ http ]
|
|
[2]
|
Wikimedia Foundation.
Wikimedia downloads.
http://dumps.wikimedia.org/, January 2010.
|
 KONECT ‣ Networks ‣
Buy Me a Coffee
KONECT ‣ Networks ‣
Buy Me a Coffee